
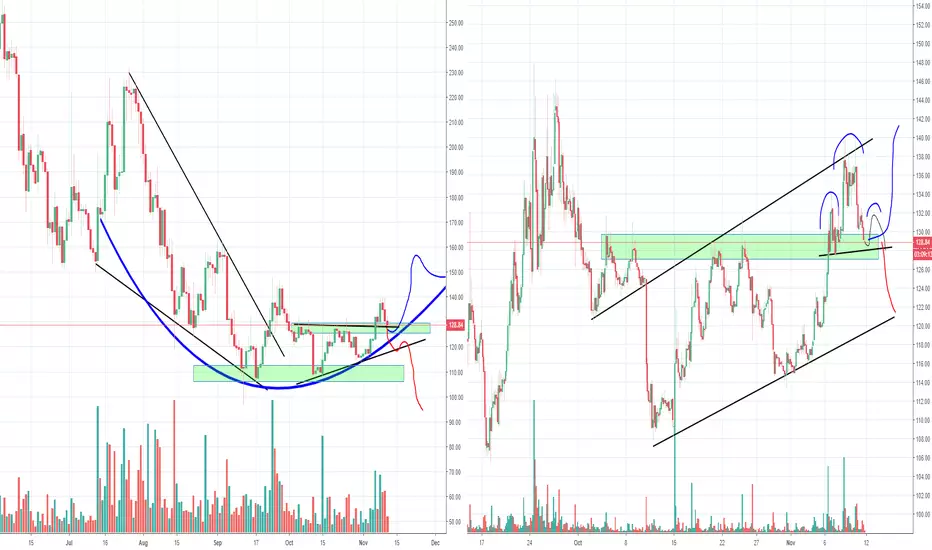
ZEC' is also showing a long term bottom formation like many other of the bigger Altcoins. My previous analysis I caught the low in September where we saw a good volume breakout to the upside. Where we saw a good break of the bullish wedge. Even thought the move up fell short, it does not mean the pattern (bottom formation) is off the table. As long as the price stays above that low of the wedge, the chances remain for a long term move. But what i DO want to see is that the blue curved line stays intact, meaning the higher low formation has to stays intact.
Short term: On the right we can see a few scenario's, I have drawn a black line showing a potential right shoulder. The green level has to hold for now which will depend on Bitcoin' movement the coming day. A break of 126ish will probably mean a drop towards that support line around 120.
Please don't forget to like this if you appreciate it:)
Previous analysis:

Short term: On the right we can see a few scenario's, I have drawn a black line showing a potential right shoulder. The green level has to hold for now which will depend on Bitcoin' movement the coming day. A break of 126ish will probably mean a drop towards that support line around 120.
Please don't forget to like this if you appreciate it:)
Previous analysis:
Nota
Dropped below that support but made a big move up with good volume. That 139/140 resistance still remains to be a very tough one to crack. A break of this level could potentially mean a a move towards the 155/165. But would need some volume at the break of the 140ish.
Aviso legal
As informações e publicações não se destinam a ser, e não constituem, conselhos ou recomendações financeiras, de investimento, comerciais ou de outro tipo fornecidos ou endossados pela TradingView. Leia mais nos Termos de Uso.
Aviso legal
As informações e publicações não se destinam a ser, e não constituem, conselhos ou recomendações financeiras, de investimento, comerciais ou de outro tipo fornecidos ou endossados pela TradingView. Leia mais nos Termos de Uso.