
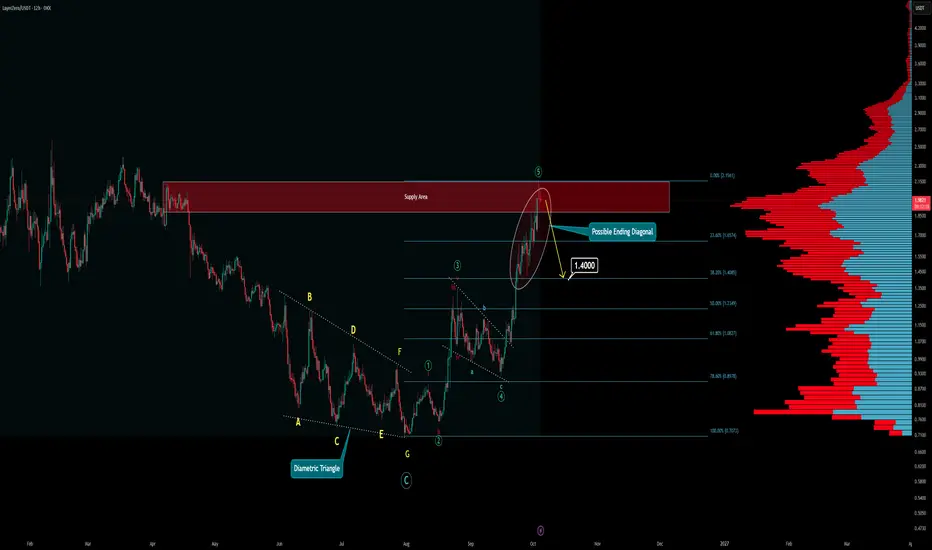
After a long deep dive, ZRO has finally created enough momentum for a fresh new trend.
Examine what happened before to understand what may happen next:
In the main chart (12H), there is a pattern known as a "Diametric." This pattern sometimes forms instead of a classic Ending Diagonal. Ending Diagonals strictly consist of 5 legs, but this one decided to extend sideways and formed a 7-leg structure. According to NEoWave Principles, this is classified as a Diametric.
Why does it matter? Well, the answer is simple: look at what the price did after breaking out. A nearly 200% price surge speaks for itself.
After this pattern broke out to the upside, a 5-wave impulsive move started, and it now seems to be coming to an end.
What evidence supports this?
Let's look at the primary reasons why a wave 5 exhausts:
Momentum Divergence:

Always use multiple indicators to confirm your bias. Two out of three indicators are showing clear bearish divergence on the 4H timeframe, signaling that momentum is rapidly fading.
Volume:

The volume profile confirms the same story: volume is drying up on this push, which is a textbook warning sign.
Visible Supply Zone:
In the main analysis (12H), a Volume Profile anchored from 0 to B (weekly) highlights where the heaviest trading volume accumulated historically.
Put yourself in the shoes of someone who bought ZRO around these price levels last year. You've held through grueling drawdowns and painful nights just to break even. What would you do here?
Now, let's look at both scenarios—what happens if the price pulls back, and what happens if it keeps pushing:
If the price pulls back:
This correction will likely serve as Wave (4) on the weekly chart.

This would mean the broader macro trend is still not over, but a choppy, painful consolidation phase is likely on the horizon.
If the price keeps pushing higher:
I would treat any further upside as a liquidity sweep and a bull trap. It would trap aggressive breakout longs while squeezing early short positions—a textbook setup for exchanges to harvest liquidity. The only caveat is that if this occurs, the projected retracement targets for weekly Wave (4) will need to be recalculated.
Thanks for reading this far. This is how actual structural analysis is done. Follow and learn.
Examine what happened before to understand what may happen next:
In the main chart (12H), there is a pattern known as a "Diametric." This pattern sometimes forms instead of a classic Ending Diagonal. Ending Diagonals strictly consist of 5 legs, but this one decided to extend sideways and formed a 7-leg structure. According to NEoWave Principles, this is classified as a Diametric.
Why does it matter? Well, the answer is simple: look at what the price did after breaking out. A nearly 200% price surge speaks for itself.
After this pattern broke out to the upside, a 5-wave impulsive move started, and it now seems to be coming to an end.
What evidence supports this?
Let's look at the primary reasons why a wave 5 exhausts:
Momentum Divergence:
Always use multiple indicators to confirm your bias. Two out of three indicators are showing clear bearish divergence on the 4H timeframe, signaling that momentum is rapidly fading.
Volume:
The volume profile confirms the same story: volume is drying up on this push, which is a textbook warning sign.
Visible Supply Zone:
In the main analysis (12H), a Volume Profile anchored from 0 to B (weekly) highlights where the heaviest trading volume accumulated historically.
Put yourself in the shoes of someone who bought ZRO around these price levels last year. You've held through grueling drawdowns and painful nights just to break even. What would you do here?
Now, let's look at both scenarios—what happens if the price pulls back, and what happens if it keeps pushing:
If the price pulls back:
This correction will likely serve as Wave (4) on the weekly chart.
This would mean the broader macro trend is still not over, but a choppy, painful consolidation phase is likely on the horizon.
If the price keeps pushing higher:
I would treat any further upside as a liquidity sweep and a bull trap. It would trap aggressive breakout longs while squeezing early short positions—a textbook setup for exchanges to harvest liquidity. The only caveat is that if this occurs, the projected retracement targets for weekly Wave (4) will need to be recalculated.
Thanks for reading this far. This is how actual structural analysis is done. Follow and learn.

Aviso legal
As informações e publicações não se destinam a ser, e não constituem, conselhos ou recomendações financeiras, de investimento, comerciais ou de outro tipo fornecidos ou endossados pela TradingView. Leia mais nos Termos de Uso.
Aviso legal
As informações e publicações não se destinam a ser, e não constituem, conselhos ou recomendações financeiras, de investimento, comerciais ou de outro tipo fornecidos ou endossados pela TradingView. Leia mais nos Termos de Uso.