Long
0x breaking Bearish Line
An update for the last post from 28 of June.
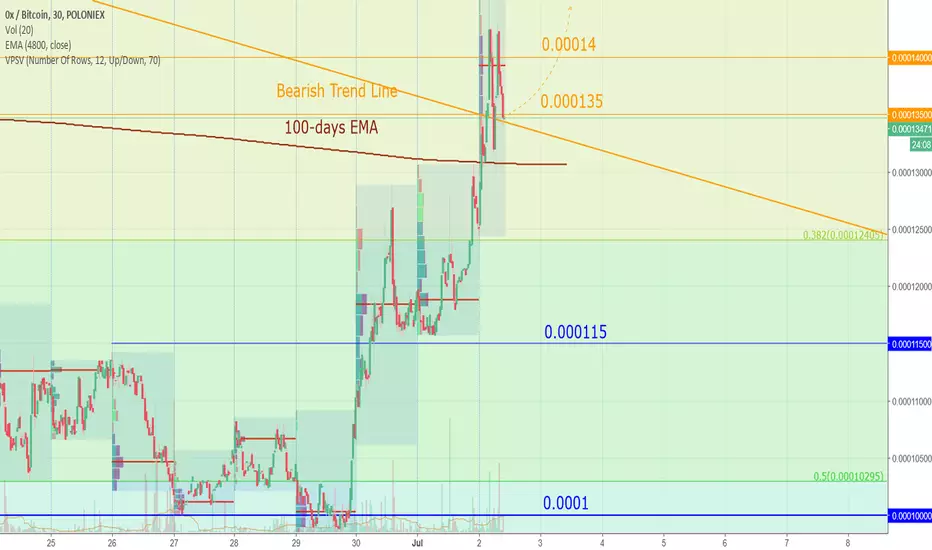
ZRXBTC did draw a rebound pattern, took-off from the 0.0001 level and recently managed to break above the 100-days EMA and reach the Bearish Trend Line; Bearish Trend Line is the boundary of the May downward tendency and breakthrough above it is a proof of the uptrend development. For now, the overall pattern of ZRX looks bullish, and turnaround on 0.0001 level with further uptrend fits well in the bull-trend scenario. If ZRXBTC pair manages to hold above Bearish Trend Line and develop upward momentum - the next resistance on the way up will be 0.00015 level. From the downside, 100-days EMA should play a supportive role in the uptrend scenario.
ZRXBTC did draw a rebound pattern, took-off from the 0.0001 level and recently managed to break above the 100-days EMA and reach the Bearish Trend Line; Bearish Trend Line is the boundary of the May downward tendency and breakthrough above it is a proof of the uptrend development. For now, the overall pattern of ZRX looks bullish, and turnaround on 0.0001 level with further uptrend fits well in the bull-trend scenario. If ZRXBTC pair manages to hold above Bearish Trend Line and develop upward momentum - the next resistance on the way up will be 0.00015 level. From the downside, 100-days EMA should play a supportive role in the uptrend scenario.

Publicações relacionadas
Aviso legal
As informações e publicações não se destinam a ser, e não constituem, conselhos ou recomendações financeiras, de investimento, comerciais ou de outro tipo fornecidos ou endossados pela TradingView. Leia mais nos Termos de Uso.
Publicações relacionadas
Aviso legal
As informações e publicações não se destinam a ser, e não constituem, conselhos ou recomendações financeiras, de investimento, comerciais ou de outro tipo fornecidos ou endossados pela TradingView. Leia mais nos Termos de Uso.