
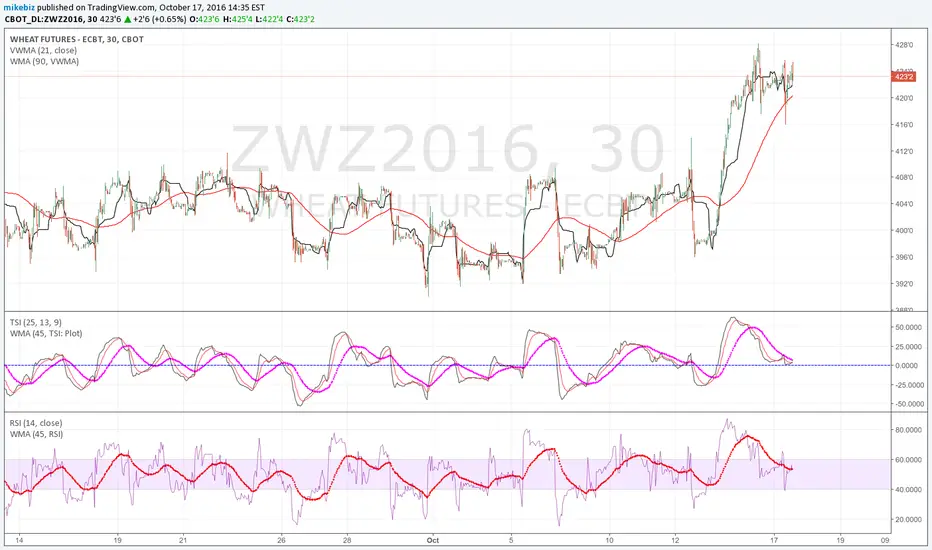
Looking at 30M chart, it's possible that wheat has made its pullback. The TSI could be finding support at 0 and RSI on 40. Based on next open and if these indicators move up off this support may try a dec wheat call.
Looking at the daily chart, the RSI and TSI look bullish and the ADX with +DMI looks like it could be setting up a change in dominance from down trend.

Daily looks like it hit some resistance at the 23.6% retrace area between the 6/8 high and 8/31 low. I think that price will move up to challenge other areas of retrace as noted on daily chart.
Looking at the daily chart, the RSI and TSI look bullish and the ADX with +DMI looks like it could be setting up a change in dominance from down trend.
Daily looks like it hit some resistance at the 23.6% retrace area between the 6/8 high and 8/31 low. I think that price will move up to challenge other areas of retrace as noted on daily chart.

Publicações relacionadas
Aviso legal
As informações e publicações não se destinam a ser, e não constituem, conselhos ou recomendações financeiras, de investimento, comerciais ou de outro tipo fornecidos ou endossados pela TradingView. Leia mais nos Termos de Uso.
Publicações relacionadas
Aviso legal
As informações e publicações não se destinam a ser, e não constituem, conselhos ou recomendações financeiras, de investimento, comerciais ou de outro tipo fornecidos ou endossados pela TradingView. Leia mais nos Termos de Uso.