Long
Long
 Long
Long
 Long
Long
 Long
Long
(GOLD)-XAUUSD | (1D) | Trend Analysis | Prof.TraderTilkiGuys, greetings,
Everyone is making comments about gold now, but I want to give you important insights.
Although gold makes intraday upward moves, according to the daily analysis it is still in a downtrend. Don’t forget this. For us to say gold has reversed, it must break above 4430 and 4300. These levels are key, and I emphasize their importance strongly.
If gold rises above these levels, makes a pullback, and takes support again, then my target will be 4700.
But for now, the rules to confirm a trend reversal have not yet formed.
I share these updates because I care about you.
Guys, I continue these analyses thanks to your likes. Thank you to everyone who supports with likes.  Long
Long
Short 
Inside Bitcoin Magazine’s Retweet — Jack Dorsey Pays with BTCA widely shared post on social media highlighted Block CEO Jack Dorsey’s decision to pay with Bitcoin at a counter. This tweet, amplified by Bitcoin Magazine, has sparked significant discussion online and reflects the ongoing interest in cryptocurrency’s real-world applications. The original tweet can be viewed here.
The Key Development
The tweet from Bitcoin Magazine, which garnered 542 likes and 80 retweets, emphasizes a notable moment in cryptocurrency adoption. Dorsey’s action represents not just a personal financial choice but also serves as a symbol of Bitcoin’s increasing acceptance in everyday transactions. This incident resonates within a broader context, where discussions around Bitcoin’s utility are becoming more prevalent, especially amid mixed signals in the broader crypto market.
Key Takeaways
Jack Dorsey utilized Bitcoin for a payment, Bitcoin Magazine amplified the tweet, the tweet received significant engagement from the community.
The Numbers
Currently, the cryptocurrency market is experiencing mixed signals, with variable momentum across different assets. As noted, no specific price movements or trading volumes are reported at this moment. However, the social media buzz surrounding Dorsey’s payment could influence community sentiment and engagement levels in the short term.
Jack Dorsey, a prominent figure in the Bitcoin community, has been a vocal advocate for cryptocurrency adoption. His company, Block, has integrated various cryptocurrency functionalities, pushing for wider acceptance. This recent transaction aligns with Dorsey’s ongoing efforts to promote Bitcoin and reflects the growing trend of cryptocurrencies being used in everyday scenarios.
Key Levels to Watch
Traders and community members are closely watching social media engagement around Bitcoin and its real-world applications. The excitement generated by Dorsey’s payment could lead to increased discussions and potential adoption among businesses. Additionally, this trend of high-profile endorsements might encourage more users to explore Bitcoin payments, especially if they witness practical implementations in their daily lives.  Short
Short
XAUUSD Daily - Watching for Wave 5 CompletionXAUUSD remains in a bearish trend on the daily timeframe, continuing to form lower highs and lower lows. The current decline appears to be the final leg of a larger bearish cycle, with sellers maintaining control as price moves toward a significant liquidity area.
From an Elliott Wave perspective, the market appears to be developing Wave 5 following the completion of Waves 1 through 4. As this final bearish leg unfolds, price is approaching a major demand zone between 4,084 and 4,119, where Wave 5 could potentially terminate.
This area is particularly important because it represents a key liquidity objective below recent lows. Markets often seek liquidity before establishing a meaningful reversal, and a move into this zone could trigger a final sweep of sell-side liquidity. Such a move would help clear remaining downside liquidity and potentially create the conditions for buyers to step back into the market.
As price approaches the demand zone, traders should monitor for signs of seller exhaustion, including a liquidity sweep, strong rejection from the lows, or a bullish market structure shift. These developments would suggest that the market has completed its liquidity objective and that the bearish cycle may be nearing its end.
While the broader trend remains bearish for now, the 4,084–4,119 region stands out as a high-interest area where liquidity, market structure, and Elliott Wave projections converge. If buyers begin to absorb selling pressure within this zone, it could signal the completion of Wave 5 and the start of a larger corrective recovery. Short 
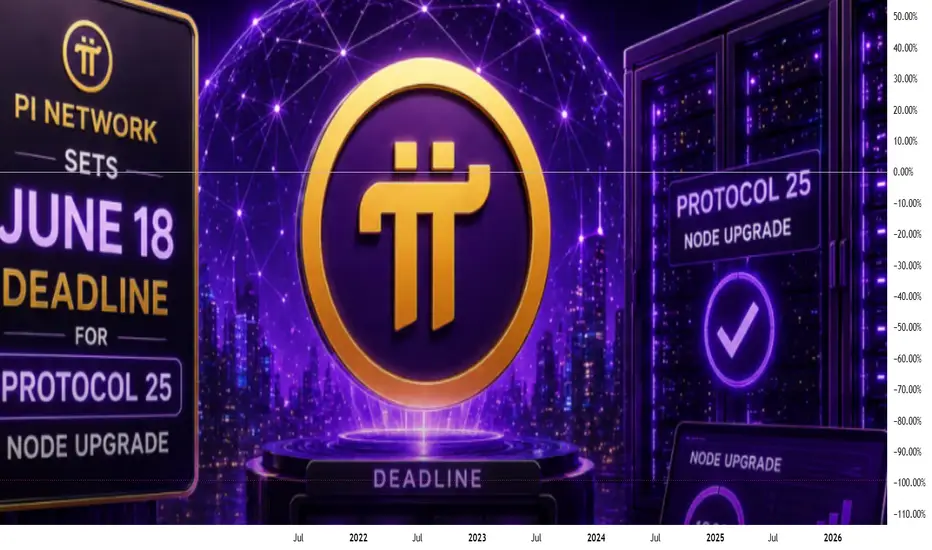
Pi Network Sets June 18 Deadline for Protocol 25 Node UpgradePi Network has entered another important phase of its mainnet development. The Pi Core Team announced that all mainnet node operators must complete the upgrade to Protocol 25 by June 18, 2026, or risk losing connection to the network. The update is part of Pi Network’s long-running roadmap that is gradually moving nodes from Protocol 19 through Protocol 26.
In a post on X, the team reminded node operators to plan ahead for the migration. The announcement quickly sparked discussion across the Pi community, with operators preparing for another network-wide transition.
Protocol 25 Marks the Next Step in Pi’s Upgrade Path
The latest upgrade follows the successful rollout of Protocol 24 and continues Pi Network’s sequential migration process. According to the roadmap, nodes must upgrade in order and cannot skip versions. The current path moves from version 24.1 to 25.2, with Protocol 26 expected to follow at a later date.
Unlike some previous migrations, the Protocol 25 upgrade is designed to be relatively quick. Pi Network said most nodes should experience less than five minutes of downtime during the process. However, the team advised operators not to upgrade all nodes simultaneously. Instead, they should redirect traffic to other nodes or use Pi’s mainnet API infrastructure while the migration is underway.
Node Operators Begin Preparing for June 18
The deadline has already caught the attention of the community. Pi advocate PiNetwork DEX said he plans to notify node operators to complete upgrades in batches before June 18 to help ensure a smooth transition across the network.
Questions also surfaced about node participation and network growth. Some community members asked whether the total node count has approached 400,000 and where updated testnet statistics can be viewed. While the Core Team has not commented on those figures, the discussion highlights growing interest in the health and scale of the Pi Network ecosystem.
Upgrade Process Differs by Node Type
For users running Pi Desktop on Windows or macOS, the process is largely automatic. The protocol update will trigger when the node software starts. Linux users operating through the newer Pi Linux Node CLI may not need to take action if auto-updates are enabled. Those without automatic updates must manually run the upgrade command.
Meanwhile, operators using legacy self-managed Docker containers will need to update their Docker image and restart services using the latest Protocol 25 release. Pi Network stressed that operators should monitor synchronization status after upgrading to confirm the migration has completed successfully.
What This Means for Developers and Investors
For developers, Protocol 25 is another sign that Pi Network continues to strengthen its infrastructure ahead of future upgrades. Consistent node participation is critical for network stability, scalability and future ecosystem growth. For investors and community members, the upgrade itself is not a direct price catalyst. But it demonstrates that the project is continuing to execute its technical roadmap despite ongoing market volatility.
That progress comes at a time when Pi Network remains under pressure from large token unlocks and weak market sentiment. Many holders are closely watching whether ecosystem development can eventually offset the additional supply entering circulation. As June 18 approaches, the focus now shifts to node operators. Their ability to complete the Protocol 25 migration on time will help determine how smoothly Pi Network advances toward the next stage of its mainnet evolution. Long 
Long 
BTC/USD 4H Short Trade PlanBTC/USD 4H Short Trade Plan
Instrument: BTC/USD (Bitcoin vs US Dollar)
Timeframe: 4H (4 Hour)
Trade Bias: Short Sell at market price
• Entry: Around 81582.000
• Stop Loss: 84863.000
• TP1: Around 77627.000 → Close 50% position, move SL to break-even for protection
• TP2: Around 74464.000 → Reduce half of remaining position, trail SL to lock profit
• TP3: Around 71000.000 → Reduce half of remaining position again, trail SL for further protection
• Remaining Position: Hold with trailing stop loss, let the market run
Risk Disclaimer
Cryptocurrency trading involves extreme market volatility, high risk, and sudden price fluctuations. Regulatory changes, market news, and liquidity shocks may trigger stop loss orders. This trading plan is for technical analysis and educational reference only, does not constitute investment advice, and does not guarantee any profits. All trading profits and losses shall be solely borne by the trader.  Short
Short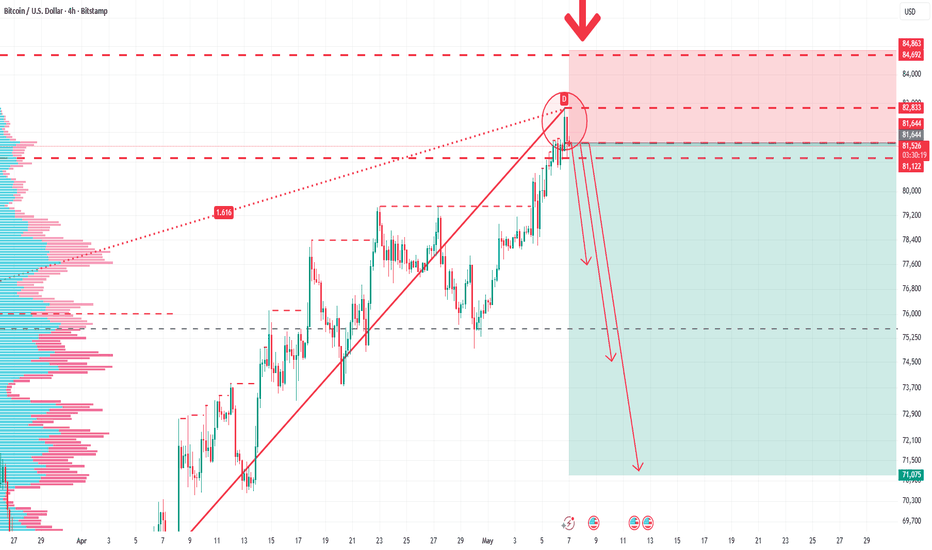
 Short
Short
Eurousd buy analysisHere is a detailed breakdown of the TradingView chart you uploaded, covering the asset details, price movement, and the active trade setup.
## 1. Asset & Chart Details
* **Currency Pair:** **EUR/USD** (Euro vs. U.S. Dollar).
* **Timeframe:** **1h** (1-Hour chart), meaning each individual candlestick represents one hour of price action.
* **Data Source:** **FXCM** (a major forex broker providing the price feed).
* **Current Price:** **1.16462**, which is up +0.00190 (+0.16\%) at the time of the screenshot.
* **Countdown:** The yellow label under the price shows **17:22**, indicating there are 17 minutes and 22 seconds left before the current 1-hour candle closes.
## 2. Recent Price Action
Looking from left to right across the chart:
* **The Downtrend:** On the left, the market experienced a sharp downward move.
* **Consolidation/Base Building:** The price found a bottom and spent the next few days (indicated by the dates 22 through 27 at the bottom) moving sideways, forming support and resistance zones.
* **Recent Recovery:** Over the last 24 hours (approaching the 27th), the price has broken out of its local consolidation range and is trending upward toward the yellow dotted line.
## 3. The Trade Projection (The Long Setup)
On the far right, a green and red **Long Position** tool is active. This represents a hypothetical or planned buy trade based on an expected price path (drawn with the green arrow).
### Predicted Path:
The green arrow outlines a **"Retest and Rally"** strategy:
1. It expects the price to pull back slightly into the green zone to find support (around the **1.16279** area).
2. From there, it projects a sharp move upward toward the target.
### Key Trade Levels:
* **Profit Target (Take Profit):** **1.16711** (The top of the green box). If the price hits this level, the trade closes automatically with a profit.
* **Entry / Mid-point Level:** **1.16279** (The line separating the green and red boxes, where the ideal entry or key support lies).
* **Invalidation Level (Stop Loss):** **1.16082** (The bottom of the red box). If the price drops to this level, the trade closes automatically to prevent further losses.
## 4. Interface Elements
* **Toolbar:** A floating drawing toolbar is visible at the bottom left, showing selected tools like trend lines, text, and cursors.
* **Navigation:** The bottom bar displays standard TradingView mobile app tabs: *Watchlist, Chart, Explore, Community,* and *Menu*.
 Long
Long
 Long
Long