XAUUSD (Gold) Setup: MultiTarget Long Structure & Resistance TeGold (CFDs on Gold, 1-hour timeframe) is building solid bullish momentum after defending structural lows. Price action highlights a clear multi-target long opportunity as it pushes toward upper resistance and liquidity zones.
Key Technical Highlights:
Support Base & Structure: Following the previous correction, price has respected the major lower demand area and carved out a clean higher low above the 4,046 region.
Intermediate Target: The first key objective (Target 1) is set around the interim
AB=CD
GBP/USD | Rejection at Key Supply Favors Move Towards 1.3000GBP/USD has rallied into a key area of technical confluence, where I believe bullish momentum is beginning to lose strength. Following the completion of an A–B–C corrective structure, price has tested a well-defined 4-hour rejection area positioned beneath the 15th June High and in close proximity to the 200-period moving average. This region represents a significant supply zone where sellers have previously demonstrated control. Combined with elevated RSI readings and the completion of the corr
AUDUSD: Bearish Confluence at April Highs, Targeting 0.7000AUDUSD is approaching a significant resistance confluence beneath the April Highs, where multiple technical factors suggest the potential for a bearish reversal. Price is currently forming the right shoulder of a Head & Shoulders pattern while simultaneously trading into a key liquidity pool above prior highs, creating the possibility of a buy-side liquidity sweep before lower prices. This area also coincides with the completion of an AB=CD harmonic structure, while the projected downside target
#USDCAD: From 400 To 900+ Pips Trade Setup! 🔺The USDCAD pair has been bullish since the conflict in the Middle East began. This is because the US dollar is the primary investment vehicle for global investors, which has contributed to the strong performance of the DXY. Consequently, the USDCAD prices have risen by over 1000 pips in a short period.
🔺In forex, no pair moves at such a rapid pace. Given the unique situation, we anticipate a strong bullish volume to continue increasing in the near future, with the price potentially reaching 1.
EUR/USD Elliott Wave Analysis | 23 July 2026The market always leaves clues. In this analysis, I break down the current EUR/USD structure using Elliott Wave Theory, market structure, liquidity, and supply & demand to identify the next potential move.
🎯 What you'll learn: ✔ Elliott Wave count ✔ High-probability selling zones ✔ Market structure & liquidity ✔ Risk management principles ✔ Potential bearish targets
⚠️ Disclaimer: This analysis is for educational purposes only and should not be considered financial advice. Always do your own r
MANAUSDT: AB=CD Pattern Signals More Downside?#MANA continues to respect its bearish market structure, with sellers firmly in control. On the 1-hour timeframe, price is developing a Bearish AB=CD Harmonic Pattern, indicating that another leg lower could be approaching.
Analysis Timeframe: 1H
Bias: Bearish 🔴
However, there is currently no bullish confirmation on the chart. Trying to catch a bottom in a strong downtrend can be risky, so patience remains the best strategy.
Trade Plan
Bearish AB=CD pattern is nearing completion.
Overall tr
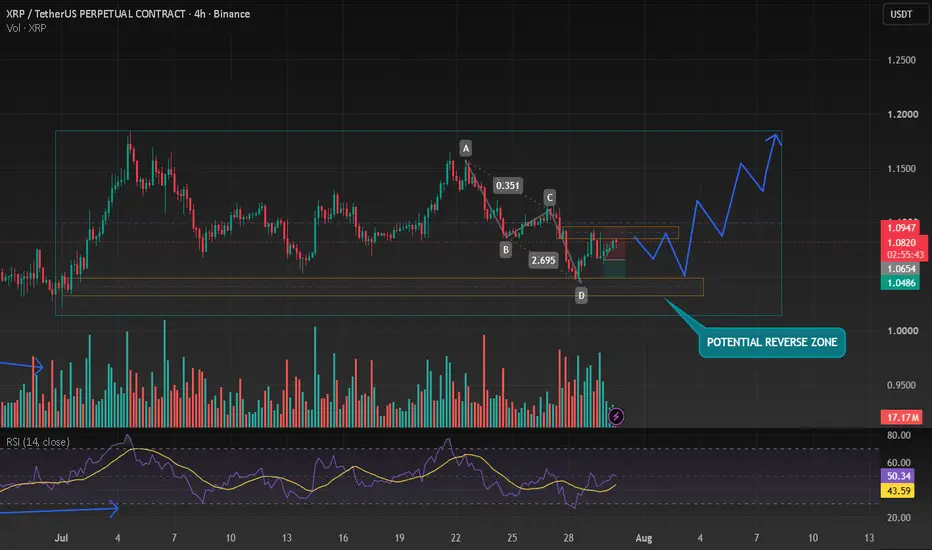
EUA dec26 potencial shortA bearish harmonic pattern has emerged on the 1-hour TF, which matches the ABCD pattern on the 4-hour TF. You can see two possible ranges of targets: one more conservative and the other more advanced. Huge volume at around 81.7 and a little less at around 83. Fundamentally CDS strongly in the money in Q4 (bullish support).
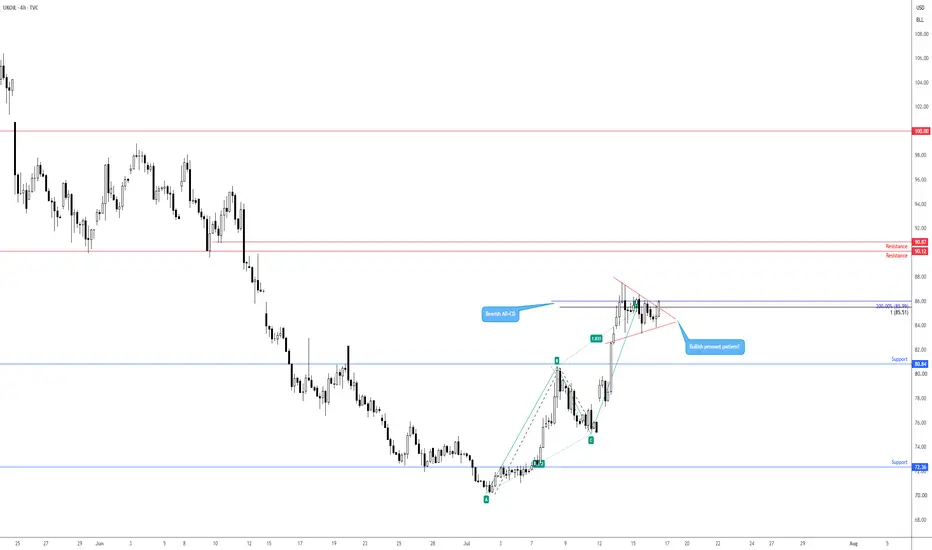
Brent crude about ready to burst?With Middle East flare-ups still front and centre and geopolitical risk premium being priced into oil, the technical picture on Brent crude right now shows a potential breakout brewing.
As shown in the chart, between US$87.55 and US$83.32, we have seen price build out a pennant pattern, with the unit not far from the formation’s apex and looking about ready to burst. Price is now on the verge of breaking out higher, perhaps clearing the path for a run towards a resistance zone between US$90.87
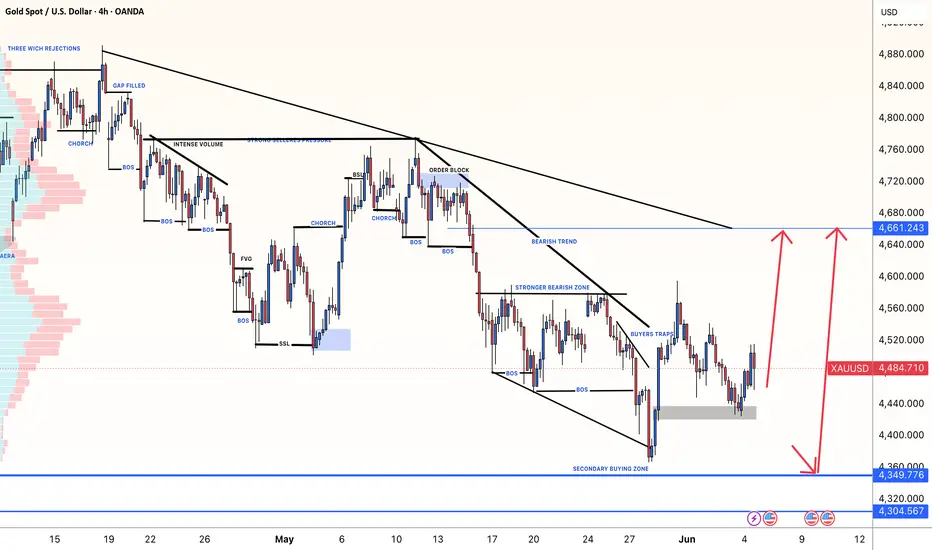
XAUUSD: Gold To Hit $4650 And Beyond! 04/06/2026Gold is poised to continue its upward trajectory towards our target zone at $4650 and potentially beyond. Currently, the price has formed an AB=CD pattern which is already confirmed and completed. This pattern suggests a sharp price breakthrough once it’s finished forming. Strong fundamental support is also needed to weaken the DXY. Good luck and trade safely.
Like and comment for more analysis.
The Setupsfx_ Team
XAUUSD ANALYSIS READ CAPTION Buying Entry: Around 4020–4024 (gray zone). The analysis suggests looking for a Buy from this support area.
Target Point (Take Profit): Around 4040. If the price goes up as expected, this is the profit target.
Trade Stop (Stop Loss): Around 4012. If the price falls below this level, the buy idea is considered invalid and the trade should be closed to limit losses.
Blue Arrow: It shows the expected movement: price may dip slightly into the buy zone, then rise toward the target.
Current price in t
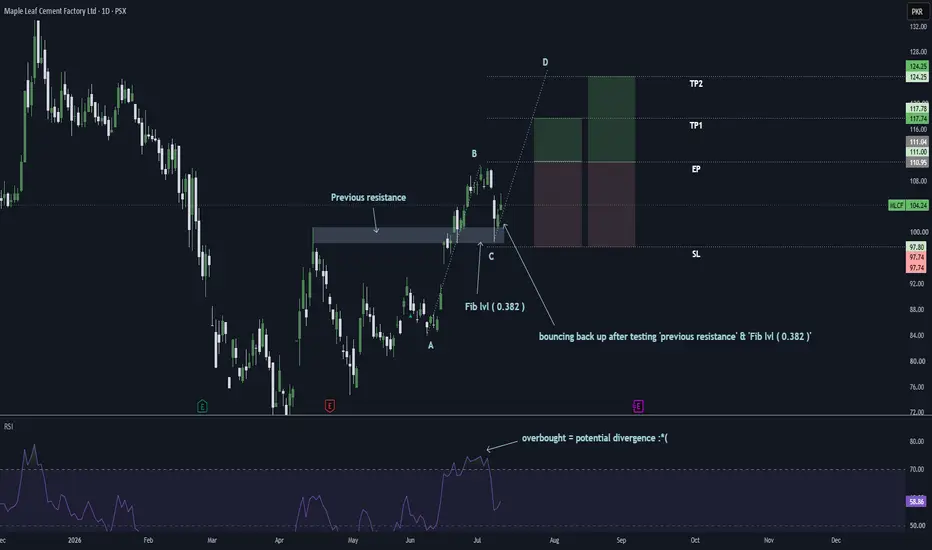
MLCF - PSX1, MLCF is a good stock fundamentally and gives good moves.
2, MLCF formed a good ABCD pattern, it shows that its bouncing back from a previous resistance and bouncing back up from the Fib lvl as well.
3, CAUTIOUS ALERT :- the stock has been overbought and is signaling a potential bearish divergence although stocks dont react that violently on divergences and mostly retrace till fib lvl after divergence forms but that is no excuse to be cautious.
NAS100 Long Setup | AB=CD Pattern + 1H Uptrend ContinuationAfter a healthy correction on the higher time frames, #NAS100 has regained bullish momentum. The overall market structure remains strong, and the 1-hour chart continues to print higher highs and higher lows, confirming the ongoing uptrend.
Technical Analysis
✅ Strong bullish market structure on the 1H timeframe
✅ Healthy higher-timeframe correction completed
✅ AB=CD harmonic pattern is developing

✅ The BC leg appears complete, and price is now transitioning into the CD leg
✅ No significant bea
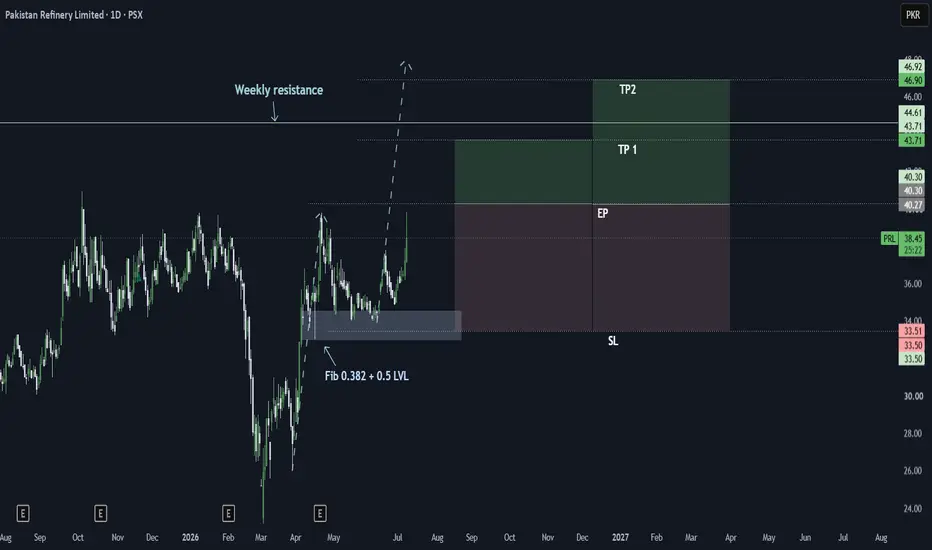
PRL - PSX 1, PRL had been consolidating for a long time now and has finally started to see some volume
2, Due to the small break in between PRL had formed an ' ABCD ' pattern which told us the projections as well
3, 3, The fundamentals for this stock have been listed on my ' PSX SHORT - LISTED STOCKS ' :-https://docs.google.com/spreadsheets/d/1vdCL7yhsfkIOPGLShPtnbkA2QlKXBzs6Fq-Fev-G2A8/edit?usp=sharing
4, TP1 before weekly resistance and TP2 after resistance.
(GOLD)-XAUUSD | (1D) | Trend Analysis | Prof.TraderTilkiGuys, greetings,
Everyone is making comments about gold now, but I want to give you important insights.
Although gold makes intraday upward moves, according to the daily analysis it is still in a downtrend. Don’t forget this. For us to say gold has reversed, it must break above 4430 and 4300. These levels are key, and I emphasize their importance strongly.
If gold rises above these levels, makes a pullback, and takes support again, then my target will be 4700.
But for now, the rules to confi
Inside Bitcoin Magazine’s Retweet — Jack Dorsey Pays with BTCA widely shared post on social media highlighted Block CEO Jack Dorsey’s decision to pay with Bitcoin at a counter. This tweet, amplified by Bitcoin Magazine, has sparked significant discussion online and reflects the ongoing interest in cryptocurrency’s real-world applications. The original tweet can be viewed here.
The Key Development
The tweet from Bitcoin Magazine, which garnered 542 likes and 80 retweets, emphasizes a notable moment in cryptocurrency adoption. Dorsey’s action represents n
CShort