AUDUSD is Nearing a Strong Resistance Area!Hey Traders, in today's trading session we are monitoring AUDUSD for a selling opportunity around 0.69900 zone, AUDUSD is trading in a downtrend and currently is in a correction phase in which it is approaching the trend 0.69900 support and resistance area.
Trade safe, Joe.
Bearish Patterns
GBPAUD: Ongoing Complex Correction Within Larger Bearish TrendGBPAUD broke below the base channel support at the start of 2026 signaled a meaningful structural shift. This breakdown suggests that a bearish impulsive phase may now be in play, increasing the probability of further downside continuation within a projected five-wave bearish impulse. As long as price remains below key resistance, the broader bias remains bearish, with expectations of additional weakness within wave 5 after the current wave 4 correction.
From a shorter-term perspective, GBPAUD appears to be developing a higher degree wave 4 corrective structure within the current bearish cycle. Price action is likely forming a three-wave corrective pullback within subwave (b), with potential for a retracement toward the 1.9055 support area. This zone may act as a temporary reaction level before the market attempts another upward leg.
Following this pullback, an additional and final push higher is still possible in subwave (c) of wave y, completing a larger wxy corrective structure within higher degree wave 4. This final leg could target the 1.9400 resistance level, where stronger selling pressure is expected to re-emerge.
Overall, the market remains in a corrective-to-bearish transition phase, with short-term upside retracements seen as corrective within a broader weakening structure.
AUD/NZD BEARS ARE STRONG HERE|SHORT
Hello, Friends!
We are now examining the AUD/NZD pair and we can see that the pair is going up locally while also being in a uptrend on the 1W TF. But there is also a powerful signal from the BB upper band being nearby, indicating that the pair is overbought so we can go short from the resistance line above and a target at 1.221 level.
Disclosure: I am part of Trade Nation's Influencer program and receive a monthly fee for using their TradingView charts in my analysis.
✅LIKE AND COMMENT MY IDEAS✅
AUD/CHF BEARISH BIAS RIGHT NOW| SHORT
AUD/CHF SIGNAL
Trade Direction: short
Entry Level: 0.557
Target Level: 0.556
Stop Loss: 0.558
RISK PROFILE
Risk level: medium
Suggested risk: 1%
Timeframe: 1h
Disclosure: I am part of Trade Nation's Influencer program and receive a monthly fee for using their TradingView charts in my analysis.
✅LIKE AND COMMENT MY IDEAS✅
GBP/CAD BEST PLACE TO SELL FROM|SHORT
Hello, Friends!
GBP-CAD uptrend evident from the last 1W green candle makes short trades more risky, but the current set-up targeting 1.874 area still presents a good opportunity for us to sell the pair because the resistance line is nearby and the BB upper band is close which indicates the overbought state of the GBP/CAD pair.
Disclosure: I am part of Trade Nation's Influencer program and receive a monthly fee for using their TradingView charts in my analysis.
✅LIKE AND COMMENT MY IDEAS✅
EUR/AUD SENDS CLEAR BEARISH SIGNALS|SHORT
Hello, Friends!
EUR/AUD pair is trading in a local uptrend which we know by looking at the previous 1W candle which is green. On the 4H timeframe the pair is going up too. The pair is overbought because the price is close to the upper band of the BB indicator. So we are looking to sell the pair with the upper BB line acting as resistance. The next target is 1.646 area.
Disclosure: I am part of Trade Nation's Influencer program and receive a monthly fee for using their TradingView charts in my analysis.
✅LIKE AND COMMENT MY IDEAS✅
NZDJPY Bearish as Japan Nears Intervention Zone!Hey Traders,
In today's trading session, we are monitoring NZDJPY for a potential selling opportunity around the 91.800 zone. NZDJPY is trading in a broader downtrend and is currently in a correction phase, with price approaching the 91.800 support and resistance area, a key resistance zone that could provide an attractive opportunity for bearish continuation.
From a fundamental perspective, the Japanese Yen remains in focus as markets continue to monitor the growing risk of Japanese intervention. With USDJPY trading near historically sensitive levels, speculation is building that Japanese authorities could step in to support the Yen if weakness becomes excessive.
This is particularly important for NZDJPY. Any intervention or stronger rhetoric from the Japanese Ministry of Finance could trigger broad-based Yen strength, putting downside pressure on Yen crosses, including NZDJPY. At the same time, the New Zealand Dollar remains vulnerable to shifts in global risk sentiment, creating additional downside risk if investors move toward safe-haven assets.
With price correcting into the 91.800 resistance zone within a broader bearish structure, the current rally may provide an attractive opportunity for sellers.
As long as price remains below the 91.800 resistance zone, the bearish structure remains intact, and we anticipate continuation toward lower support levels.
Trade safe,
Joe
EUR/USD SELLERS WILL DOMINATE THE MARKET|SHORT
Hello, Friends!
We are targeting the 1.132 level area with our short trade on EUR/USD which is based on the fact that the pair is overbought on the BB band scale and is also approaching a resistance line above thus going us a good entry option.
Disclosure: I am part of Trade Nation's Influencer program and receive a monthly fee for using their TradingView charts in my analysis.
✅LIKE AND COMMENT MY IDEAS✅
BITCOIN: MATRIX ALIGNMENT AT THE STRUCTURAL BOUNDARY📌 BITCOIN UPDATE: THE NEXT PRICE-TIME EXECUTION VECTOR
If you have been tracking our previous coordinate mappings, you may remember that we successfully cleared our second short position precisely within the $58,400–$58,600 target zone as the price-time parameters matured. Since reaching that objective, the market has developed exactly as anticipated, locking itself into a highly compressed, exhausting corrective channel.
Over the last few days, this structural consolidation has allowed the market to build fresh institutional order flow. Now, as visible on the chart, we are currently entering a critical time-axis gateway where key structural variables are beginning to align.
At the moment, a new high-probability short position has been activated based on our proprietary grid.
From my perspective, the current corrective structure is nearing its absolute exhaustion point at the upper boundary of the descending channel. The matrix is now heavily favoring the next aggressive expansion vector, targeting the major structural floor at $55,100.
According to our confidential time-axis calculations, this macro distribution phase is mathematically scheduled to mature toward its final price objective right on the projected coordinate grid. Until this specific time window fully unlocks and clears the counter-liquidity, any intermediate local volatility or micro relief bounces are purely speculative traps.
As I always say, Price tells us where, but Time tells us when. Neither dimension alone can fully explain market behavior. Only when Price and Time confirm one another—together with Logic, Market Behavior, Structure, Complexity, and the synchronization across all timeframes—does the true language of the market begin to reveal itself.
The coordinates for this next major phase are locked. For now, I am simply executing the script and observing how the market responds as it enters this critical area.
✍🏻 Mohsen Nirumand
🔹🔹🔹🔹🔹🔹🔹🔹🔹🔹🔹🔹🔹🔹🔹🔹🔹🔹🔹🔹🔹🔹🔹🔹🔹🔹🔹🔹🔹🔹🔹🔹
✉️ If your trading requires a flawless, multi-timeframe blueprint where fragmented chart intervals align into a single, cohesive market roadmap—feel free to connect.
I engineer high-probability trading models, pinpoint structural keys, and rule-based algorithmic scenarios synchronized to your specific trading targets.
Direct messages are always welcome for serious inquiries.
🔹🔹🔹🔹🔹🔹🔹🔹🔹🔹🔹🔹🔹🔹🔹🔹🔹🔹🔹🔹🔹🔹🔹🔹🔹🔹🔹🔹🔹🔹🔹🔹
⚠️ Risk Management isn't just a tool; it's the absolute foundation of your survival and long-term wealth in this game.
📌 Honor your Invalidation: Always secure your position with a proper stop-loss.
📌 Protect your Liquidity: Never expose more than a minimal percentage per trade.
📌 Avoid the Retail Trap: Eradicate over-leveraging to secure your account's longevity.
📌 Trade the Script, Not the Noise: Stick strictly to your plan, detached from emotions.
📌 Master the Art of Patience: Let the market flow into your zones; never chase the price.
📌 Focus on the Horizon: Compounded consistency outlives quick, emotional profits.
If this structural mapping delivered real value to your desk, back it up below 👇
boost 🚀 | share 🔄 | comment 💬 | follow ✅️
Inflation Battle Has AU Ready To Flip On It's "Head"Price on OANDA:AUDUSD may be creating a textbook reversal called a Head and Shoulders pattern on the Weekly chart and the Battle of Future Rates & Inflation my be the fundamental catalyst for such a Bearish Reversal to finish forming, leading to price breaking through the floor, lets break it down!!
We can see that OANDA:AUDUSD has been trading sideways since the beginning of 2026 but the most recent decline in price comes from a Higher High with price now just above a Support level @ .6866 - .68334, found between the two peaks.
If price is once again supported in this area, this would begin the final "Shoulder" of the Reversal Pattern and a couple things we will want to watch during its formation as price moves up:
- Should generate the least amount of Volume of the 3 Peaks in price
- Lower High of the Bearish Divergence in the RSI
- Continued decline in MACD
Once price is rejected from the Resistance level where the "Left Shoulder" is, this will confirm the beginning of the drop of the "Right Shoulder" where then we will see price, after forming a Lower High, potentially push back down to the "Neckline" or Support of the Pattern to then possibly fall further!
Fundamentally, a lot of things could be supporting this outlook with:
- Inflation falling for AUD
(4.2% -> 4%)
- Inflation rising for USD
(3.8% -> 4.2%)
With both the RBA and Federal Reserve making the decision to Hold Interest Rates this month, these two different readouts could me totally different paths being taken by the Central Banks.
- With inflation falling, RBA will be looking to Cut Interest Rates, weakening the AUD.
- With inflation rising, Fed will be looking to Rise Interest Rates, strengthening the USD.
Lets see how it plays out and to stay up to date..
For All Things Currency,
Keep It Current,
With Novi_Fibonacci!
GOLD — Corrective Bounce. Here's What I'm WatchingGold hit $3,960 this week — the lowest level in 2026.
The $4,000 FOMC target mapped in June was reached and broken. The move played out exactly as structured.
Now gold is bouncing. This is corrective, not a reversal.
Resistance zone: $4,090 – $4,121
This is where sellers are expected to return.
A rejection here continues the path toward $3,950 and below.
Invalidation: daily close above $4,200.
The trend is bearish. Until structure changes, bounces are selling opportunities — not reversals.
I'm Watching This Level — updated in real time — ChrisMarkets OS
GOLD Breakout and Potential Retrace!Hey Traders, in tomorrow's trading session we are monitoring XAUUSD for a selling opportunity around 4,120 zone, GOLD was trading in an uptrend and successfully managed to break it out. Currently is in a correction phase in which it is approaching the trend at 4,120 support and resistance area.
Trade safe, Joe.
USOIL SHORT FROM RESISTANCE
USOIL SIGNAL
Trade Direction: short
Entry Level: 73.51
Target Level: 72.53
Stop Loss: 74.15
RISK PROFILE
Risk level: medium
Suggested risk: 1%
Timeframe: 1h
Disclosure: I am part of Trade Nation's Influencer program and receive a monthly fee for using their TradingView charts in my analysis.
✅LIKE AND COMMENT MY IDEAS✅
CHF/JPY SENDS CLEAR BEARISH SIGNALS|SHORT
Hello, Friends!
Previous week’s green candle means that for us the CHF/JPY pair is in the uptrend. And the current movement leg was also up but the resistance line will be hit soon and upper BB band proximity will signal an overbought condition so we will go for a counter-trend short trade with the target being at 199.448.
Disclosure: I am part of Trade Nation's Influencer program and receive a monthly fee for using their TradingView charts in my analysis.
✅LIKE AND COMMENT MY IDEAS✅
AUDUSD Bearish After Hawkish Fed Remarks!Hey Traders,
In the coming week, we are monitoring AUDUSD for a potential selling opportunity around the 0.69200 zone. AUDUSD is trading in a broader downtrend and is currently in a correction phase, with price approaching the 0.69200 support and resistance area, a key resistance zone that could provide an attractive opportunity for bearish continuation.
From a fundamental perspective, the U.S. Dollar continues to find support after Fed Governor Kevin Warsh's hawkish remarks, which reinforced the view that the Federal Reserve may need to maintain a restrictive policy stance if inflation remains persistent. His comments have strengthened the higher-for-longer narrative, supporting Treasury yields and the U.S. Dollar.
This creates a challenging environment for AUDUSD. The Australian Dollar, being a risk-sensitive currency, tends to underperform when the U.S. Dollar strengthens and markets price in tighter U.S. monetary policy. As long as the Fed maintains a hawkish tone, the balance of risks continues to favor further USD strength.
With price correcting into the 0.69200 resistance zone within a broader bearish structure, the current rally may present an attractive opportunity for sellers.
As long as price remains below the 0.69200 resistance zone, the bearish structure remains intact, and we anticipate continuation toward lower support levels.
Trade safe,
Joe
Hawkish Fed Could Send Gold Even Lower!Hey Traders,
In today's trading session, we are monitoring XAUUSD for a potential selling opportunity around the 4,090 zone. Gold is trading in a broader downtrend and is currently in a correction phase, with price approaching the 4,090 support and resistance area, a key resistance zone that could provide an attractive opportunity for bearish continuation.
From a fundamental perspective, the market continues to digest the Federal Reserve's hawkish stance. Recent comments from Fed officials have reinforced the view that interest rates may need to remain higher for longer, and markets have scaled back expectations for near-term policy easing.
This remains a headwind for gold.
Higher interest rates and elevated Treasury yields increase the appeal of yield-bearing assets while supporting the U.S. Dollar, making it more difficult for non-yielding assets like gold to sustain rallies. As long as the Fed maintains a hawkish tone and inflation remains a concern, the fundamental backdrop continues to favor downside pressure on gold.
Trade safe,
Joe
USDMXN Reverses Lower After Completing 3-3-5 Flat CorrectionUSDMXN has reached the projected resistance target for wave C of a regular ABC flat correction and is now turning sharply lower with an impulsive decline. This strong reversal suggests that sellers have regained control, shifting the short-term outlook back to the downside. While the broader bearish move appears to be underway, traders should still be aware of short-term corrective pullbacks that may interrupt the decline.
From an Elliott Wave perspective, a regular flat correction follows a 3-3-5 structure. Wave A unfolds as a three-wave correction, wave B also forms a three-wave move and typically retraces close to or slightly beyond the start of wave A, while wave C develops as a five-wave impulse that often terminates near key Fibonacci resistance levels. Once wave C is complete and an impulsive reversal appears, it frequently signals that the dominant trend is ready to resume.
With wave C now likely complete and bearish momentum accelerating, the technical outlook favors additional downside in the sessions ahead.
Highlights:
USDMXN reached the projected resistance for wave C of a regular 3-3-5 flat correction.
A sharp impulsive reversal suggests bears have regained control.
Regular flat corrections consist of a 3-3-5 Elliott Wave structure (A-B-C).
Wave C often completes at Fibonacci resistance before the dominant trend resumes.
Watch for further downside, while allowing for short-term corrective pullbacks along the way.
USD/CAD SENDS CLEAR BEARISH SIGNALS|SHORT
USD/CAD SIGNAL
Trade Direction: short
Entry Level: 1.423
Target Level: 1.421
Stop Loss: 1.425
RISK PROFILE
Risk level: medium
Suggested risk: 1%
Timeframe: 1h
Disclosure: I am part of Trade Nation's Influencer program and receive a monthly fee for using their TradingView charts in my analysis.
✅LIKE AND COMMENT MY IDEAS✅
CAD/JPY BEARS ARE GAINING STRENGTH|SHORT
Hello, Friends!
CAD/JPY is trending down which is clear from the red colour of the previous weekly candle. However, the price has locally surged into the overbought territory. Which can be told from its proximity to the BB upper band. Which presents a beautiful trend following opportunity for a short trade from the resistance line above towards the demand level of 113.429.
Disclosure: I am part of Trade Nation's Influencer program and receive a monthly fee for using their TradingView charts in my analysis.
✅LIKE AND COMMENT MY IDEAS✅
SOL - Is History Repeating Itself?SOL has been following a price cycle that looks remarkably similar to its previous major market cycle. While history never repeats perfectly, it often rhymes, making historical comparisons a valuable tool for understanding where we may be in the current market structure. 📊
In the previous cycle, SOL completed an 8-leg corrective sequence before finally reaching its ultimate bottom. That final Leg 8 produced one last lower low inside the accumulation zone before buyers stepped in and started the next major bullish trend.
📌 If this cycle continues to follow a similar path, SOL now appears to be approaching Leg 8 once again. This suggests that one final lower low could still be ahead before a long-term bottom is established.
That does not mean the market must follow the exact same path. Instead, it gives us a roadmap of what to watch for over the coming weeks.
For now, I remain focused on monitoring price action around the accumulation zone. If history continues to rhyme, this area could eventually offer one of the best long-term opportunities of the cycle.
Will SOL complete one final leg before the next bull run begins? 🤔
⚠️ Disclaimer: This is not financial advice. Always do your own research and manage risk properly.
📚 Stick to your trading plan regarding entries, risk, and management.
Good luck! 🍀
All Strategies Are Good; If Managed Properly!
~Richard Nasr
EUR/CHF BEST PLACE TO SELL FROM|SHORT
EUR/CHF SIGNAL
Trade Direction: short
Entry Level: 0.921
Target Level: 0.920
Stop Loss: 0.922
RISK PROFILE
Risk level: medium
Suggested risk: 1%
Timeframe: 1h
Disclosure: I am part of Trade Nation's Influencer program and receive a monthly fee for using their TradingView charts in my analysis.
✅LIKE AND COMMENT MY IDEAS✅
EURAUD Breakout and Potential Retrace!Hey Traders, in today's trading session we are monitoring EURAUD for a selling opportunity around 1.64600 zone, EURAUD was trading in an uptrend and successfully managed to break it out. Currently is in a correction phase in which it is approaching the retrace area at 1.64600 support and resistance area.
Trade safe, Joe.
EUR/AUD BEARS ARE STRONG HERE|SHORT
Hello, Friends!
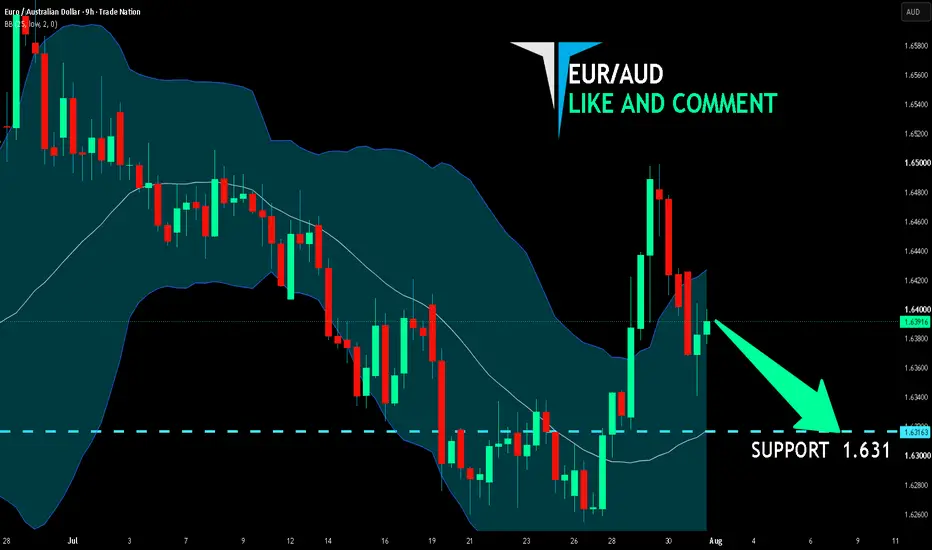
EUR/AUD pair is trading in a local uptrend which we know by looking at the previous 1W candle which is green. On the 4H timeframe the pair is going up too. The pair is overbought because the price is close to the upper band of the BB indicator. So we are looking to sell the pair with the upper BB line acting as resistance. The next target is 1.639 area.
Disclosure: I am part of Trade Nation's Influencer program and receive a monthly fee for using their TradingView charts in my analysis.
✅LIKE AND COMMENT MY IDEAS✅