AUDUSD is Nearing a Strong Resistance!Hey Traders, in today's trading session we are monitoring AUDUSD for a selling opportunity around 0.70000, AUDUSD is trading in a downtrend and currently is in a correction phase in which it is approaching the trend at 0.70000 support and resistance area.
Trade safe, Joe.
Bearish Patterns
GBPAUD: Wave Four Triangle Could Lead to Another DeclineGBPAUD is still on track since the last update shared back on June 30.
GBPAUD broke below the base channel support at the start of 2026 signaled a meaningful structural shift. This breakdown suggests that a bearish impulsive phase may now be in play, increasing the probability of further downside continuation within a projected five-wave bearish impulse. As long as price remains below key resistance, the broader bias remains bearish, with expectations of additional weakness within wave 5 after
XAUUSD | Gold Analysis & Resistance Level & Price Action 1.MARKET STRUCTURE
Gold is trading around **$4,155**, recovering after Monday’s sharp **4% selloff** that pushed price to approximately **$4,111**, the lowest level since August 5. The current move is a relief bounce within a broader bearish structure. The break below **$4,250–$4,260** confirmed bearish continuation, while the downside BOS through **$4,200** keeps sellers in control. No bullish CHOCH has been confirmed yet. The **$4,111** low represents the recent sell-side liquidity sweep, whil
EURUSD is Nearing a Strong Resistance Area!Hey Traders, in today's trading session we are monitoring EURUSD for a selling opportunity around 1.13700 zone, EURUSD is trading in a downtrend and currently is in a correction phase in which it is approaching the trend at 1.13700 support and resistance area.
Trade safe, Joe.
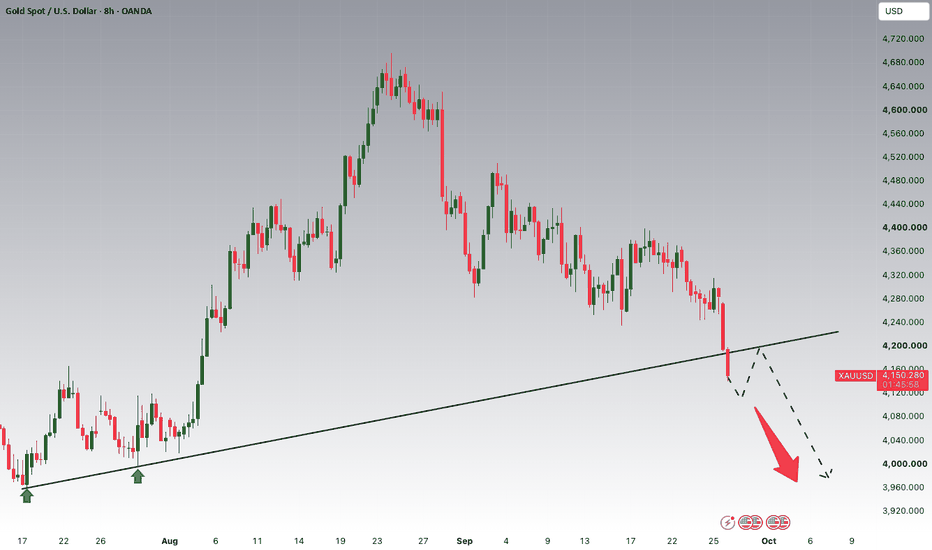
Gold Breakout and Potential Retrace!Hey Traders, in today's trading session we are monitoring XAUUSD for a selling opportunity around 4,200 zone, Gold was trading in uptrend and successfully managed to break it out. Currently is in a correction phase in which it is approaching the retrace area at 4,200 support and resistance area.
Trade safe, Joe.
EURAUD – Perfect Intersection for Sellers?EURAUD has been overall bearish, trading within the falling channel marked in red.
Price is currently correcting higher and approaching a strong intersection of:
🔴 Upper bound of the falling channel
🔵 Key resistance zone
As long as this intersection holds, the bearish structure remains intact, and we will be looking for trend-following short setups on lower timeframes.
A clear break above this intersection would invalidate the bearish scenario and force us to reassess.
📌 The trend is bearish
CHFJPY – Bearish Trend, Key Intersection AheadCHFJPY has been overall bearish, with price continuing to respect the descending blue trendline.
After the latest bearish impulse, the pair is now recovering and approaching an important technical area.
📌 The key area to watch is the intersection between the supply zone around 199.50–201.00 and the descending trendline.
This confluence creates a strong area where sellers could step back in and resume the broader bearish move.
As long as this intersection holds as resistance, we will be looki
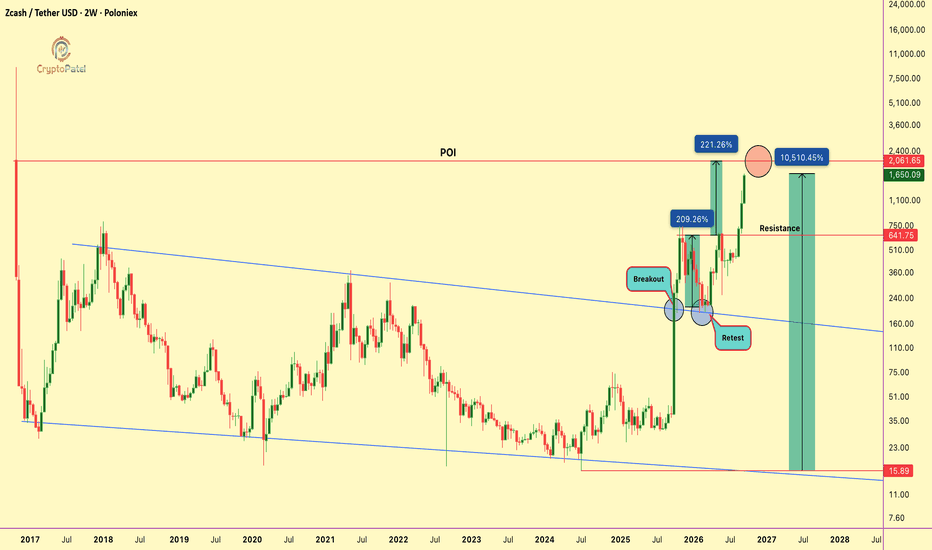
$ZEC | THE ZEC TOP MAY BE CLOSER THAN MOST EXPECTCRYPTOCAP:ZEC | THE ZEC TOP MAY BE CLOSER THAN MOST EXPECT | MY FULL MARKET VIEW
Family, I want to share my personal technical view on #ZEC because the chart is becoming extremely interesting but so is the risk.
ZEC has already delivered an extraordinary ~10,510% move over the last 27 months. Those who accumulated during 2024–2025 have witnessed an exceptional repricing.
But at the current $1,650–$2,100 region, I would personally become extremely cautious.
The key question is no longer simp
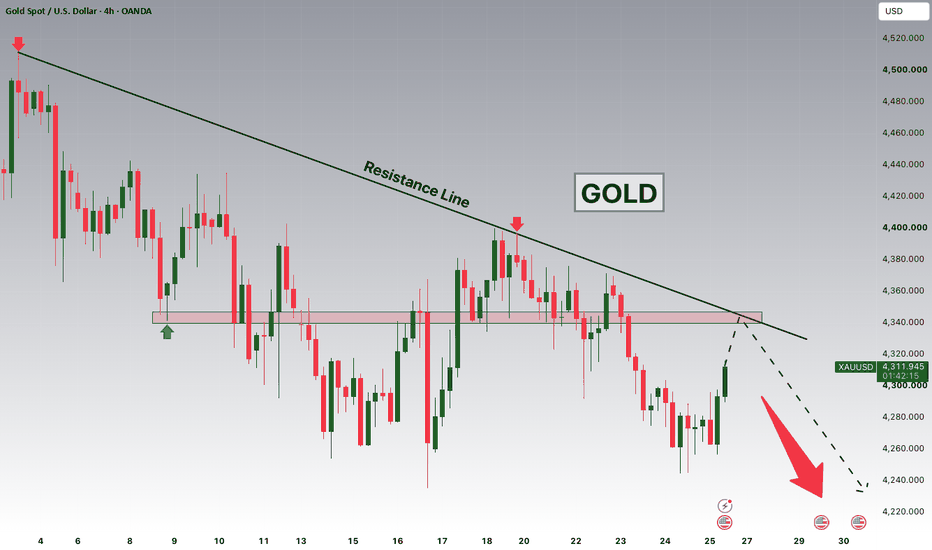
Gold is Nearing a Strong Resistance Area!Hey Traders, in today's trading session we are monitoring XAUUSD for a selling opportunity around 4,340 zone, Gold is Trading in a Downtrend and currently is in a correction phase in which it is approaching the trend at 4,340 support and resistance area.
Trade safe, Joe.
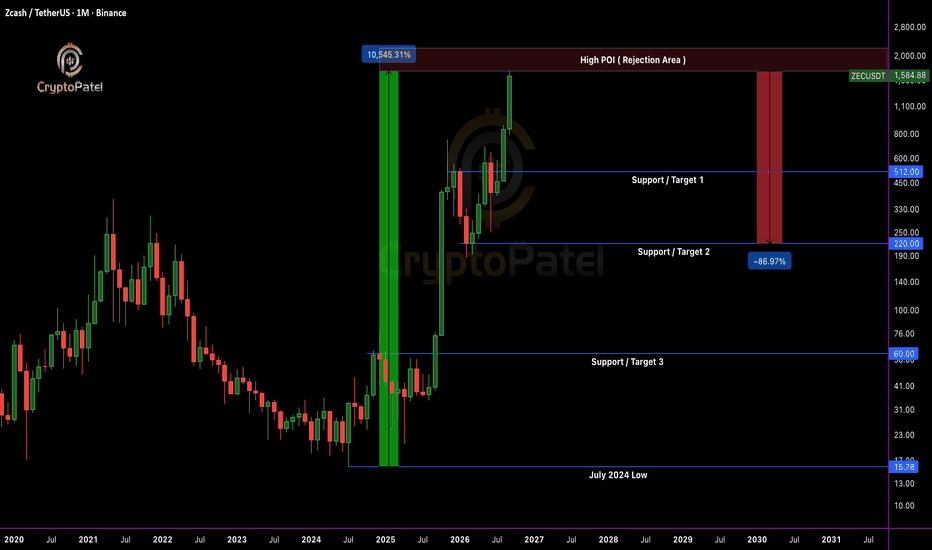
Will $ZEC down 90% From Current POI Level?What If You Go On Vacation… And Come Back To This? 😳
Imagine You’re On Vacation For A Month. You Come Back, Open Your Portfolio, And See Your CRYPTOCAP:ZEC Bag Was Bought Around $1,670–$2,200, The High POI / Rejection Area.
Now Look At The Chart 👇
Support 1: $512
Support 2: $220
Support 3: $60
A Move From $1,670 → $220 Would Mean Roughly -87%. From $2,200 → $220, It’s About -90%.
My Honest View: I’m Not Saying ZEC WILL Dump There. These Are Structural Downside Levels I’m Watching If The Cu
$ROBIN: 99% CRASH | WHAT’S NEXT?$ROBIN: 99% CRASH | WHAT’S NEXT?
#ROBIN has been brutally rejected after its Listing Day high, dumping 99.31% within just 10 days. From the Bearish Triangle breakdown, price has already collapsed another 76%+.
Now, I’m not suggesting any long entry yet.
Bullish Confirmation: $0.0078 is the key level. If price breaks above it and successfully holds, the structure could shift bullish, opening the possibility of a 200%–500% upside move.
Bearish Invalidation: If $ROBIN loses $0.0029, another 30%–
RShort
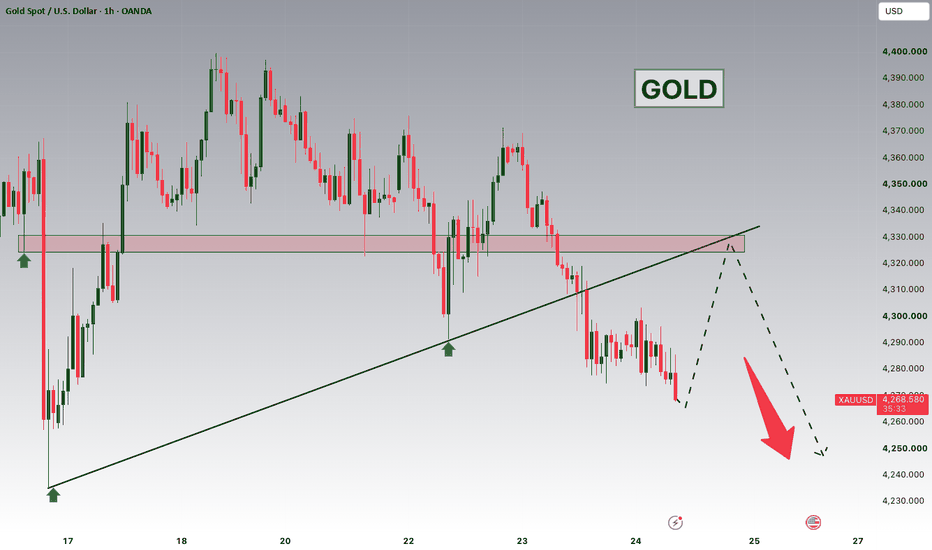
GOLD Breakout and Potential Retrace!Hey Traders, in today's trading session we are monitoring XAUUSD for a selling opportunity around 4,325 zone, Gold was trading in an uptrend and successfully managed to break it out. Currently is in a correction phase in which it is approaching the retrace area at 4,325 support and resistance area.
Trade safe, Joe.
EURUSD is Nearing a Strong Resistance Area!Hey Traders, in today's trading session we are monitoring EURUSD for a selling opportunity around 1.14400 zone, EURUSD is trading i na downtrend and currently is in a correction phase in which it is approaching the trend at 1.14400 support and resistance area.
Trade safe, Joe.
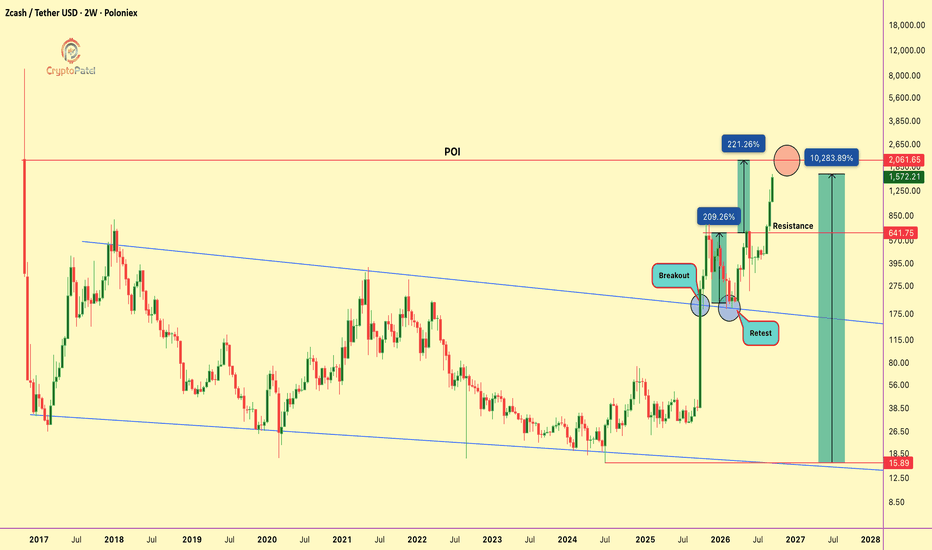
$ZEC | Sharing My Personal View With You All | Must ReadCRYPTOCAP:ZEC | Sharing My Personal View With You All | Must Read
Family, I want to share my honest view on CRYPTOCAP:ZEC because this is one of those charts where the upside story looks exciting, but the risk at current levels should not be ignored.
CRYPTOCAP:ZEC has already delivered an extraordinary move, around 10,283% over the last 27 months. Anyone who accumulated during 2024–2025 has already witnessed a massive return.
But at $1,600–$2,000, I personally would be extremely cautious
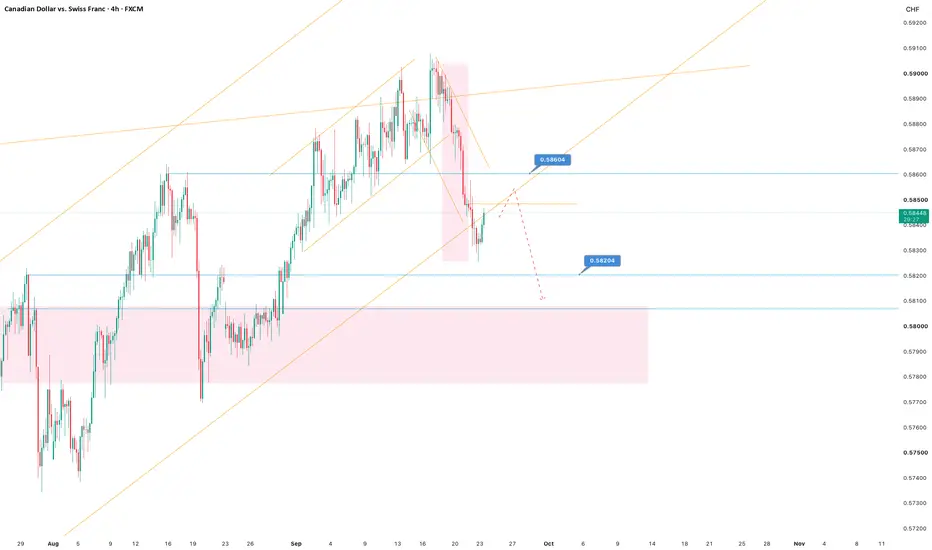
CADCHF📊 CAD/CHF 4H Technical Outlook:
Breakout & Retest ScenarioMarket Structure: Following a sharp bearish correction from the upper boundaries of an ascending channel, price action aggressively broke out of the local descending counter-trendline.
Immediate Price Behavior (The Retest): The market is currently experiencing a bullish structure shift via a relief bounce. A minor upside continuation is expected to retest the broken diagonal support-turned-resistance or the structural horizontal piv
GBPCHF Is Caught In A RangePrice on OANDA:GBPCHF has been trading between a Rising Resistance and a Falling Support.
This price action has led to a Consolidation formation called an Expanding Range!
Expanding Ranges can be either Bullish or Bearish based on how neither party truly wins out until we get a breakout of either the Rising Resistance - signaling Bullish opportunities OR a breakout of the Falling Support - signaling Bearish opportunities!
Best thing to do now, is wait for a Breakout and Retest scenario.
ETHEREUM: HTF STRUCTURE JUST SHIFTED | WHAT COMES NEXT?ETHEREUM: HTF STRUCTURE JUST SHIFTED | WHAT COMES NEXT?
CRYPTOCAP:ETH Is Now Showing A Clear HTF Bullish CHoCH On The HTF Chart, Followed By Strong Displacement From The ~$2,300 Demand Region.
Price Has Reclaimed The $2,483–$2,584 Fair Value Gap, Making This The Most Important Near-Term Reaction Zone.
SMC + ICT MARKET MAP:
🔹 $2,483–$2,584: Reclaimed FVG + Key Support
🔹 $2,715–$2,900: Upside FVG / Next Liquidity Draw
🔹 $3,070–$3,404: Major Bearish OB + FVG
🔹 $2,300: Critical Structural Trend
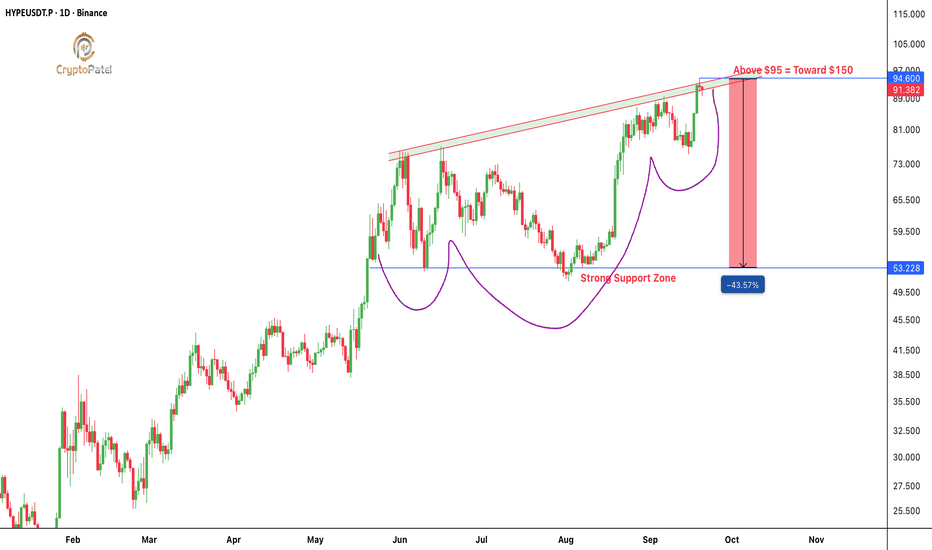
$HYPE: The Inverse Head & Shoulders At The TOP Is What Concerns XETR:HYPE : The Inverse Head & Shoulders At The TOP Is What Concerns Me.
#HYPE Is Forming An Inverse Head & Shoulders Structure But There’s A Major Difference Here:
Inverse H&S Patterns Usually Form Near Market Bottoms And Signal Reversal. But When A Similar Structure develops near a major TOP, the breakout can become a liquidity trap rather than a continuation signal.
Key Level: $95 Neckline Resistance
▶️ Above $95 With A Strong Daily Close → Structure Can Open The Path Toward $150.
▶️ Rejec
USD/JPY H1: Bearish Confirmation Below 156.049USD/JPY has experienced a sharp rejection after testing the 157.947 resistance area, suggesting that the recent upward move may be losing momentum. The pair is now approaching an important H1 confirmation zone between 156.241 and 156.049.
The fundamental backdrop is becoming more supportive for the Japanese yen. Expectations surrounding the Bank of Japan’s policy direction, together with upcoming central-bank communication, may increase volatility and strengthen demand for the yen. However, tec
USDJPY – Strong Intersection AheadUSDJPY remains overall bearish, trading within the falling red channel.
Price is now approaching a strong technical intersection formed by the upper bound of the falling channel and the blue supply zone around the 158.50–159.00 area.
As long as this intersection holds, we will be looking for trend-following sell setups, with the broader bearish structure remaining intact.
A clear break above both the supply zone and the upper trendline would invalidate this bearish scenario.
📌 The trend is b
GBP/USD H1: Bearish Continuation if 1.33397 BreaksGBP/USD remains under clear bearish pressure on the H1 timeframe following the latest Bank of England decision.
The Bank Rate was maintained at 3.75%. Despite the relatively hawkish vote split, the pound experienced a sharp sell-off against the US dollar.
Technical structure:
• The H1 chart continues to form lower highs and lower lows.
• Price remains below the key resistance levels.
• Near-term resistance is located at 1.33709.
• The main bearish invalidation level is 1.34047.
• Higher H1 re
EUR/USD H1: Bearish Confirmation Below 1.14817This publication is a follow-up and post-analysis of my previous EUR/USD H1 idea.
The original scenario anticipated a possible bearish rejection from the 1.15060–1.15250 resistance zone. Price did not reach that zone, so the original setup was not triggered.
Instead, a lower local H1 resistance area formed around 1.14930–1.14980. Price rejected this area and an H1 candle subsequently closed below 1.14817, confirming the alternative bearish continuation scenario.
Key levels:
• Local H1 resist