XRP Looks Bullish — But I’m Taking the Short SideWHY I AM BEARISH
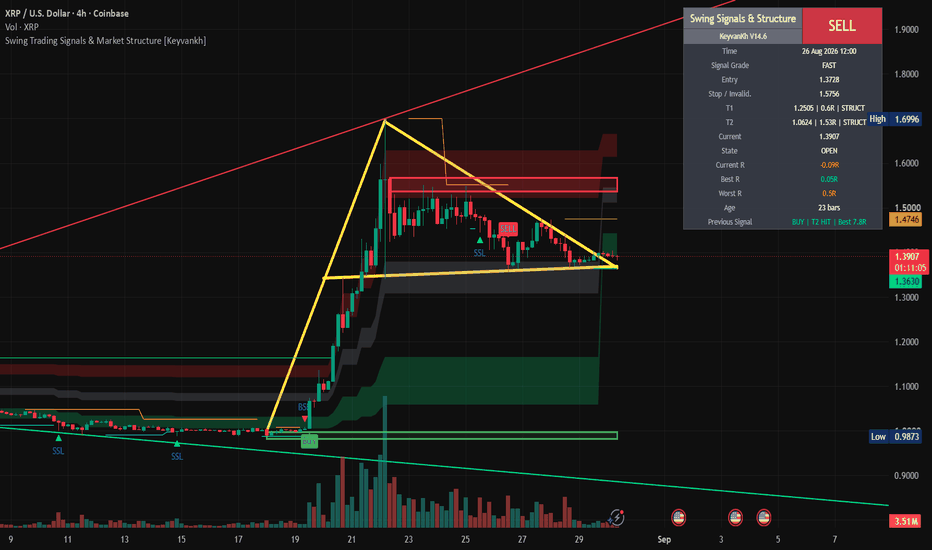
Although the current formation has been identified as a Bullish Pennant, I am not trading the pattern label alone.
Since the $1.70 high, XRP has continued to produce lower highs while repeatedly returning to the important $1.36 support area.
For me, this shows increasing pressure on support rather than strong bullish continuation.
The rebounds from $1.36 are becoming weaker, price remains below descending resistance, and my Swing Signals & Market Structure indicator has an active SELL signal.
WHY I AM IGNORING THE BULLISH PENNANT FOR NOW
A bullish pennant is only a potential continuation pattern until price actually breaks upward.
The pattern itself is not confirmation.
I would need to see XRP break the descending resistance and reclaim approximately $1.47–$1.48 before I would trust the bullish interpretation.
Until that happens, I believe the lower-high structure and repeated testing of $1.36 carry more weight.
MY SETUP
Bias: SHORT
Key breakdown level: $1.36
A confirmed 4H break below $1.36 would strengthen my bearish view considerably.
First major target:
$1.25–$1.26
Extended target:
$1.06
Stop Loss:
Approximately $1.49–$1.50
A strong 4H close above $1.47–$1.48 would tell me that the short setup is probably wrong.
The wider structural invalidation from my indicator is $1.5756.
My expectation is that XRP breaks the $1.36 support before it successfully breaks the bullish pennant to the upside.
Of course, this is only my interpretation of the current structure. Please let me know what you think — do you see a bearish breakdown coming, or do you believe the bullish pennant will eventually win?
I appreciate any feedback or alternative views.
Not financial advice.
Bearish Patterns
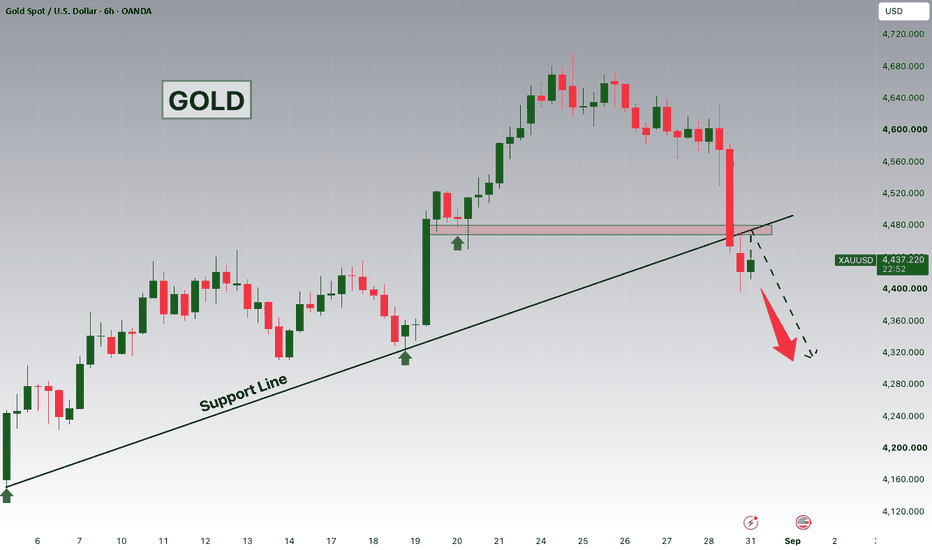
GOLD BEARISH BIAS RIGHT NOW| SHORT
GOLD SIGNAL
Trade Direction: short
Entry Level: 4,444.58
Target Level: 4,390.18
Stop Loss: 4,480.75
RISK PROFILE
Risk level: medium
Suggested risk: 1%
Timeframe: 1h
Disclosure: I am part of Trade Nation's Influencer program and receive a monthly fee for using their TradingView charts in my analysis.
✅LIKE AND COMMENT MY IDEAS✅
GBPUSD is Nearing a Strong Resistance Line!Hey Traders, in today's trading session we are monitoring GBPUSD for a selling opportunity around 1.35200 zone, GBPUSD is trading in a downtrend and currently is in a correction phase in which it is approaching the trend at 1.35200 support and resistance area.
Trade safe, Joe.
GBPJPY Breakout and Potential Retrace!Hey Traders, in today's trading session we are monitoring GBPJPY for a selling opportunity around 216.100 zone, GBPJPY was trading in an uptrend and successfully managed to break it out. Currently is in a correction phase in which it is approaching the retrace area at 216.100 support and resistance area.
Trade safe, Joe.
EUR/CAD SHORT FROM RESISTANCE
Hello, Friends!
Previous week’s green candle means that for us the EUR/CAD pair is in the uptrend. And the current movement leg was also up but the resistance line will be hit soon and upper BB band proximity will signal an overbought condition so we will go for a counter-trend short trade with the target being at 1.606.
Disclosure: I am part of Trade Nation's Influencer program and receive a monthly fee for using their TradingView charts in my analysis.
✅LIKE AND COMMENT MY IDEAS✅
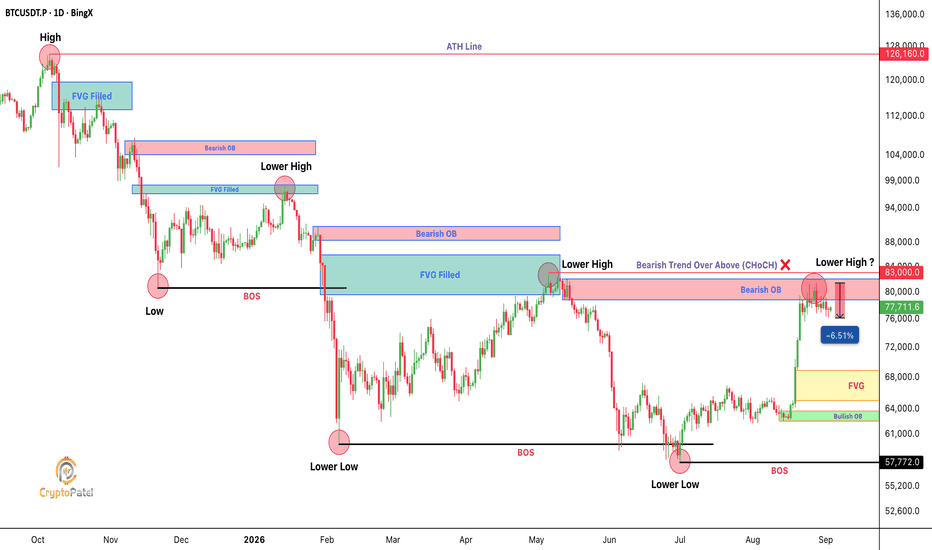
$BTC REJECTED OUR $80K–$83K BEARISH ORDER BLOCKCRYPTOCAP:BTC REJECTED OUR $80K–$83K BEARISH ORDER BLOCK
On Aug 25, I marked $80K–$83K as the key ICT/SMC Bearish Order Block.
Now look what happened:
CRYPTOCAP:BTC rejected from ~$81.5K
Dumped to ~$76.2K
~6.5% drop in just a few days
The setup is playing out exactly as expected.
Now the BIG question: What’s next?
If CRYPTOCAP:BTC fails to reclaim $83K with a HTF candle close: $70K/$65K/$60K
And if bearish structure continues, I’m watching for a deeper move toward the $50K–$40K zone.
INVALIDATION: Any HTF close above $83K would invalidate this bearish setup and force a structural reassessment.
Did you catch this setup?
Enjoy the CryptoPatel charts & share this with a friend.
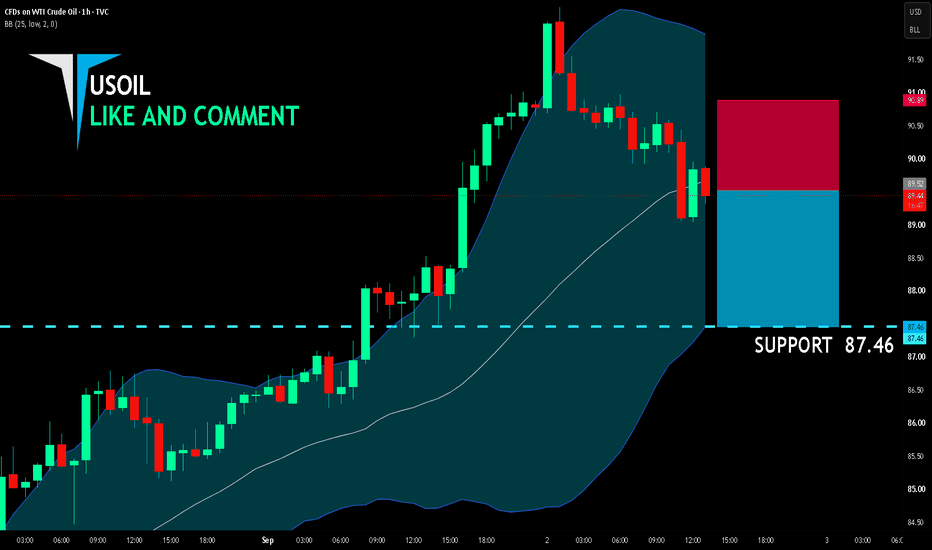
USOIL BEARS WILL DOMINATE THE MARKET|SHORT
USOIL SIGNAL
Trade Direction: short
Entry Level: 89.52
Target Level: 87.46
Stop Loss: 90.89
RISK PROFILE
Risk level: medium
Suggested risk: 1%
Timeframe: 1h
Disclosure: I am part of Trade Nation's Influencer program and receive a monthly fee for using their TradingView charts in my analysis.
✅LIKE AND COMMENT MY IDEAS✅
CAD/JPY BEARS ARE STRONG HERE|SHORT
CAD/JPY SIGNAL
Trade Direction: short
Entry Level: 115.385
Target Level: 115.160
Stop Loss: 115.533
RISK PROFILE
Risk level: medium
Suggested risk: 1%
Timeframe: 1h
Disclosure: I am part of Trade Nation's Influencer program and receive a monthly fee for using their TradingView charts in my analysis.
✅LIKE AND COMMENT MY IDEAS✅
NZDJPY – Range Resistance Back in FocusNZDJPY has been trading within a large range, repeatedly rotating between the support and resistance zones highlighted on the chart.
The pair is now retesting the upper bound of the range once again, an area that has rejected price several times in the past.
As long as this resistance continues to hold, we will be looking for new sell setups, anticipating another rotation toward the lower side of the range.
📌 The idea remains simple: sell near range resistance, buy near range support — until the range breaks.
⚠️ Disclaimer: This analysis is for educational purposes only and does not constitute financial advice. Always manage your risk and wait for proper confirmation before entering a trade.
📚 Stick to your trading plan regarding entries, risk, and management.
Good luck! 🍀
All Strategies Are Good; If Managed Properly!
~Richard Nasr
AUDUSD Breakout and Potential Retrace!Hey Traders, in today's trading session we are monitoring AUDUSD for a selling opportunity around 0.71700 zone, AUDUSD was trading in an uptrend and currently is attempting to break it out. if we get further dips below support we will be looking for a potential retrace of the trend towards further lows.
Trade safe, Joe.
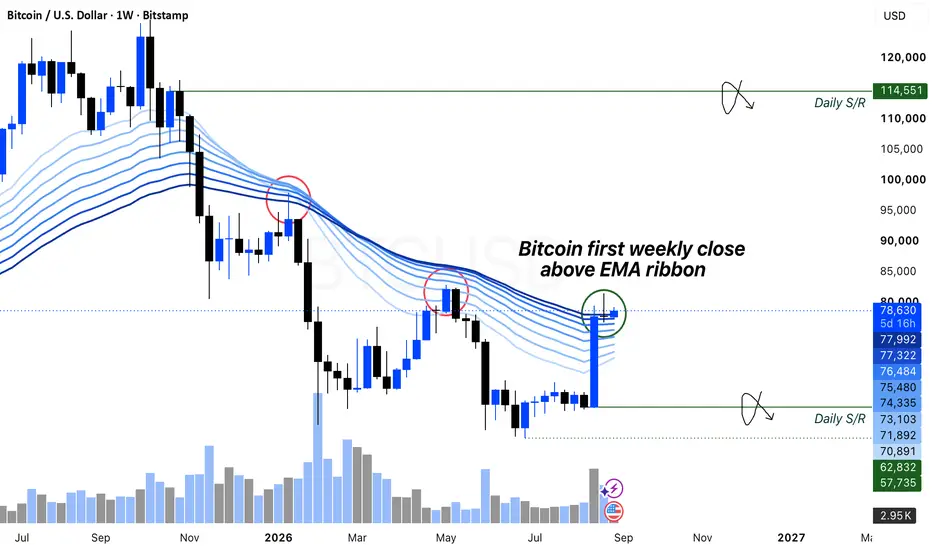
Bitcoin Weekly EMA Ribbon Reclaim ? Bitcoin (BTC/USDT) is showing notable technical developments on the weekly timeframe as price interacts with the EMA ribbon. Since the bear market was established, the EMA ribbon has generally acted as a region of resistance, with previous retests followed by renewed bearish price expansion.
The current structure appears different, with Bitcoin recently recording a weekly close above the EMA ribbon. From a technical perspective, this may indicate the possibility of a developing market structure shift. However, further price action will be needed to determine whether the move can be sustained.
If Bitcoin continues to hold above the EMA ribbon on a weekly closing basis, it may support the potential for further bullish continuation towards higher resistance levels. Maintaining acceptance above this technical region would also provide additional support for the developing bullish market structure.
Conversely, if price fails to remain above the weekly EMA ribbon and closes back below it, the possibility of a false breakout may increase. This could weaken the current bullish interpretation and potentially lead to renewed downside pressure towards lower price levels.
Overall, the weekly EMA ribbon remains an important technical region to monitor. Bitcoin's ability to hold above or fall back below this area may provide further insight into its broader market structure and potential near-term direction.
-----------------------------------------------------------------------------------------------
Don't invest unless you're prepared to lose all the money you invest. This is a high-risk investment and you should not expect to be protected if something goes wrong. Take 2 mins to learn more: coinjar.com/uk/risk-summary
The article is an opinion expressed by the author at a point in time and does not represent the views of CoinJar UK Limited or CoinJar Australia Pty Ltd. Take care to consider the date of this article and be aware that this opinion is based on circumstances at the time of publishing. No responsibility or liability is accepted for any errors of fact or omission expressed therein. Past performance is not a reliable indicator of future results.
This above article is not to be read as investment, legal or tax advice and it takes no account of particular personal or market circumstances; all readers should seek independent investment advice before investing in cryptocurrencies.
We recommend you obtain financial advice before making a decision to use your credit card to purchase cryptoassets or to invest in cryptoassets.In the UK, it's legal to buy, hold, and trade crypto, however cryptocurrency is not regulated in the UK. It's vital to understand that once your money is in the crypto ecosystem, there are no rules to protect it, unlike with regular investments.
You should not expect to be protected if something goes wrong. So, if you make any crypto-related investments, you're unlikely to have recourse to the Financial Services Compensation Scheme (FSCS) or the Financial Ombudsman Service (FOS) if something goes wrong.
----------------------------------------------------------------------------------------------
CHFJPY Breakout and Potential Retrace!Hey Traders, in today's trading session we are monitoring CHFJPY for a selling opportunity around 197.700 zone, CHFJPY was trading in an uptrend and successfully managed to break it out. Currently is in a correction phase in which it is approaching the retrace area at 197.700 support and resistance area.
Trade safe, Joe.
EURUSD Breakout and Potential Retrace!Hey Traders, in tomorrow's trading session we are monitoring EURUSD for a selling opportunity around 1.16000 zone, EURUSD was trading in an uptrend and successfully managed to break it out. Currently is in a correction phase in which it is approaching the retrace area at 1.16000 support and resistance area.
Trade safe, Joe.
GOLD Breakout and Potential Retrace!Hey Traders, in today's trading session we are monitoring XAUUSD for a selling opportunity around 4,460 zone, GOLD was trading in an uptrend and currently is in a correction phase in which it is approaching the retrace area at 4,460 support and resistance area.
Trade safe, Joe.
NZD/CAD SELLERS WILL DOMINATE THE MARKET|SHORT
NZD/CAD SIGNAL
Trade Direction: short
Entry Level: 0.825
Target Level: 0.823
Stop Loss: 0.826
RISK PROFILE
Risk level: medium
Suggested risk: 1%
Timeframe: 1h
Disclosure: I am part of Trade Nation's Influencer program and receive a monthly fee for using their TradingView charts in my analysis.
✅LIKE AND COMMENT MY IDEAS✅
USD/JPY SHORT FROM RESISTANCE
Hello, Friends!
USD/JPY uptrend evident from the last 1W green candle makes short trades more risky, but the current set-up targeting 159.587 area still presents a good opportunity for us to sell the pair because the resistance line is nearby and the BB upper band is close which indicates the overbought state of the USD/JPY pair.
Disclosure: I am part of Trade Nation's Influencer program and receive a monthly fee for using their TradingView charts in my analysis.
✅LIKE AND COMMENT MY IDEAS✅
EUR/NZD BEARS ARE GAINING STRENGTH|SHORT
EUR/NZD SIGNAL
Trade Direction: short
Entry Level: 1.960
Target Level: 1.957
Stop Loss: 1.962
RISK PROFILE
Risk level: medium
Suggested risk: 1%
Timeframe: 1h
Disclosure: I am part of Trade Nation's Influencer program and receive a monthly fee for using their TradingView charts in my analysis.
✅LIKE AND COMMENT MY IDEAS✅
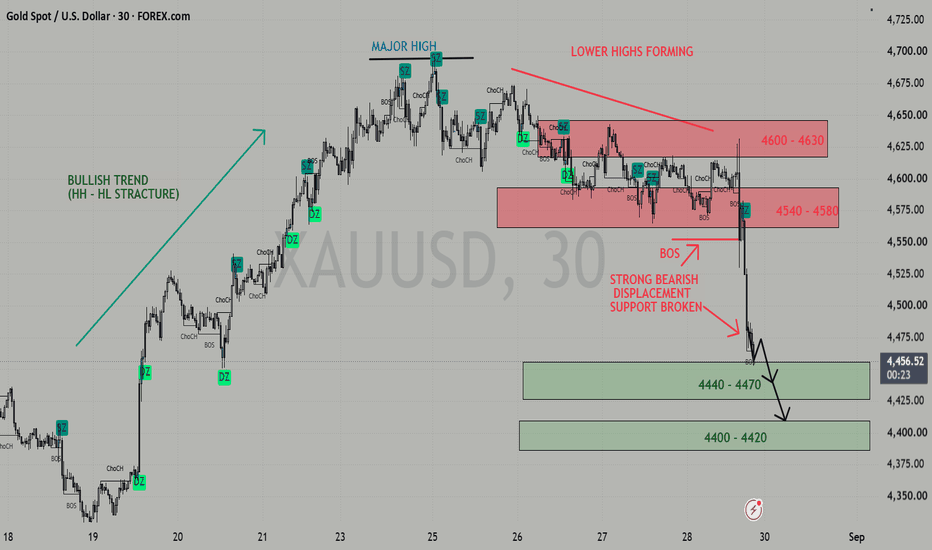
GOLD COLLAPSE ALERT 30M BEARISH STRACTURE SHIFTXAU/USD 30M — Structure Analysis 🔴
Your chart is showing a clear bearish structure shift.
Market Structure
Price first formed HH → HL → HH, reaching the major high around 4,690–4,700.
After that, price started creating Lower Highs.
The 4,600–4,580 area acted as support multiple times.
Price has now broken that support with strong bearish displacement + BOS.
Current structure is therefore BEARISH.
🔴 Key Levels
Sell / Retest Zone: 4,540 – 4,580
Major Resistance: 4,600 – 4,630
First Target: 4,440 – 4,470
Second Target: 4,400 – 4,420
📉 Expected Move
BOS ↓ → Pullback into 4,540–4,580 → Rejection → Continuation ↓
The best setup would be waiting for a pullback/retest, rather than chasing the large bearish candle at the current price.
Invalidation: A strong 30M reclaim/close above 4,600 would weaken the bearish setup.
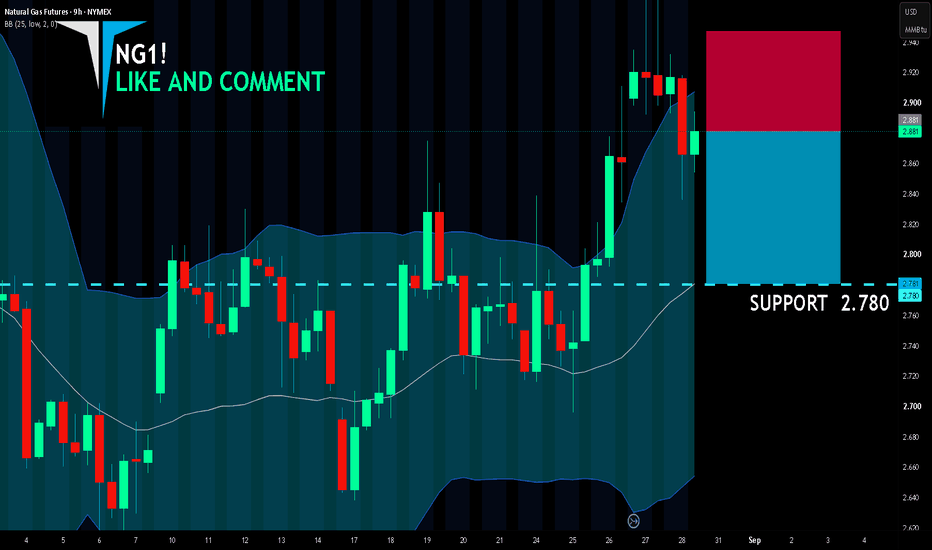
NG1! SELLERS WILL DOMINATE THE MARKET|SHORT
NG1! SIGNAL
Trade Direction: short
Entry Level: 2.881
Target Level: 2.780
Stop Loss: 2.947
RISK PROFILE
Risk level: medium
Suggested risk: 1%
Timeframe: 1h
Disclosure: I am part of Trade Nation's Influencer program and receive a monthly fee for using their TradingView charts in my analysis.
✅LIKE AND COMMENT MY IDEAS✅
EUR/JPY BEARISH BIAS RIGHT NOW| SHORT
Hello, Friends!
The BB upper band is nearby so EUR-JPY is in the overbought territory. Thus, despite the uptrend on the 1W timeframe I think that we will see a bearish reaction from the resistance line above and a move down towards the target at around 184.354.
Disclosure: I am part of Trade Nation's Influencer program and receive a monthly fee for using their TradingView charts in my analysis.
✅LIKE AND COMMENT MY IDEAS✅
$ZEC: 2W Structural Breakout Or Another 98% Distribution Cycle?CRYPTOCAP:ZEC : 2W Structural Breakout Or Another 98% Distribution Cycle?
The Full #ZEC Chart Shows A Repeating HTF Structure:
1️⃣ 2017–2018: $22 → $900 = ~4,000% Rally
➡️ Distribution: $900 → $18.50 = ~98% Crash
2️⃣ 2020–2021: $18.50 → $372 = ~1,900% Rally
➡️ Distribution: $372 → $15.85 = ~96% Crash
3️⃣ Current Cycle: Accumulation Started Near $15.85 In July 2024.
➡️ Since Then, ZEC Has Exploded Toward $888+ And Is Now Near ATH.
But The Risk/Reward Is Changing.
🇺🇸 Grayscale’s Spot Zcash ETF Started Trading On NYSE Arca On August 25.
The Catalyst Is No Longer A Rumour. It Is LIVE.
“Buy The Rumour. Sell The News.”
ZEC/USDT Is Now Trading Into Major Historical Resistance Around $850–$900, While RSI Is Showing Bearish Divergence And Failing To Confirm The Latest Expansion.
I Am NOT Saying ZEC/USDT Cannot Go Higher.
I Am Saying Risk Is Increasing At These Levels.
My Strategy:
❌ No Chasing ZEC/USDT At $850–$900.
🔻 Watching For Confirmed Distribution/Short Setups.
🎯 Long-Term, Watching $50–$100 For Potential Accumulation.
▶️ If $900 Breaks, Holds, And Converts Into Support, I Will Reassess.
Until Then, I Prefer Capital Protection Over FOMO.
Trade The Structure. Not The Hype. NFA & Always DYOR
$BTC HTF UPDATE | THE REJECTION WE WAITED FOR HAS PRINTEDCRYPTOCAP:BTC HTF UPDATE | THE REJECTION WE WAITED FOR HAS PRINTED 🔻
Bitcoin has now reacted exactly from the $81K–$83K HTF resistance zone we identified earlier.
The Daily candle closed decisively bearish, showing a strong rejection from this supply area and confirming that buyers are still failing to establish acceptance above $83K.
From an SMC/ICT perspective, the key structure remains unchanged:
🔻 $81K–$83K = HTF supply / bearish order block
🔻 $83K = critical HTF invalidation
🔻 $78K = current battleground
🔻 Loss of lower liquidity = potential acceleration
My primary HTF downside objective remains $55K–$50K.
I am NOT looking for a bullish reversal until BTC can reclaim $83K and secure a convincing HTF close above it.
Until that happens, every relief rally into resistance remains vulnerable to another distribution leg.
The level has already delivered the rejection.
Now the question is simple: Does Bitcoin continue hunting downside liquidity? 🔻