Bullish Patterns
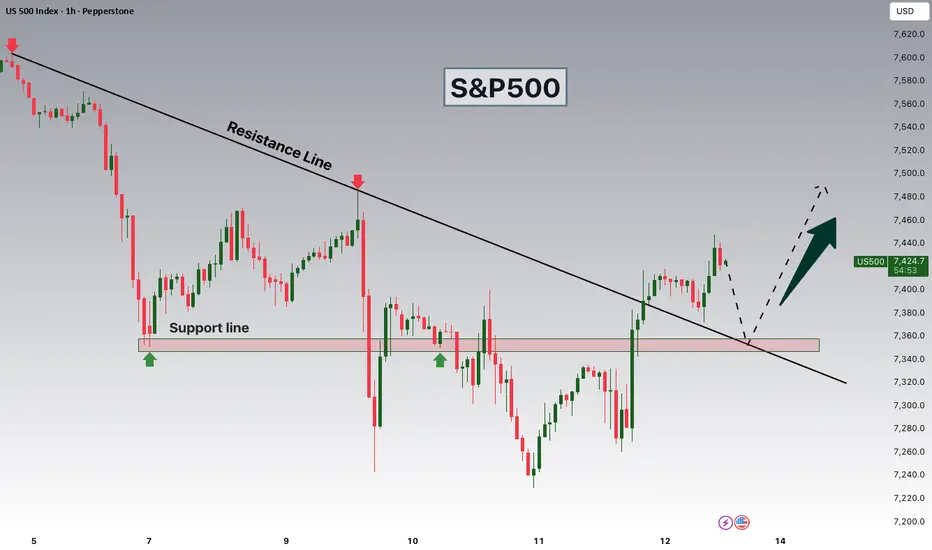
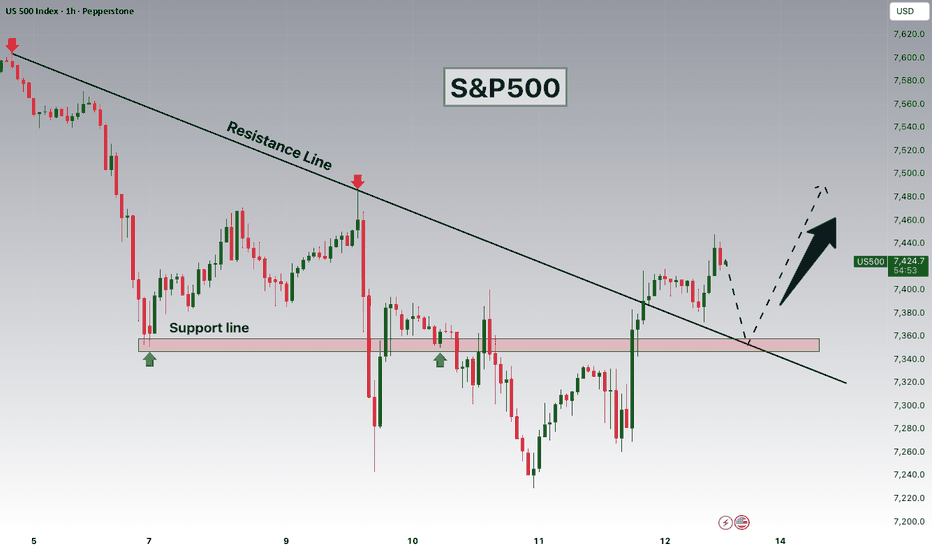
S&P500 Breakout and Potential Retrace! Hey Traders, in today's trading session we are monitoring US500 for a buying opportunity around 7,350 zone, S&P500 was trading in a downtrend and successfully managed to break it out. Currently is in a correction phase in which it is approaching the retrace area at 7,350 support and resistance area.
Trade safe, Joe.
SP500 — Liquidity collected, now what?
🏆The breakdown from the highlighted zone happened exactly as projected, and price swept through multiple downside liquidity areas before finding support.
Now we're seeing a strong recovery from the lower part of the structure, with buyers reclaiming liquidity levels one by one.
📈 Bullish scenario
If the current momentum continues, the next objective is a return toward the broken supply zone. A breakout there could completely shift market sentiment back to bullish.
📉 Bearish scenario
As long as price remains inside this recovery structure, bulls have the advantage. A rejection from the current liquidity area would put the lower zones back in play.
📊 What happened?
✅ Zone breakdown triggered perfectly
✅ Downside liquidity targets were reached
✅ Market reacted from the projected area
✅ Strong recovery followed from the lower zone
✅ Buyers are attempting to regain control
ETH – The Macro Support Zone Is HereEthereum is now approaching a major confluence support area that has played a key role in previous cycles.
This support is formed by the intersection of:
🔹 The lower bound of the long-term red wedge pattern
🔹 The $1,000 - $1,500 support zone
This combination creates a strong oversold area where buyers could gradually start stepping back into the market.
As a result, we will be expecting the bulls to take over sooner rather than later. 📈
The important question is not if, but when.
It could take a couple of weeks.
It could take a couple of months.
But as long as Ethereum remains around this macro support intersection, the risk-to-reward increasingly favors the bulls. 🎯
Keep in mind that major bottoms are usually a process, not a single candle.
The market often spends time consolidating, building a base, and exhausting sellers before the next bullish phase begins.
📌 The key area to watch remains the intersection between the lower wedge support and the $1,000 - $1,500 demand zone.
Will this macro support trigger the next major Ethereum bull run? 🤔
⚠️ Disclaimer: This is not financial advice. Always do your own research and manage risk properly.
📚 Stick to your trading plan regarding entries, risk, and management.
Good luck! 🍀
All Strategies Are Good; If Managed Properly!
~Richard Nasr
GOLD SENDS CLEAR BULLISH SIGNALS|LONG
GOLD SIGNAL
Trade Direction: long
Entry Level: 4,065.87
Target Level: 4,143.33
Stop Loss: 4,014.40
RISK PROFILE
Risk level: medium
Suggested risk: 1%
Timeframe: 1h
Disclosure: I am part of Trade Nation's Influencer program and receive a monthly fee for using their TradingView charts in my analysis.
✅LIKE AND COMMENT MY IDEAS✅
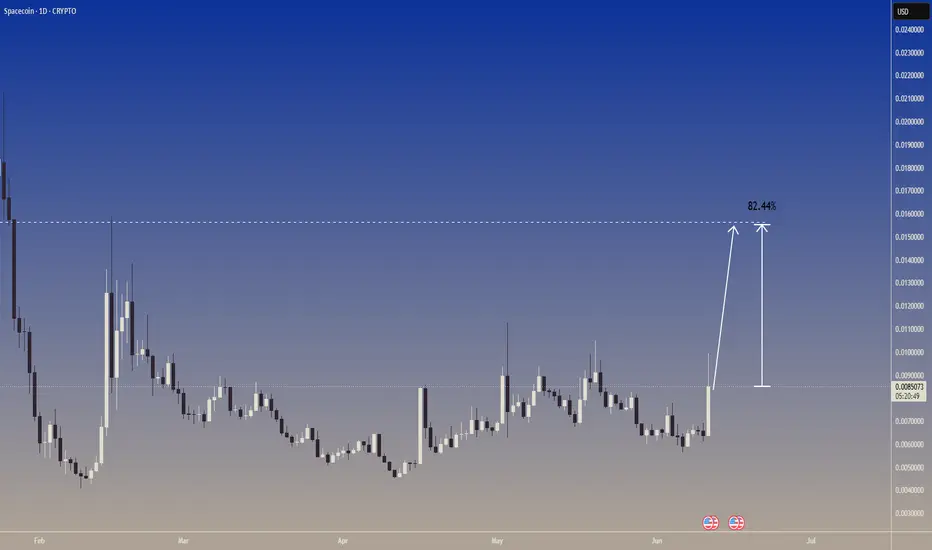
SPACE/USD - Targeting 82% Upside PotentialSPACE/USD has established a solid base and is showing renewed strength. The chart indicates a clear path for upward movement, with strong buying interest emerging. We anticipate an impressive 82% rally from the current price, as the asset builds momentum to challenge previous highs.
SUIUSDT Holding Key Support — Bounce Setup Toward Range HighsSUIUSDT is currently holding near an important support zone around $0.73–$0.76. If the broader crypto market improves and buyers step back in, SUI could attempt a recovery move from this zone.
Recent ecosystem updates remain mixed. On the positive side, Sui’s Confidential Transfers public beta adds long-term utility for privacy-focused payments and institutional blockchain use cases. However, recent mainnet outage concerns may keep short-term sentiment cautious.
As long as SUI holds above support, the setup remains favorable for a possible bounce toward the next upside targets. A clean break below the stop-loss area would weaken the bullish structure.
Trading Levels
Entry Zone: $0.73–$0.76
Take Profit 1: $1.08
Take Profit 2: $1.33
Stop Loss: $0.65
Trend Bias: Bullish above support
Invalidation: Breakdown below $0.65
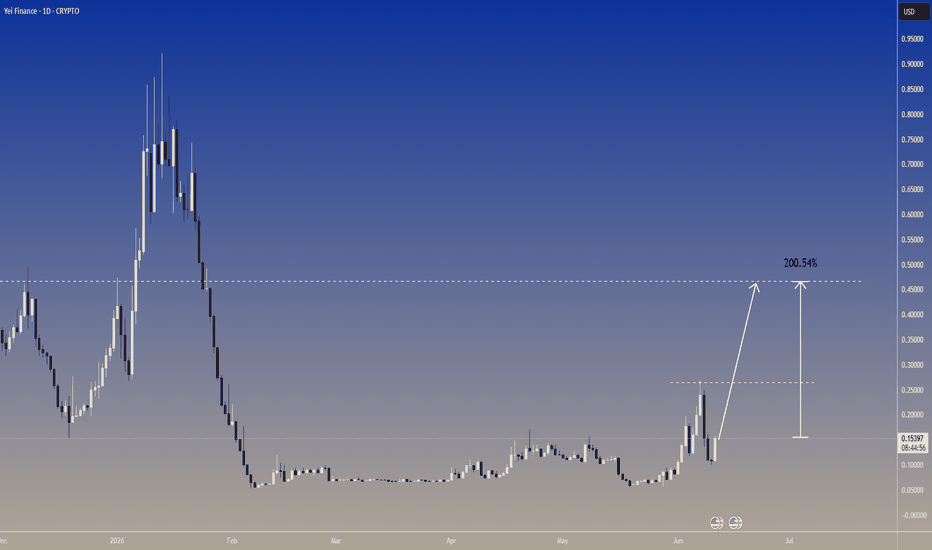
CLOY/USDT - Set for a 200% Explosive MoveCLOY/USDT has demonstrated a clear accumulation phase, followed by a recent strong impulsive move. This indicates significant buying interest and a potential for a massive rally. We are projecting an impressive 200% price increase from current levels, as the asset gains momentum and targets previous highs.
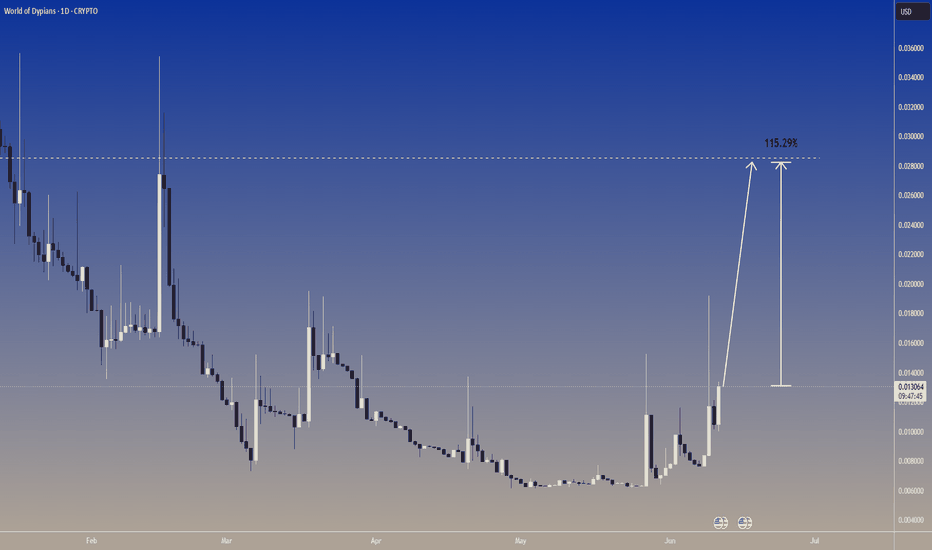
WOD/USDT - Preparing for a 115% RallyWOD/USDT has formed a strong bottoming pattern over several weeks, indicating a significant reversal is underway. Recent price action shows a surge in buying pressure, breaking key resistance levels. We anticipate a substantial upward continuation, targeting a gain of approximately 115% from the current price, as momentum builds towards higher levels.
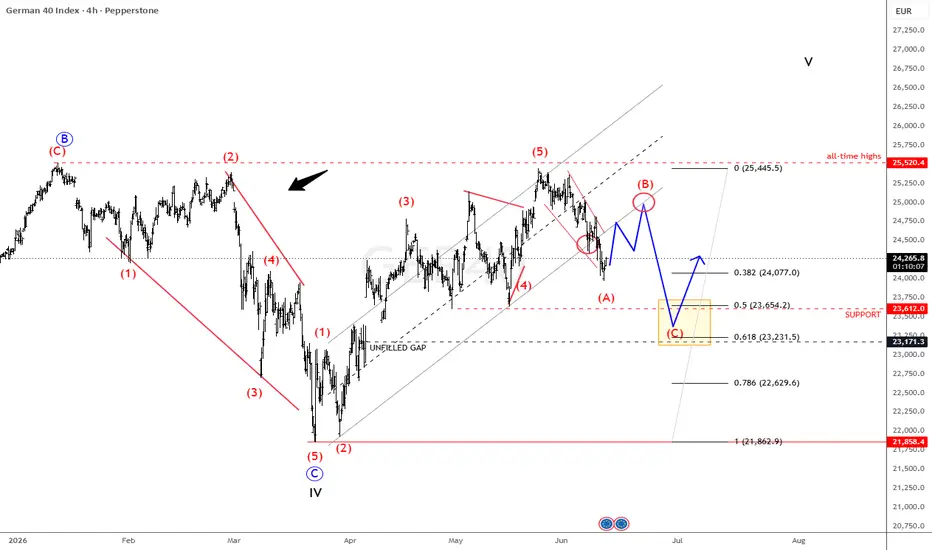
DAX Breakdown Signals Deeper Corrective PhaseDAX is slowing down and now attempting to break the support line of the impulsive channel drawn from the March swing lows, signaling that momentum is fading and a higher-degree correction may be unfolding. The current price action can be interpreted as a potential leading diagonal forming within wave (A), which often appears in early stages of a broader three-wave correction.
If this structure is confirmed, we should expect a continued three-wave (A)(B)(C) decline, although a temporary stabilization or corrective bounce in wave (B) is still likely before further downside resumes in wave (C). This would fit a typical corrective sequence where initial weakness is followed by a counter-trend recovery before continuation.
On the downside, the first key area of interest lies around the previous wave four support near 23,600. If selling pressure continues, a deeper move toward the 23,170–23,000 region becomes possible, where a major unfilled gap is located. Such gap zones often act as strong reaction areas and could eventually trigger a meaningful rebound once filled.
Despite the current weakness, this correction would still be consistent with a larger-degree bullish structure, where the broader expectation remains that the index could retest all-time highs later in the year as part of a higher-degree wave five advance on the daily timeframe.
NZDJPY – Trend Still Up, Support Coming Into PlayNZDJPY has been maintaining a clear bullish structure, trading within a well-defined rising channel for over a year.
After the recent pullback, price is now approaching a strong confluence support area formed by:
🔹 The lower bound of the rising channel
🔹 The blue horizontal support zone
This intersection creates an attractive area where buyers could step back in and defend the broader uptrend.
As long as this support confluence holds , we will be looking for trend-following long opportunities. 🚀
The overall trend remains bullish, and corrections toward support are often healthy pauses within an ongoing uptrend.
A bullish reaction from this zone could trigger the next leg higher toward the upper bound of the channel and potentially fresh highs. 🎯
📌 The key level to watch is the intersection between the channel support and the blue demand zone.
Will the bulls defend the trend once again? 🤔
⚠️ Disclaimer: This is not financial advice. Always do your own research and manage risk properly.
📚 Stick to your trading plan regarding entries, risk, and management.
Good luck! 🍀
All Strategies Are Good; If Managed Properly!
~Richard Nasr
Covered call on BULL....NICE 10% plus day. I usually don't sell covered calls THIS far away. This does cover 2 free days of theta.
100 sma on daily will be resistance along with the 200 sma. I wouldn't be SO mad if I sold BULL at $10.10. This stock is still a buy out candidate. But with bitcoin staying low and weak..this stock probably stays below $10 before aug.
NAS100 — Daily | HTF Bullish Continuation SetupHigher-timeframe trend remains bullish — Monthly and Weekly in clear expansion to the upside. Recent pullback is corrective, not a reversal.
Waiting for price to retrace into the Weekly FVG for a discount long entry, then continuation toward external range liquidity at the highs.
📍 Entry POI — Weekly FVG: 27,800–28,600
🎯 Take Profit — ERL: 30,783
❌ Invalidation: 27,515
Plan: wait for price to retrace into the FVG → confirmation at the POI → long toward ERL. No reaction, no trade.
IRL → ERL. Patience over prediction.
Personal analysis, not financial advice.
EUR/JPY BULLISH BIAS RIGHT NOW| LONG
Hello, Friends!
Previous week’s red candle means that for us the EUR/JPY pair is in the downtrend. And the current movement leg was also down but the support line will be hit soon and lower BB band proximity will signal an oversold condition so we will go for a counter-trend long trade with the target being at 185.371.
Disclosure: I am part of Trade Nation's Influencer program and receive a monthly fee for using their TradingView charts in my analysis.
✅LIKE AND COMMENT MY IDEAS✅
SILVER BEST PLACE TO BUY FROM|LONG
SILVER SIGNAL
Trade Direction: long
Entry Level: 6,428.3
Target Level: 6,802.2
Stop Loss: 6,177.6
RISK PROFILE
Risk level: medium
Suggested risk: 1%
Timeframe: 1h
Disclosure: I am part of Trade Nation's Influencer program and receive a monthly fee for using their TradingView charts in my analysis.
✅LIKE AND COMMENT MY IDEAS✅
NZD/CAD LONG FROM SUPPORT
NZD/CAD SIGNAL
Trade Direction: long
Entry Level: 0.810
Target Level: 0.813
Stop Loss: 0.808
RISK PROFILE
Risk level: medium
Suggested risk: 1%
Timeframe: 1h
Disclosure: I am part of Trade Nation's Influencer program and receive a monthly fee for using their TradingView charts in my analysis.
✅LIKE AND COMMENT MY IDEAS✅
US30: Structural Evolution | Linear Equality vs. Log Expansion“Price is the outcome; Structure is the cause.”
This analysis of the Dow Jones Industrial Average (US30) explores the final stages of the current impulsive cycle, distinguishing between two primary structural outcomes based on scaling methodology:
1. The Conservative Scenario (Linear Scale):
Based on a Sideway Structure for Wave IV, this path targets the Equal First Wave projection. Key targets are established at the 50,570 - 57,878 cluster, where Wave 5 reaches equality with Wave 1.
2. The Aggressive Scenario (Log Scale):
Projecting an Expanded Fifth Wave. Utilizing a logarithmic scale, this count anticipates a high-momentum extension, suggesting the market’s internal rhythm is pushing for an over-extended terminal move.
Technical Constraints:
Invalidation Level: A price drop below 36,943.25 (Wave One Territory) invalidates the current impulsive count.
Structure Confirmation: Watch for a clean breakout above the Terminal Channel to confirm the commencement of the final sub-wave.
The Alternation Rule: Note the structural contrast between the Wave II Zigzag and the complex Wave IV Sideway correction.
Patterns whisper… and I listen.
Mr. Nobody
Elliott Wave Researcher
yesterday: Dow Jones Industrial Average — A 130‑Year Elliott Wave Perspecti
yesterday: When Structure Reveals the Path of Price | DJI Elliott Wave Stud
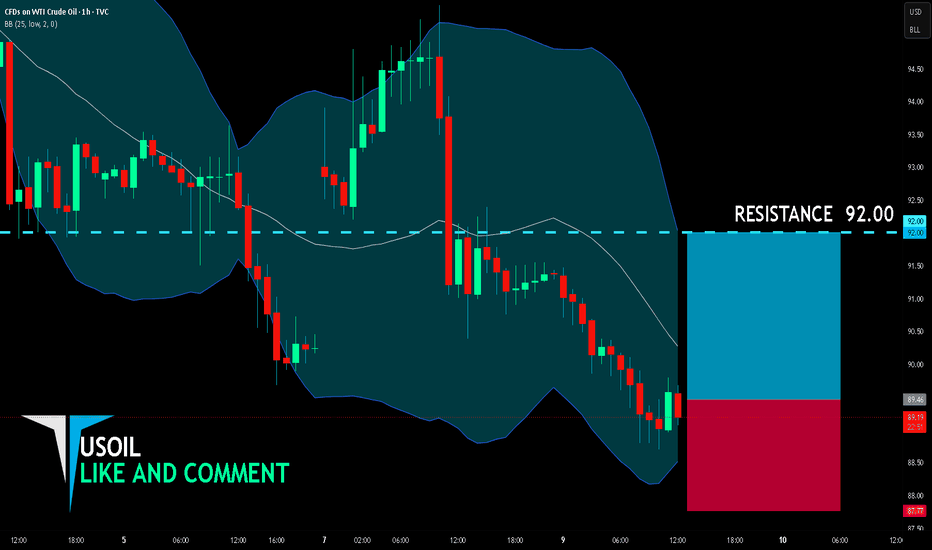
USOIL SENDS CLEAR BULLISH SIGNALS|LONG
USOIL SIGNAL
Trade Direction: long
Entry Level: 89.46
Target Level: 92.00
Stop Loss: 87.77
RISK PROFILE
Risk level: medium
Suggested risk: 1%
Timeframe: 1h
Disclosure: I am part of Trade Nation's Influencer program and receive a monthly fee for using their TradingView charts in my analysis.
✅LIKE AND COMMENT MY IDEAS✅
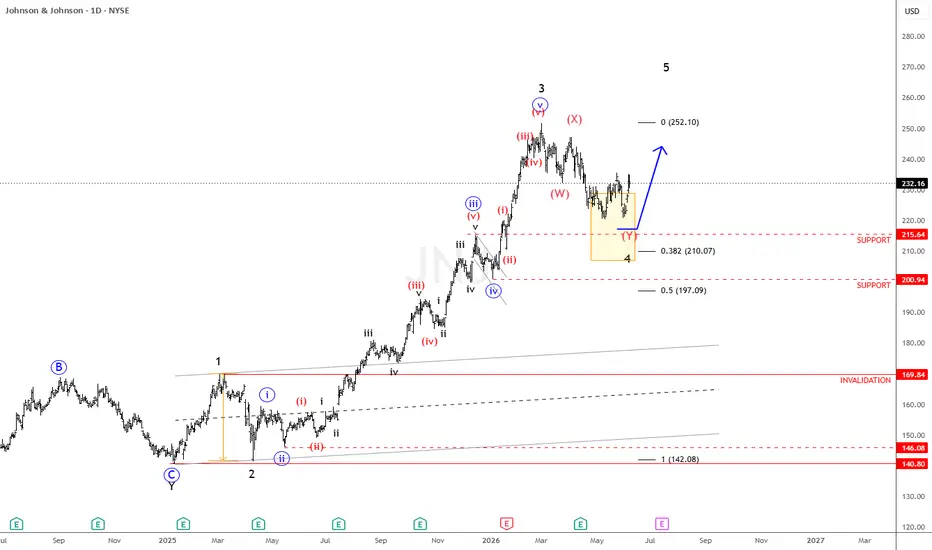
Johnson & Johnson Update: Wave 4 Correction Nearing CompletionAs discussed on November 14, 2025, Johnson & Johnson was still tracking an extended wave 3 structure with further upside potential. Since then, price has turned lower and retraced more deeply than initially expected, but the move still appears corrective rather than a trend reversal.
The current decline continues to respect key trendline support from the June 2025 lows, suggesting the pullback is likely part of a higher-degree wave 4 correction, potentially unfolding as a complex WXY structure. From a broader perspective, the larger bullish impulse from early 2025 still appears incomplete, leaving room for a possible final wave 5 to the upside once the correction completes. Key support is now seen at 215–225, with deeper support at 210–200 (38.2% retracement).
Highlights
. Pullback still looks counter-trend, complex WXY correction
. Key support zone at 215–225
. Next support near 210-200 (38.2%)
. Bullish wave five still possible on higher timeframe
AUD/CHF SENDS CLEAR BULLISH SIGNALS|LONG
Hello, Friends!
AUD/CHF pair is in the downtrend because previous week’s candle is red, while the price is evidently falling on the 1H timeframe. And after the retest of the support line below I believe we will see a move up towards the target above at 0.561 because the pair oversold due to its proximity to the lower BB band and a bullish correction is likely.
Disclosure: I am part of Trade Nation's Influencer program and receive a monthly fee for using their TradingView charts in my analysis.
✅LIKE AND COMMENT MY IDEAS✅
USD/CHF Major bullish reversal ?This post shows a zoomed-out overview of USD/CHF for a broad understanding of it's directional outlook.
USDCHF is in bearish trend since inception. The down-move had started to look extended since June 2025 when we zoom-out and look, it in daily time frame. A reversal of trend is more reasonable to expect since the structure of DXY seems promising for the level of 125+ in broader time frame (consider my published idea on DXY, link attached). Surge in DXY will fuel the rally of USD.CHF, USD being base currency.
Structurally, looking from the pure technical perspective, bearish trendline seems to be at the brink of collapse, because of the HH & HL structure supported by bullish trendline, which may lead price to retest the major resistance level of 0.8042 as marked (the last hinderance), once taken out the path to further up-side will open.
For Educational Purposes only, Not an Investment Advice.
Any new perspective you want to add, Please feel free to mention below in the comment.
Regards CrazyTrades247.