KHC — Bullish Bat Harmonic PatternKraft Heinz is approaching a very interesting Bullish Bat harmonic pattern, with the pattern completing near the Potential Reversal Zone (PRZ).
After years of weakness, KHC is reaching an area where this Bat pattern could potentially produce a larger reversal.
Trade Setup
Entry: $23.00–$23.30
Stop Loss: $20.50
TP1: $31.00
TP2: $36.50
TP3: $43.50
TP4: $55.00
The $23.00–$23.30 area is the key zone I'm watching. This is where the Bullish Bat is expected to complete, making it the area where I want to see buyers step in.
The first target is $31.00, followed by $36.50, $43.50, and potentially $55.00 if the larger reversal develops.
The $20.50 stop loss gives the trade a clearly defined invalidation level. If price breaks below $20.50, the bullish Bat setup is no longer valid.
Confirmation Is Still Key
I don't want to assume the reversal simply because price reaches the PRZ. The market can overshoot these zones before reversing.
What I'm looking for is confirmation that buyers are taking control around $23.00–$23.30.
If that happens, the setup becomes much more interesting from a risk/reward perspective.
$23.00–$23.30 Entry → $20.50 Stop → $31 → $36.50 → $43.50 → $55.00
This is a long-term setup, so patience is important. The Bat gives us the area to watch; price action and confirmation will determine whether the reversal is actually underway.
Bullish Bat
KSE100 +ve aspects!13-09-2026
> Bullish Bat Pattern (positive sign). However, needs some consolidation.
> Weekly closing above Important Trendline Support (positive sign).
> Immediate Resistance around 176000 - 178700
> Market is safe as long as it stays above 161000.
> Monthly Closing above 166000 - 167000 would be a +ve sign.
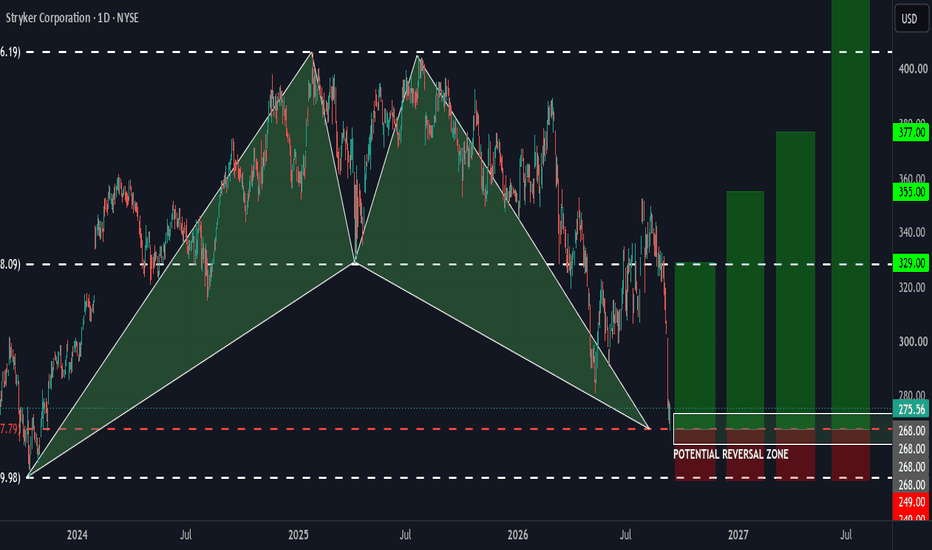
SYK: Bullish Bat Pattern With Strong Upside PotentialSYK is showing a bullish Bat pattern on the chart, with price now approaching the Potential Reversal Zone around the $262–$275 area.
This is an interesting setup because the Bat is completing near an important support area. If buyers step in and the pattern holds, SYK could have significant room to the upside.
Trade Setup
Entry Zone: $262–$275
Stop Loss: $249
Take Profit Targets:
TP1: $329
TP2: $355
TP3: $377
TP4: $450+
What I’m Watching
The $262–$275 area is the key reversal zone. This is where I would expect buyers to defend the bullish Bat pattern.
The first major target is $329. If SYK can reclaim that level with momentum, the next targets at $355 and $377 come into focus.
The bigger target is $450+, which would represent a very substantial move from the current reversal zone.
I like this setup because the Bat gives us a clearly defined risk level at $249, while the upside targets provide a strong potential risk-to-reward opportunity.
As always, the pattern can fail, so the $249 level is important. A decisive break below it would weaken the bullish setup.
Entry: $262–$275
Stop: $249
Targets: $329 → $355 → $377 → $450+
If the bullish Bat plays out, SYK could have a very strong move ahead.
BCH/USD: 2 Bullish Structures Pointing Toward the Same ReversalBitcoin Cash is approaching an interesting area on the weekly chart where 2 different technical structures appear to be lining up around the same price level.
The first is a potential Elliott Wave triangle, with the market potentially completing wave (E) near the $112-115 area.
At the same time, there is a potential bullish harmonic pattern completing in essentially the same zone. When two different methods point toward the same area, I think it is worth paying attention.
The $112 -115 Area Is the Key
The chart shows a Potential Reversal Zone around $112-115.
This area also lines up with the rising yellow trendline, which gives us another reason to watch the level closely.
However, I would not simply buy $112-115 just because the pattern reaches the zone. I would want to see the price reaction and confirmation around this area. Although it will be essential a no brainer entry lol.
If the Elliott Wave triangle completes wave (E) and the bullish harmonic pattern completes at approximately the same level, a strong reaction could signal that the larger bullish move is beginning.
Potential Trade Setup
Based on the levels shown on the chart:
Entry: Around :$112-115
Stop: $71
Take Profit 1: $424.82
Take Profit 2: $800
Take Profit 3: $4,345
Take Profit 4: $9,500
The first target at $424.82 would be an important area to watch. If BCH can reach that level and continue showing strength, the much larger targets become possible.
What I Am Watching
The biggest thing for me is the $112-115 support area and the yellow trendline.
If price reaches the reversal zone and starts building a bullish reaction, it would give more credibility to both the potential Elliott Wave triangle and the bullish harmonic setup.
If BCH breaks decisively below the reversal zone and especially below the $71 invalidation level, the bullish idea would be weakened considerably.
Nothing is guaranteed, especially on a long-term chart like this. But having two different technical structures potentially completing around the same level, makes BCH/USD an interesting setup to watch.
For me, $112-115 is the level that matters.If the market confirms the reversal there, the upside potential shown on the chart is significant.
FET/USDT Bullish Setup
FET/USDT is showing **two bullish harmonic patterns** at the same time: a **Bullish Bat** (green) and a **Bullish Butterfly** (yellow).
A **Bullish Bat** is a harmonic pattern that looks for a potential price reversal from a lower support area.
A **Bullish Butterfly** is another harmonic pattern that can signal a possible bullish reversal after a strong decline.
Here, both patterns point to the same area, making the **$0.0777–$0.0900 zone** important to watch.
**Entry:** Look for a bullish reaction around **$0.0777–$0.0900** before entering.
**Stop Loss:** Below **$0.0477**. A break below this level would invalidate the setup.
**Take Profit:** Possible targets are **$0.777, $3.50, $9.50, and $21.50**.
**In simple terms:** Two bullish patterns are pointing to the same support zone. If buyers step in, FET could potentially make a larger move upward.
Bullish Points in HUBCHUBC Analysis
Closed at 219.38 (21-07-2026)
Positive Points:
> Bullish Divergence
> Bullish Bat Pattern
Current Range (214 - 219) seems to be a Good Support Zone.
Potential to move upside towards 224 - 226 initially.
It should not break 210.
On a bigger tf, it is also making Bullish Flag Pattern.
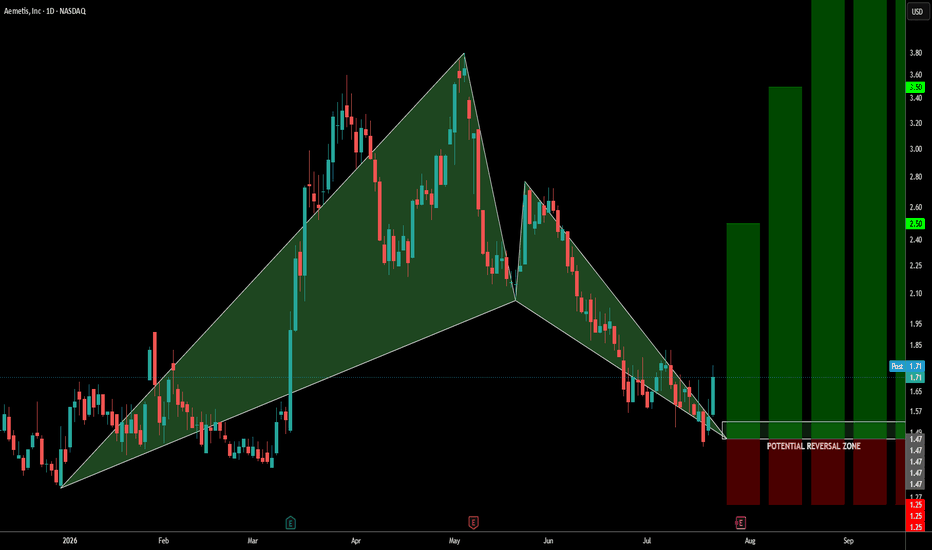
AMTX: Bullish Bat Pattern Signals a Potential ReversalAMTX has reached a key Potential Reversal Zone (PRZ) between $1.45 and $1.50, where a Bullish Bat Harmonic Pattern has completed. After an extended decline, this area could mark the beginning of a trend reversal if buyers step in and confirm the move.
Trade Setup
Potential Reversal Zone: $1.45–$1.50
Entry: Wait for a bullish confirmation above $1.50, or consider scaling into a position within the PRZ.
Stop Loss: Below $1.25.
Profit Targets: $2.50, $3.50, $5.00, $10.00, and $14.50.
The setup offers a favorable risk-to-reward profile, but confirmation remains important. A strong bullish candle or increased buying volume from the PRZ would add confidence to the trade, while a break below $1.25 would invalidate the pattern.
With clearly defined risk and multiple upside targets, AMTX is a chart worth keeping on your watchlist over the coming sessions.
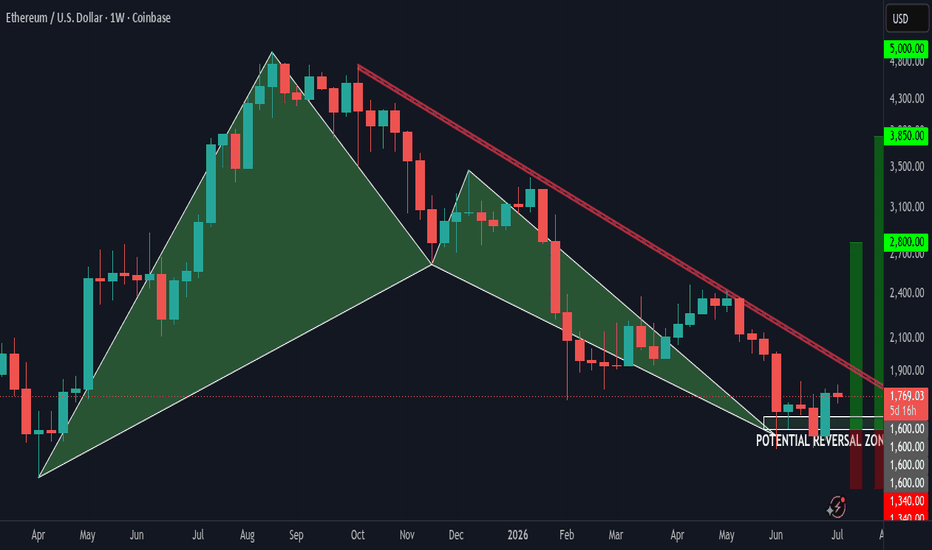
Ethereum's Bullish Bat Pattern Near CompletionEthereum's daily chart is forming a Bullish Bat Harmonic Pattern, with price now trading inside a key Potential Reversal Zone (PRZ). This area represents the completion of the pattern and coincides with a strong historical support level, making it a critical zone to watch for a bullish reversal.
A confirmed breakout from the descending trendline could shift momentum in favor of buyers, opening the door to upside targets at $2,800, $3,850, $5,000, and potentially $7,200 if the pattern fully plays out.
As with all harmonic setups, confirmation is essential. A sustained break below the PRZ would invalidate the pattern, while a strong bullish reaction could mark the beginning of Ethereum's next major upward move.
Bullish Patterns Showing Signs of Reversal!BERG Analysis
Closed at 92.32 (18-05-2026)
Bullish Bat Pattern + Bullish Divergence; Both are signs of reversal.
Also ABCD chart pattern touched its Point D (PRZ) in Golden Pocket Range.
So if this time 80 is not broken, we may witness upside towards 97 - 100 &
then around 110 - 111.
Bullish Bat Pattern in PAXGUSDTPAXGUSDT Analysis
CMP 4562.97(19-05-2026 02:59am PST)
Bullish Bat Pattern along with Bullish
Divergence showing signs of reversal.
However, 4488 is an Important Support.
Upside resistance is around 4800 - 4900 initially.
Crossing & Sustaining this range may lead it towards
5200 - 5300.
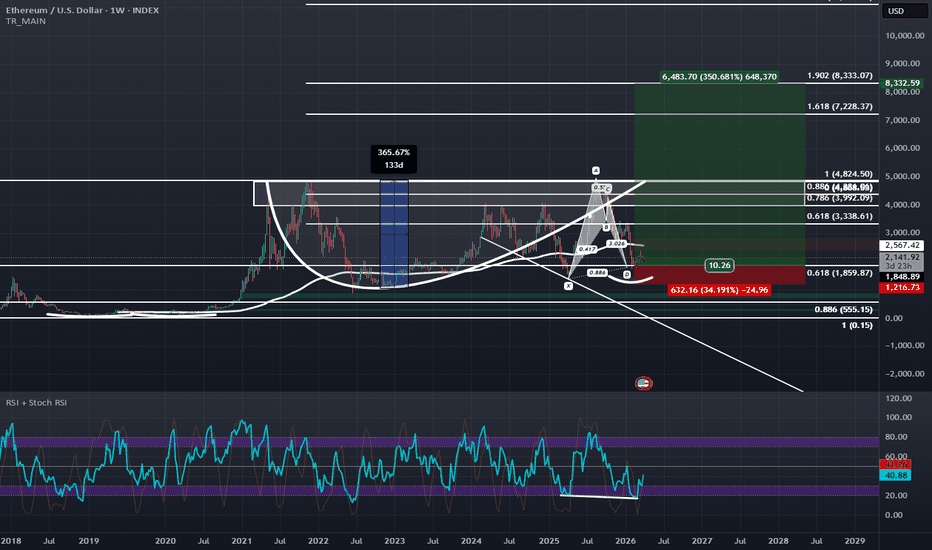
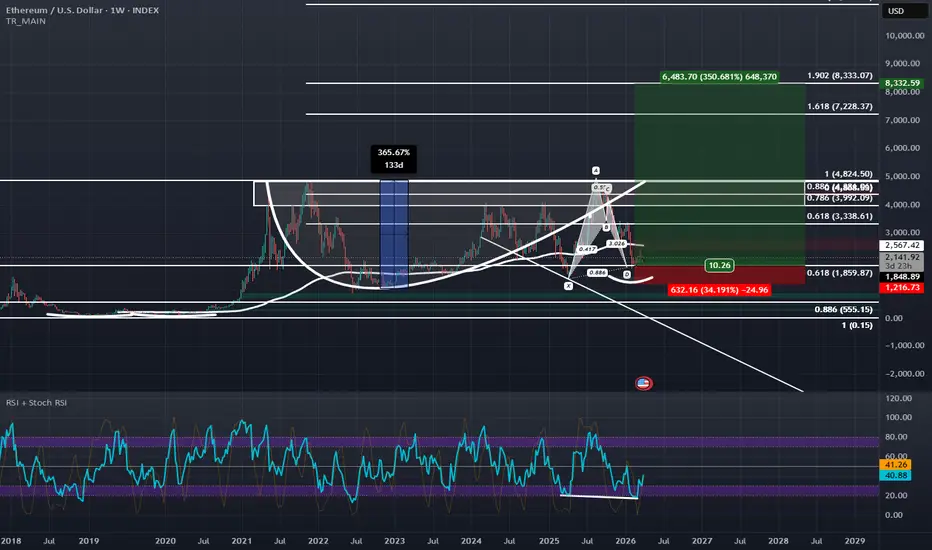
The Bullish Setup on ETH Has More Potential Than Once ThoughtFollowing up on this initial Bullish idea on the 4 Hour:
and this Bullish idea on the daily:
It would seem that ETH also has a big bullish setup on the weekly as seen in the current chart. We are at the all-time 0.618 Retrace and at this retrace we are making a local 0.886 and completing a Bullish Bat visible on the Weekly with Hidden Bullish Divergence on the RSI. If ETH really starts to bounce here at this heavy level of confluence it would be confirming a Partial-Decline of a Right-angled and Descending Broadening Formation, (a pattern of which that seems to be serving a secondary purpose of being the potential handle of a bigger Cup with Handle Pattern). If this starts to trade back towards 5000, chances of a Breakout are increased due to the partial decline, and the measured move of the Cup with handle and the Right-angled and Descending Broadening Formation both would take ETH to the 1.618-1.902 Fibonacci extension zones between $7,000, and $8,500.
It's also worth noting that ETHBTC on higher timeframes has also completed a Bullish Bat pattern and if you inflation adjust ETH's current price using the older metrics of the M1 Money supply before the rule change in 2020, ETH's price right now would actually be around $770 in terms of 2018 dollar value which is pretty cheap. So I'd say now would be as good of chance as any for ETH to stage a bottoming rally and this rally would likely be in line with the bottoming fractal we see on BTC:
and the topping pattern we see on USDT Dominance:
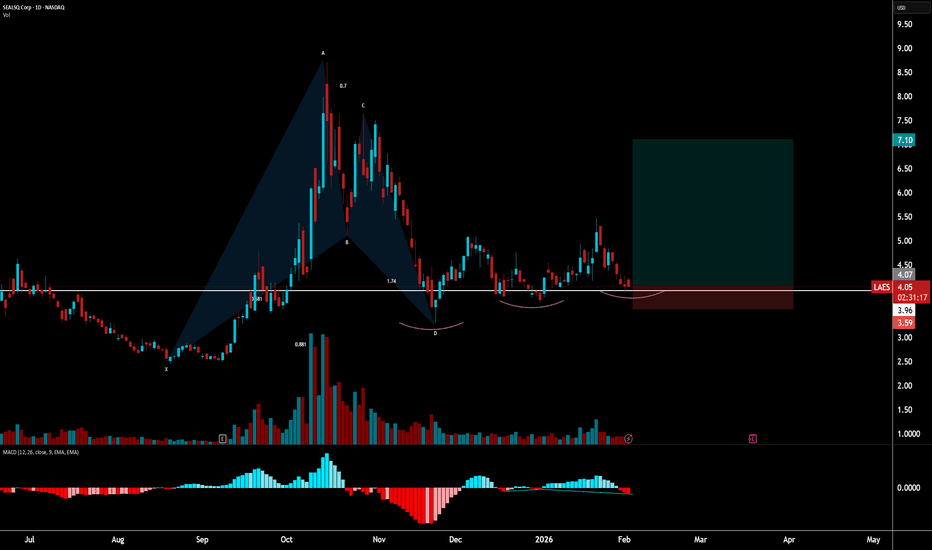
LAES Bullish Bat with Three Rising Valleys ReversalPattern Identified: Bullish Bat with strong confluence at Potential Reversal Zone (PRZ).
Key Confluence:
Harmonic PRZ: D aligns with 0.886 XA extension
Price Action: Three rising valleys forming at PRZ - showing accumulation and higher low structure
Momentum: Bullish divergence present on MACD
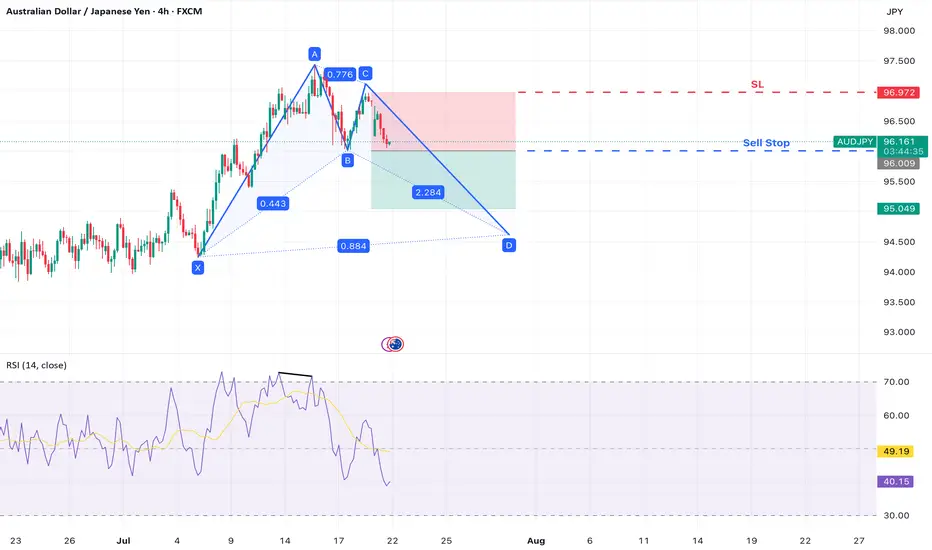
AUD/JPY – Bearish Move Within Bullish Bat StructureAUD/JPY is developing a Bullish Bat harmonic pattern on the 4-hour chart . While the full pattern has not yet completed, a potential short-term bearish opportunity is emerging as the pair begins forming the CD leg.
A clear b earish divergence on the RSI at Point A suggests waning bullish momentum, and a break below Point B may confirm the start of the final leg down toward Point D , completing the harmonic structure.
Trade Setup
Sell Stop Entry: 96.009 (break of Point B – confirms CD leg underway)
Stop Loss: 96.978 (above Point C – invalidates CD leg projection)
Take Profit 1: 95.040 (1:1 risk-to-reward level)
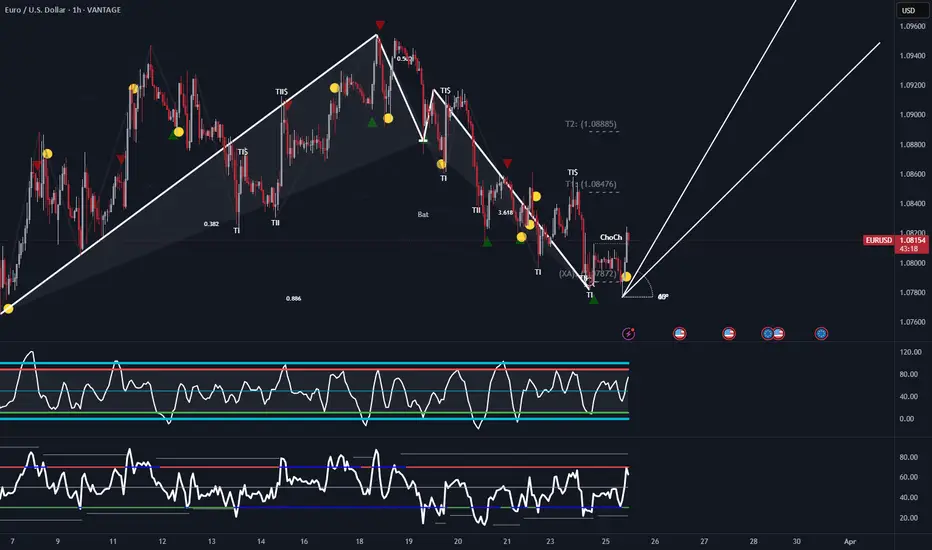
EUR/USD Technical Analysis – Potential Reversal SetupThe EUR/USD 1-hour chart displays a recent downtrend with a series of lower highs and lower lows, forming a bearish market structure. The Harmonic patterns such as the Bat suggest potential areas of reversal, aligning with Fibonacci retracement levels.
A Change of Character (ChoCh) at the latest low (XA 0.7872) signals a possible shift in trend. The presence of bullish reaction points, marked by green triangles and yellow circles, suggests buying pressure is increasing. Additionally, the projected upward trendlines indicate possible price targets at 1.08476 (T1) and 1.08885 (T2) .
The oscillators at the bottom indicate oversold conditions, reinforcing the likelihood of a bullish correction. However, confirmation via price action and volume is necessary before entering long positions. A break above key resistance levels would further validate the upside potential.
CAD/JPY: Potential Reversal as Buyers Step InCAD/JPY has shown signs of exhaustion in its bearish momentum after completing a deep Bat harmonic pattern. The pair has reached a key Fibonacci extension zone, where price action suggests a possible reversal.
Bullish interest is evident with price stabilising near the 105.50 level, supported by oversold conditions on momentum indicators. If buyers sustain pressure, a corrective move towards 106.50 and potentially 107.18 could unfold. Confirmation through a breakout of local resistance would further validate a bullish recovery scenario.
Price rengeBAT/USDT Chart:
Trend: Uptrend Price above moving average (yellow line).
Support: Green zone
Around 0.2317.
Resistance: Red zone Around 0.3778.
Possible Strategy:
Buy: Breaked EMA snd firs resistance
Sell: If price fails to break resistance
Note: Always consider market new and overall trends.
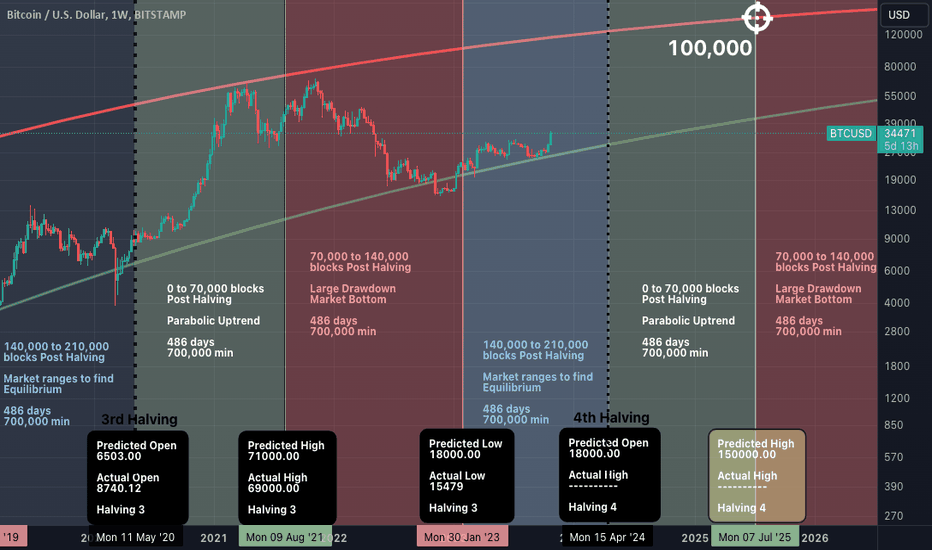
100,000$ per coin - BTC heading to 4th HalvingBITSTAMP:BTCUSD BINANCE:BTCUSD CME:BTC1! COINBASE:BTCUSD
What’s Bitcoin?
Bitcoin is a decentralized digital currency that operates on a network of computers, eliminating the need for intermediaries or central authorities. It was introduced in 2009 by an anonymous individual or group known as Satoshi Nakamoto, who outlined the concept in a white paper describing a peer-to-peer electronic cash system. Since then, Bitcoin has emerged as the leading and most valuable cryptocurrency globally, with a market capitalization exceeding $580 billion as of October 2023.
A notable characteristic of Bitcoin is its limited supply of 21 million coins, a threshold estimated to be reached around the year 2140. The creation of new bitcoins is regulated through a process called mining, which involves solving complex mathematical problems using specialized hardware and software. Miners compete to discover valid solutions that meet a specific difficulty level, adjusted approximately every two weeks to maintain an average block time of 10 minutes. The miner who successfully finds a valid solution for each block is rewarded with freshly minted bitcoins and transaction fees.
As of October 2023, the Bitcoin network has witnessed the mining of 813,378 blocks, with a current reward of 6.25 bitcoins per block.
Key Insights on Bitcoin's Price:
Recently, the mining of the 19.5 millionth bitcoin increased the circulating supply to 93% of the total. Additionally, a logarithmic regression analysis known as the rainbow chart illustrates the historical path of Bitcoin's price movement. This cyclic behaviour can be attributed to several factors:
Bitcoin tends to exhibit an overall bullish trend due to its limited supply and the halving of coins entering circulation approximately every four years. Historically, the Bitcoin halving has been a significant catalyst for price movements as it influences the supply-demand balance. The halving reduces the rate of new bitcoins being introduced into circulation while demand typically remains steady or grows over time. This creates a supply shock that often drives the price upward, particularly before and after the halving event.
Each halving period encompasses the mining of 210,000 blocks and exhibits distinct phases. The bullish phase spans from the first block to the 70,000th block, followed by a bearish phase from the 70,001st block to the 140,000th block, and finally a sideways phase from the 140,001st block to the 210,000th block. As previously mentioned, the halving diminishes the inflation rate of bitcoin and preserves its scarcity.
Bitcoin holds great influence over the entire cryptocurrency market due to its dominant market capitalization. This dominance follows a cyclical pattern, with the market share falling below 40% during bearish phases (after mining more than 140,000 blocks) and rising to around 70% during bullish phases.
During each era (between two halving periods), Bitcoin experiences an average drawdown of 80%.
Current Analysis:
We are currently in the third halving era, which commenced on May 11th, 2020, specifically within the equilibrium phase. The intersection of the mining of the 210,000th block and the lows of the logarithmic regression suggests a value of $30,000 USD per bitcoin.
The next Bitcoin halving is expected to take place in April 2024, at block number 840,000. This event will reduce the block reward from 6.25 bitcoins to 3.125 bitcoins, consequently lowering the annual inflation rate from approximately 1.8% to 0.9%. As a halving typically ushers in a bullish phase, it is predicted that the price of bitcoin will surpass $100,000.00 during this era.
Technical Analysis Using the MVRV Indicator:
One of the tools that can help investors and traders assess the value and potential of bitcoin is the MVRV ratio, which stands for market value to realized value. The MVRV ratio compares the current market capitalization of bitcoin (the total value of all coins at their current price) with its realized capitalization (the total value of all coins at their last moved price). The MVRV ratio can indicate whether bitcoin is overvalued or undervalued relative to its historical average cost basis.
The MVRV ratio can also be used to identify periods of extreme market sentiment, such as euphoria or panic. When the MVRV ratio is very high (above 4), it means that bitcoin is trading far above its realized value, implying that most holders are sitting on large unrealized profits and may be tempted to sell. This can signal a market top or a bubble territory. When the MVRV ratio is very low (below 1), it means that bitcoin is trading far below its realized value, implying that most holders are sitting on large unrealized losses and may be reluctant to sell. This can signal a market bottom or a buying opportunity.
As of October 2023, the MVRV ratio of bitcoin is about 2.110, which is slightly above its long-term average of 2. This suggests that bitcoin is fairly valued and not in a danger zone. The MVRV ratio has been trending up since November 9th 2022, when it reached a low of 0.75, indicating a recovery in the market sentiment and the lowest price of the 3rd Halving era. As we are far from the overbought level of 4, this suggests that there is still room for further growth in the price of bitcoin.
(These illustrations are just for educational purposes and are not financial advices).
Sources:
1. trustwallet.com
2. ieeexplore.ieee.org
3. nber.org
4. buybitcoinworldwide.com
5. bitinfocharts.com
6. nerdwallet.com
7. investopedia.com
8. buybitcoinworldwide.com
9. kitco.com
10. coinwarz.com
11. datawallet.com
12. blockchain.com
13. lookintobitcoin.com
14. bing.com
15. bitcoinmagazine.com
16. stopsaving.com
17. decentrader.com
18. trustwallet.com
19. bitinfocharts.com
20. nber.org
21. buybitcoinworldwide.com
22. cryptonews.com
23. finbold.com
24. inferse.com
25. buybitcoinworldwide.com
26. blockchain.com
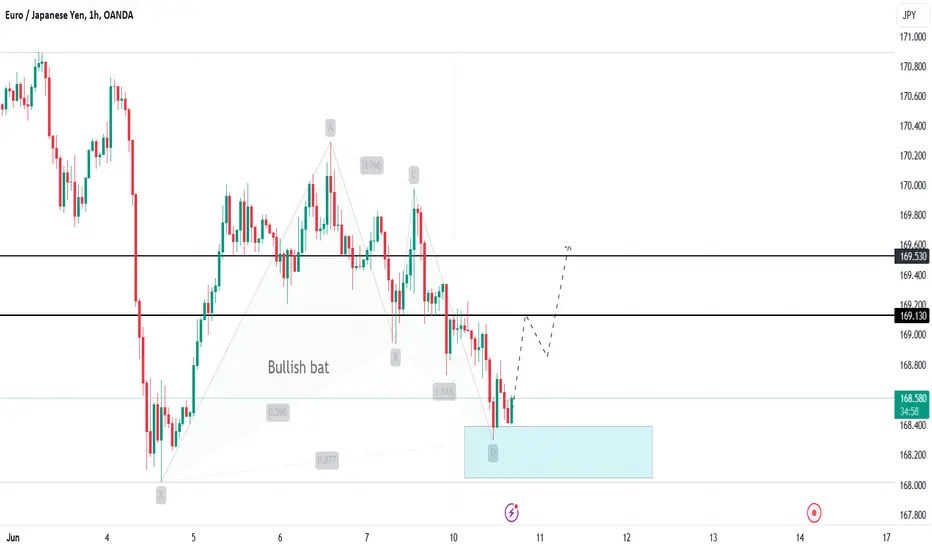
EURJPY Bullish Bat pattern: Forecasting an Upside moveHello traders,
A number of harmonic patterns are surfacing today. Here is my analysis of a clear bullish Bat pattern spotted on the EURJPY Pair. The Bullish Bat pattern is a harmonic pattern used in technical analysis to predict potential reversal zones. The EURJPY pair has formed this pattern with the following parameters:
X = 168.022
A = 170.293
B = 168.940
C = 169.976
D = 168.302
Here's the breakdown of the Fibonacci relationships for this pattern:
AB Leg: Retraces 38.2% to 50% of the XA leg. Point B at 168.940 confirms this.
BC Leg: Retraces 38.2% to 88.6% of the AB leg. Point C at 169.976 confirms this.
CD Leg: Extends 161.8% to 261.8% of the BC leg or retraces 88.6% of the XA leg. Point D at 168.302 confirms this and is close to the 88.6% retracement of the XA leg.
In summary, the points X, A, B, C, and D fit within the Fibonacci retracement and extension levels for a Bullish Bat pattern on EURJPY. This indicates a high probability of a bullish reversal at point D (168.302), which also qualifies as a good support zone for price.
In addition, my Elliott Wave analysis suggests the pair has completed the corrective wave ABC to the downside. I'm anticipating an impulsive move to the upside towards 169.70 and 170.31. Let's watch out for confirming price action.
Cheers and happy trading.
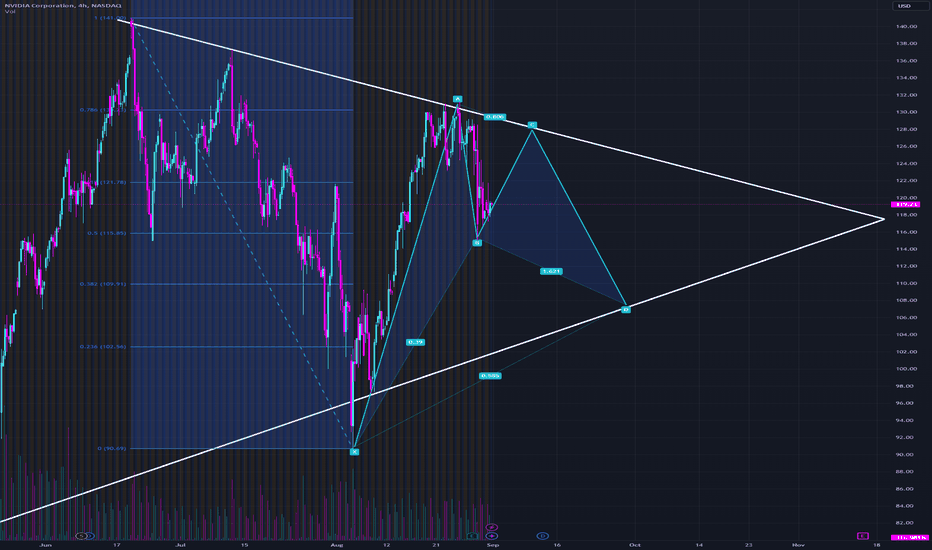
NVDA may form a bat harmonic within a pennant.NASDAQ:NVDA is potentially forming a bullish bat variation of the Gartley harmonic, within a pennant on the four-hour chart. As long as the earnings low at point B is maintained, there is potential for a reversal to point C next week, corresponding to the upper trendline from all-time highs.