Gold Bullish Butterfly Forming – Reversal Ahead?As I expected in the previous idea , Gold started declining from the Resistance zone($4,192 – $4,137) and has now reached the Support zone($4,004 – $3,895) — full target achieved .
At the moment, Gold is moving within that Support zone($4,004 – $3,895) and Potential Reversal Zone(PRZ) .
Looking at the 1-hour time frame , we can spot a Bullish Butterfly Harmonic Pattern forming, which is likely to complete right in that PRZ .
I expect that in the coming hours, once Gold enters
Butterfly
EURJPY: Two Potential Advanced Patterns Setting UpWe’ve got a pretty interesting situation developing on the EURJPY, where not just one, but two potential advanced pattern formations setting up simultaneously. Opportunities like this don’t happen often, and they’re a great example of how structure and symmetry can align to give traders multiple reasons to get involved in the market.
Identifying the Dual Pattern Setup
What makes this chart particularly exciting is that the two patterns overlap within the same price zone, creating a powerful co
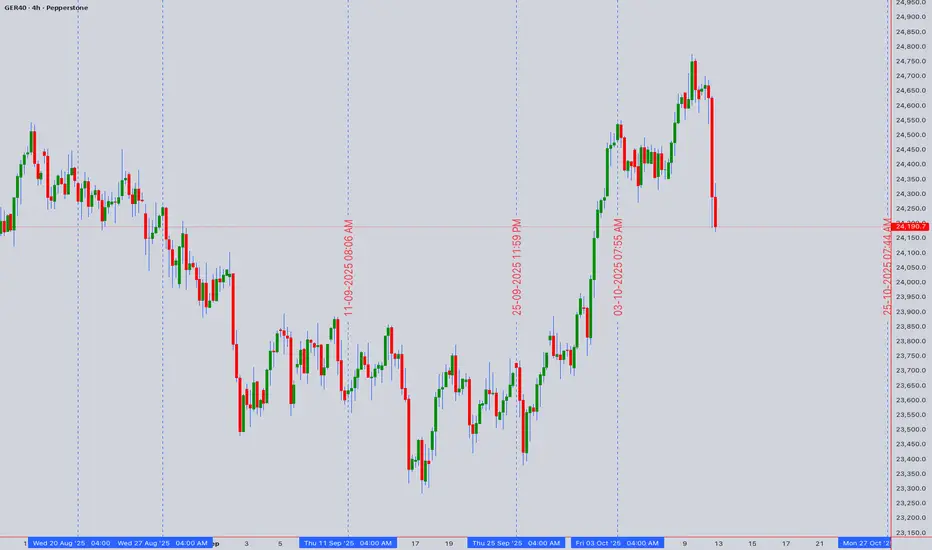
GER40 (DAX) Bulls in Control, But Overbought Signals Flash
GER40 (DAX) Bulls in Control, But Overbought Signals Flash Technical Forecast:
Asset: GER40 (DAX Index)
Closing Price: 24,190.7 (as of 11th Oct 2025) USTC+4
Analysis Timeframe: Intraday (1H/4H) & Swing (D/W)
1. High-Level Market Structure & Context
The GER40 maintains a robust bullish trend on higher timeframes, trading well above its key Daily and Weekly Moving Averages. However, the recent ascent has pushed the index into overbought territory on intraday charts, suggesting a potential
XABCD pattern playing out $12 targetBBAI is looking like it will play out the XABCD butterfly pattern if it continues to rally from the .382 of the pull back from previous $2.35 lows and 8.73 highs.
Breaking down and close below the $6.06 daily candle will potentially expose the previous consolidation POC at $3.87, which is a .75 pull back.
Using Fib time, I am expecting a $12 range around this year in December.
Will look to open a 7/12 bull call spread at Jan 2027 exp.
The Bullish and Bearish Cases For ETH/USDOverview:
This idea contains both bullish and bearish cases for ETH/USD.
Bullish Case:
ETH/USD has formed a bullish pennant since April 8th. A strong break above the pennant's upper line indicates further upward momentum. The probability of success for a bullish pennant is roughly 54%.
Bullish Case Warning:
Although the bullish pennant is formed, there is a chance the price breaks below its bottom line, which would invalidate it. The bullish pennant is also accompanied by bearish RSI d
ONEUSDT 30M small step towards reversalHarmony (ONE) is once again reminding traders that even modest altcoins can surprise with sudden moves.
After days of sideways action the price finally found support around 0.0098–0.0099 and is now attempting a breakout. The chart shows a wedge compression, EMAs aligning, and the volume profile confirming a buyer’s zone. If the price secures above 0.0102 the door opens towards 0.0107 as the first solid target.
Fundamentally it’s not the star of the show but with crypto market momentum ticking
BNBUSD ShortIt appears Binance Coin buyers are losing momentum, as the butterfly golden level at $868 seems to be fading in appeal.
The market's energy might soon take a pause—perhaps even a longer rest.
Will this downturn be a minor setback or a deeper slump ?
Stay tuned for the unfolding crypto drama!
GBPAUD – Bearish Momentum in PlayFollowing the liquidity sweep observed on August 20th, I’m looking for a potential sell on GBPAUD. The bearish setup aligns with a successfully confirmed daily Harmonic Butterfly pattern, adding confluence to the short bias.
Key Levels:
Entry: 2.09 /2.10
Take Profit 1: 2.0700 – 2.0680
Take Profit 2: 2.0400
Stop Loss: 2.1040
This setup combines price action and harmonic structure, suggesting a high-probability scenario for further downside. I’ll be monitoring lower timeframes for confirmati
GOLD SHORT TRADE VIEWAronnoFX will not accept any liability for loss or damage as a result of
reliance on the information contained within this channel including
data, quotes, charts and buy/sell signals.
If you like this idea, do not forget to support with a like and follow.
Traders, if you like this idea or have your own opinion, please feel free command me.
The End of BTC correction? BTC analysis 2/8/2025In my point of view, BTC has completed its correction and is now ready for a strong upward move, potentially targeting the $137,000–$139,000 range, based on the following factors:
1. Confirmation of the Butterfly Harmonic Pattern
The recent reversal occurred within the expected range of the Butterfly harmonic pattern. Typically, the XD leg in a Butterfly harmonic extends to 1.27, but in practice, this can stretch up to 1.414, which is commonly used as a flexible stop-loss zone. After testing th
RANGING OIL PRICE HEADING FOR RESISTANCE.Price has been stuck in consolidation mode
Currently heading for resistance levels where we expect a decline
Backed-up by a bearish harmonic pattern
and a bear flag clearly visible on the 4HR time interval
BShort
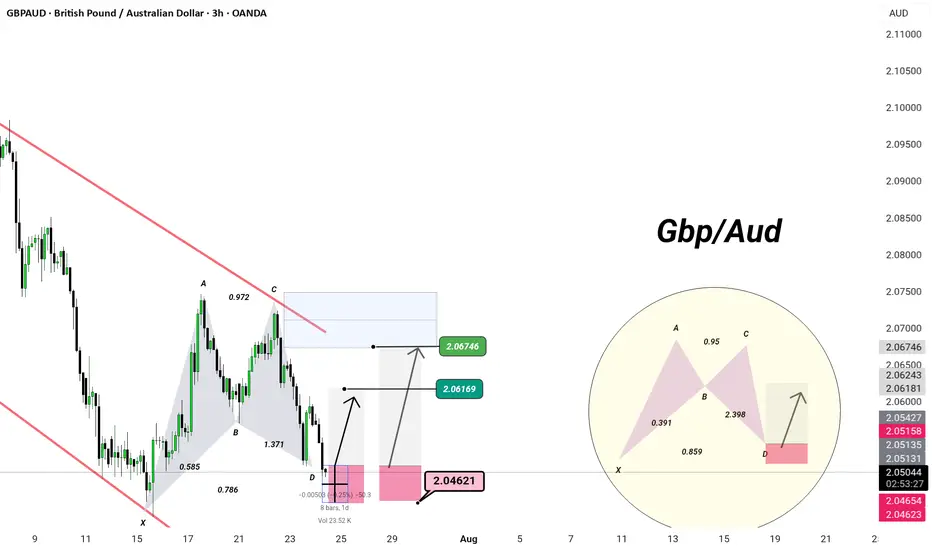
IGBPAUD | 3H Chart | Precision Setup –
🦋 Bullish Harmonic Activation – Deep Zone Precision
When elegance meets geometry — we trade like a Monaco man.
🔺 Pattern: Potential Bullish Bat/Alt Bat
XA → AB → BC → CD
Ideal D-point completion at 2.0462
88.6% XA retracement + 2.0+ BC extension = high-probability reaction zone
🛡️ Demand Zone:
Price is testing the PRZ (Potential Reversal Zone) at 2.0462
Reaction expected → projected targets:
🎯 TP1: 2.0616
🎯 TP2: 2.0674
⚙️ Entry Plan:
Long from 2.0462–2.0465
Invalidation below st
MAJOR MONTHLY SUPPLY ZONE ON GBP/JPY SELLERS INBOUNDRegarding the monthly supply zone, my technical analysis indicates that the price has historically failed to breach this area over several years. I anticipate a potential reversal and recommend waiting for confirmation, such as a double top or harmonic pattern, before initiating a sell position. Furthermore, i will consider selling opportunities upon the .618 Fibonacci level being reached.
Entry: 199.0
Take Profit: 183.3
Overall Price Target: 163.0