The power and simplicity of Camarilla PivotsWhy Camarilla Pivots?
They are simple
They are objective
They give you market context
They provide good levels for trades
They can be used in both ranging and trending markets
The Basics
The Camarilla Pivots system contains the following levels, which are automatically plotted for each session:
H1, H2, H3, H4, H5, H6.
CP
L1, L2, L3, L4, L5, L6.
Each of these pivots carries a specific meaning and can provide important market context.
CP is the center pivot , or close pivot
Camarilla Pivot Points
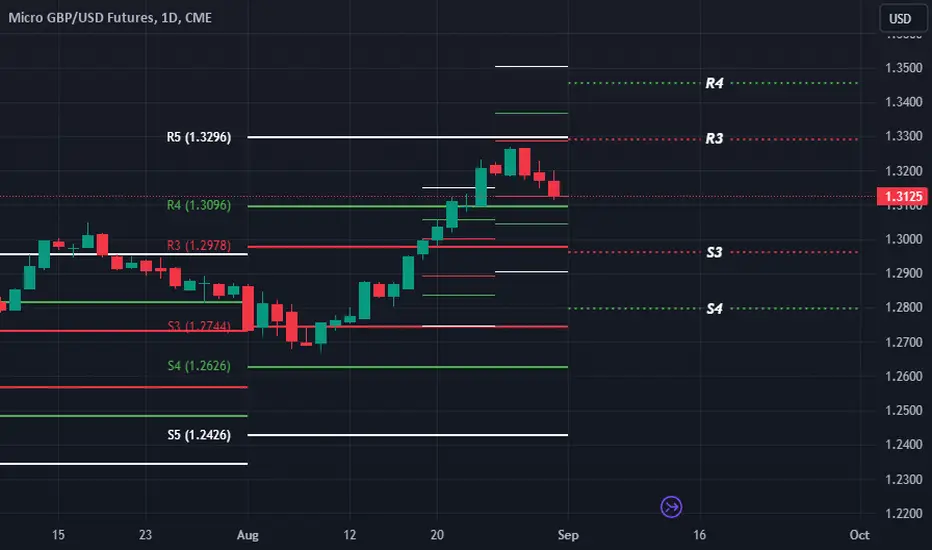
Navigating September 2024: British Pound Trading ForecastAs we approach the close of Q3 2024, key pivot levels on the Camarilla indicator suggest pivotal moments ahead for the British Pound. The currency's performance at these levels could dictate the trading strategy for the upcoming period.
Camarilla Insights and Strategic Levels:
The British Pound reached a significant juncture at the $1.3220 level, identified as the R5 resistance and a prime profit-taking zone during Q1 2024. This level is now expected to serve as a focal point for institutio
Advances Camarilla Concepts (2)Advanced Camarilla Concepts: Mastering Two-Period Relationships
In the sophisticated realm of Camarilla pivot trading, understanding two-period relationships is crucial for discerning the market's directional bias and anticipating movements in upcoming sessions. This analytical approach focuses on the third layer (S3 and R3) of the Camarilla pivots, similar to Pivot Width Analysis, but delves deeper into nuanced market signals across seven distinct types of relationships.
Exploring the Seven T
Advanced Camarilla Concepts (1)Exploring Advanced Camarilla Concepts: The Strategic Role of Pivot Width
In the realm of technical analysis, understanding the nuances of pivot points, particularly within the Camarilla framework, can significantly enhance a trader's ability to forecast and capitalize on market movements. A key aspect often overlooked is the analysis of pivot width, especially the width between the third layers, S3 and R3, which offers crucial insights into impending market dynamics.
Pivot Width Analysis: Deco
Camarilla Pivots: A Guide to Mastering Reversals and BreakoutsIntroduction to Camarilla Pivot Points
Before delving into the personal challenges I've encountered with Camarilla Pivots, and the often stark contrast between theoretical strategies and real-world trading outcomes, it's crucial to lay a foundational understanding of the Camarilla Pivot Points. This will set the stage for discussing the adjustments and solutions I implemented to navigate these challenges effectively.
Understanding the Core Layers of Camarilla Pivots: S3 and R3
Camarilla Pi
Mastering Market Dynamics with Camarilla Pivot PointsIntroduction to Camarilla Pivot Points: A Game-Changing Indicator
Camarilla Pivot Points stand out as one of the most effective leading indicators in the realm of technical analysis. Franklin O. Ochoa's "Secrets of a Pivot Boss" offers a profound exploration of this method, widely used for identifying pivotal support and resistance levels in the financial markets. The book is acclaimed for its clear exposition of complex concepts and actionable strategies that cater to both novice and experien
A Renko Trading Strategy with Multiple Indicators (Update 3)An update from the last summary: Stating the obvious but the recurring pattern did not play out.
This was a painful past couple of days but some realizations that I will walk through here for anyone who may be on a similar journey or realizations.
“Buy high and sell low” or “buy support and sell resistance” are simple words to speak, to walk through in back testing, but, in the heat of the moment with live data and markets unfolding in ways you weren’t expecting make these phrases an near im
A Renko Trading Strategy with Multiple Indicators (update 1)This will serve as an update to the previous discussion specifically to some of the chart settings and the approach.
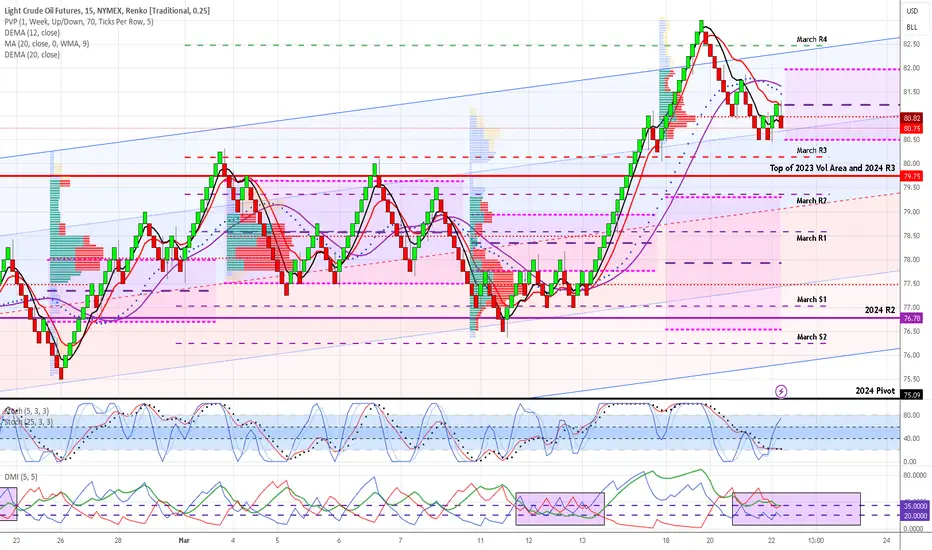
Going into the open on 25-March-2024, I was looking for price to move lower to test the monthly and yearly Camarilla R3. My reasoning was that neither seemed to have been tested yet and that these two together would provide a good level for support. My long term view on crude oil is bullish and I believed this type of action would provide a good entry point.
However, this plan
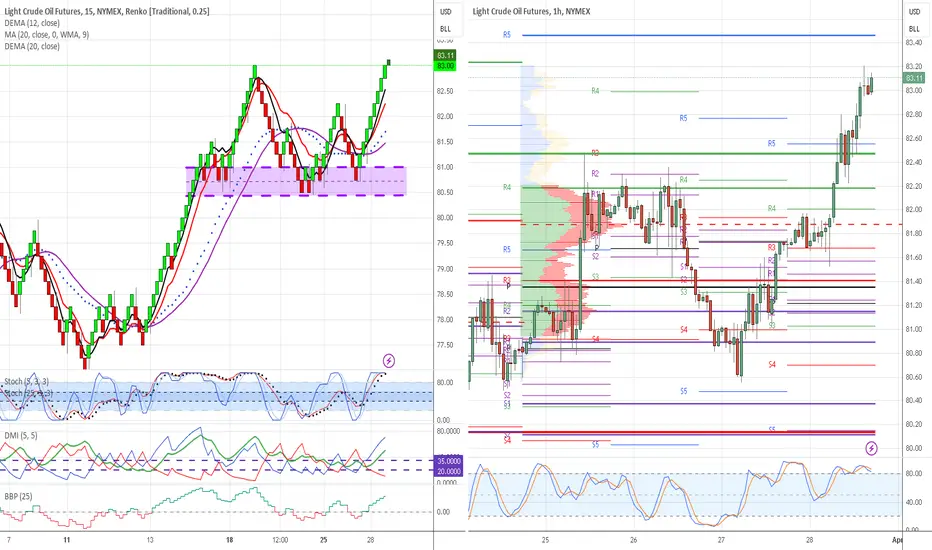
A Renko Trading Strategy with Multiple IndicatorsThis study will walk through several concepts in analyzing crude oil. The primary chart type will be a Renko chart with the block size (ticks) set to 25 (0.25 in TV) and with a timeframe set to 15 minutes. The significance of timeframe is that in TV, it will take this amount of time for the price to maintain a full block change (25 cents) in order for it to be ‘printed’. In times of high volatility, a 15-minute window can allow for more than one block to print at the same time. While this ma
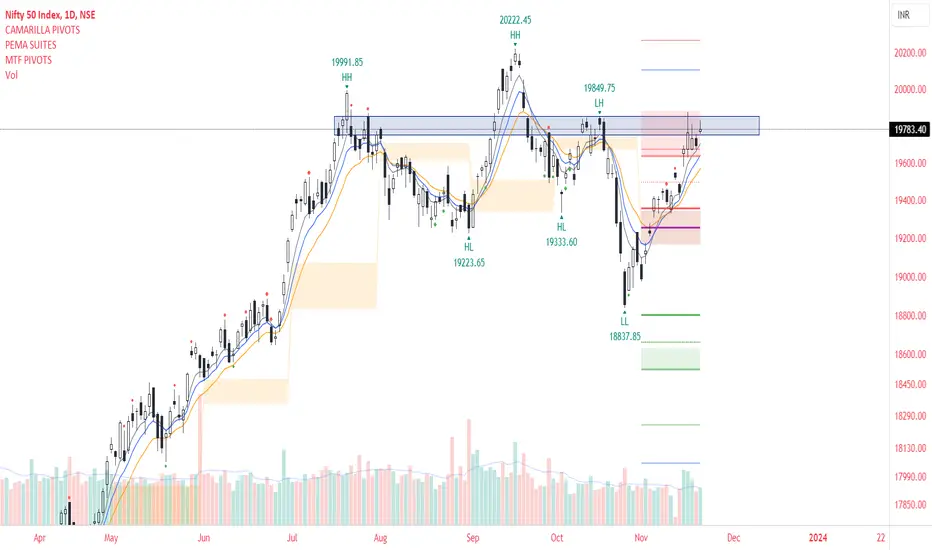
#NIFTY50 - Move ahead.1. Nifty is breached Bearish Golden Pivot Zone (GPZ) and trading above Monthly Cam H4( Bullish Breakout) and traditional pivot level R1.
2. Nifty levels 19751-19851 having very strong supply zone but the good news is Quarterly pivot is at 19695 above this level and past 3 sessions nifty closed above this level. we can say above 19700 is now a very strong support.
3. Volume on daily time frame is increasing and above 13 moving average.
4. If Nifty Daily close above 19888 then we will see new
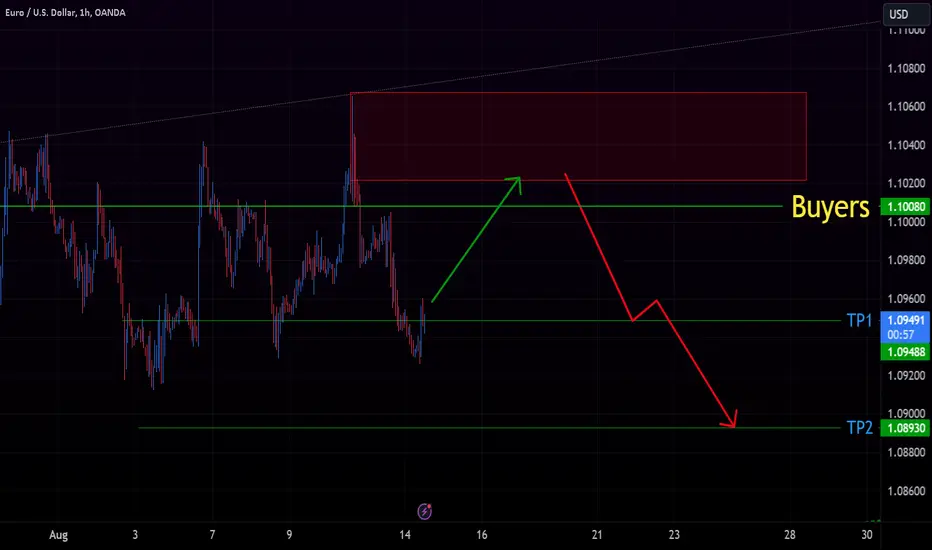
EURUSD levels and trading guide! Currently there are almost more buyers in the market
EURUSD is bearish! In case of any correction we could see a reversal from the level!
Shorter-term traders could enter long positions now. We don't enter!
These are best levels regarding Support and resistance, Channels, Weekly pivots, Buyers and Sellers focus and order_block.
USDJPY AnalysisHello, traders. The support and resistance area of 139 may soon be approached by the USDJPY, which is now in a correction phase. The trend is currently upward. Throughout this and the following trading week, we'll be keeping an eye on USDJPY in case a buying chance presents itself close to the 139 zone.
EURUSD full weekly AnalysisSMA 20 of Daily chart alamost matches with SMA 480 of hourly chart.
SMA20 of daily chart was a great trend detector for the pair recently so I'll use 480 in hourlt chart.
According the SMA20 we are still bullish.
By deeper look at Daily chart a bullish channel could be seen that proves bullish trend. Also a great SNR zone is obviously clear in daily chart.
I think last week was just a correction.
By looking at 1H zone, we could see conflux of mighty SMA480, Camarilla pivot level of S3
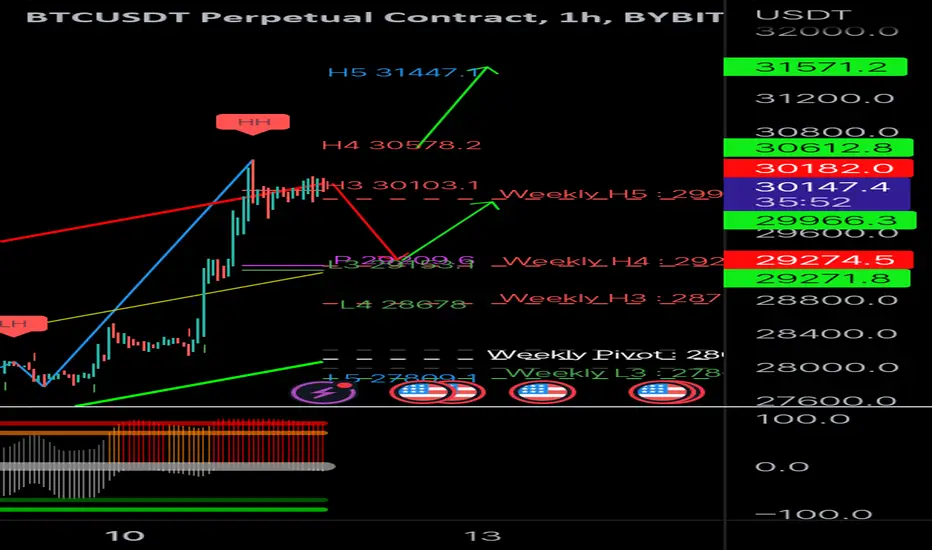
BTC short term. pull back or continuationI could reasonably see a pullback to that daily L3 area or weekly H4. However I think the upwards trend is in tact above that area on a daily closing basis. Also if we take out the previous local high and H4 I could see it taking us higher. this are daily and weekly camarilla pivots
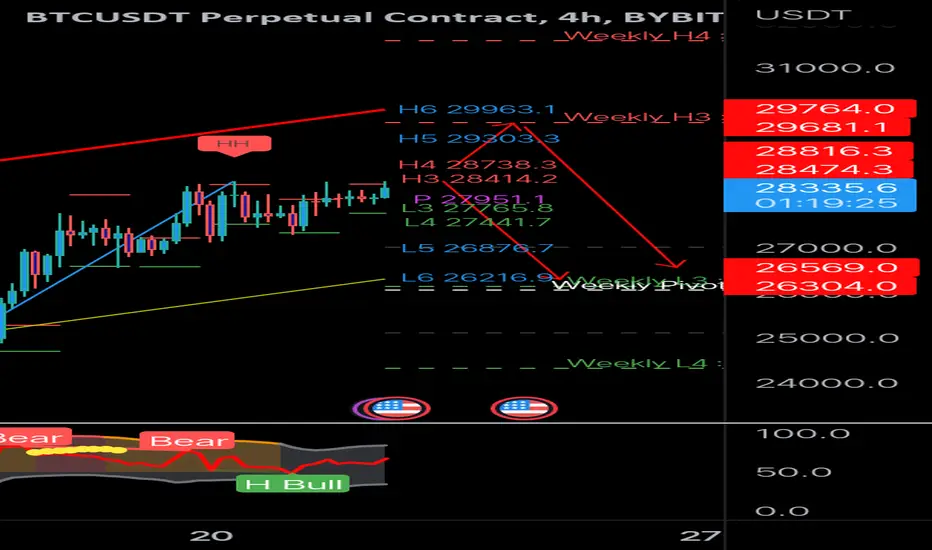
BTC camarilla monthly pivotsSomething interesting to see. compare this month camarilla monthly pivots to last months. also look at the oscillation and divergences. Last month price opened in the middle, went to L3 with bear divergence and then went to H3. So far this month it is doing the exact same thing. What does it mean? it means I would not worry until that L4 is taken out for more doom targets and would not rule out a move to H3 and the possibility that the projected monthly range is respected.
BTC bitcoin monthly camarillaThese levels are important ones imo. It is possible we range between H3 and L3. beyond those we could get stabs to H4 or L4. But with daily closures or strong breaks of H4 or L4 I would look for continuation to H5 or L5 for range breakout targets. These are monthly camarilla pivot points. Right now btc is resting and making support out of the central pivot and cpr (purple levels). I would not even look for short term downside until we break and start closing under that first