 Long
Long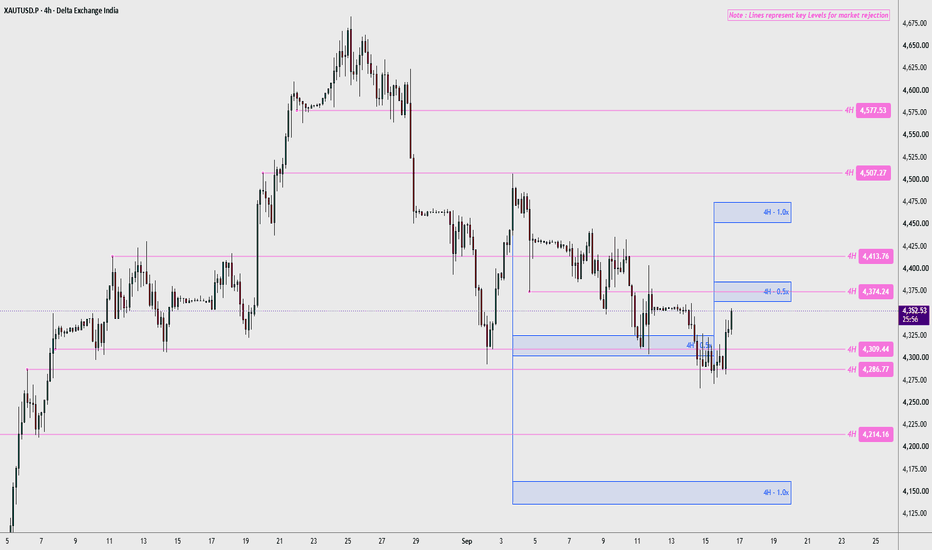
XAUUSD — 4,293 Hold or 4,261 Sweep?
Gold is trading around 4,321 after another weak M30 rotation inside the descending channel.
The short-term bounce has lost momentum below the nearby resistance area, while sellers are still controlling the broader structure under the falling dynamic resistance.
Macro conditions also remain difficult for Gold. Markets are heavily pricing a Fed rate hike this week, Treasury yields remain elevated, and higher oil prices are keeping inflation concerns alive.
But this is also why the lower zones matter.
A bearish trend does not mean price falls in a straight line.
The reaction is the signal.
The simple read
M30 structure is still moving inside a clear descending channel.
Price continues to form lower reaction highs, while the upper channel resistance has repeatedly limited recovery attempts.
The first area I am watching is around 4,293.
This zone sits near the lower channel structure and can create the first buyer reaction if price reaches it with slowing bearish momentum.
However, 4,293 is not an automatic buy.
If sellers push through this level, the stronger support sits around 4,261.
That area combines channel support with visible demand, making it the more important liquidity reaction zone on this chart.
On the upside, 4,340–4,350 is the first short-term resistance.
Above that, the larger 4,398–4,410 area around 4,404 combines supply with descending channel resistance.
That remains the main seller test.
Key price zones
Current price area: 4,321
Short-term resistance: 4,340–4,350
Reaction support: around 4,293
Channel support + demand: around 4,261
Major supply + channel resistance: 4,398–4,410
Bullish pressure improves above: 4,350
Broader recovery improves above: 4,404
Bearish pressure strengthens below: 4,293
Trading plan
Buy reaction scenario
If Gold reaches the 4,293 reaction support:
I will first watch how sellers behave inside the zone.
A clean rejection or strong buyer response may create a short-term recovery toward 4,340–4,350.
But I will not treat the first touch as confirmation.
If 4,293 fails, the deeper 4,261 demand area becomes more interesting.
A liquidity sweep into 4,261 followed by a clear recovery could offer a stronger reaction structure back toward the upper side of the channel.
Sell reaction scenario
If Gold rebounds into 4,340–4,350 and buyers cannot hold above it:
This can remain the first sell reaction area.
Price may rotate back toward 4,293 and potentially the deeper 4,261 support.
Breakout scenario
If Gold breaks 4,350 and holds the retest:
The short-term recovery becomes stronger.
The next important target becomes the descending dynamic resistance, followed by the 4,398–4,410 supply area.
A sustained hold above 4,404 would be the stronger signal that the current M30 bearish channel is losing control.
Breakdown scenario
If Gold loses 4,293 with clean bearish continuation:
I would not chase the breakdown.
The next important reaction area becomes 4,261, where channel support and demand meet.
The M30 trend is still bearish.
4,293 is the first buyer test.
4,261 is the stronger demand test.
4,340–4,350 is the first seller test.
4,404 remains the major resistance decision zone.  Long
Long
Long 
Long 
H1 Reclaim Recovery Below Dynamic ResistanceXAUUSD is trading around 4,332 after another selloff into the lower H1 structure. Price is now testing the 4,330–4,350 Demand / Reclaim Zone, but the broader structure remains capped by the descending dynamic resistance.
The macro environment remains difficult for gold. August U.S. CPI rose 0.4% MoM and 3.4% YoY, reinforcing expectations for a Fed hike this week; markets are pricing roughly an 86% probability of a rate increase. At the same time, Brent has surged above $107 amid renewed Middle East supply disruptions, adding further inflation pressure. The FOMC meets September 15–16, making this a high-volatility week for gold.
Technical View
The H1 structure remains broadly bearish below the descending resistance trendline, but price has reached an important short-term reaction area.
The 4,330–4,350 Demand / Reclaim Zone is currently being tested. If buyers defend this area and produce a bullish MSS, strong rejection or reclaim confirmation, a corrective recovery could develop.
The first upside objective sits around 4,380–4,400, where the descending resistance structure becomes relevant.
Above that, the stronger recovery target is 4,430–4,445, where the marked OB / supply structure aligns with dynamic resistance.
The larger 4,475–4,490 Major Supply remains a higher-timeframe resistance objective and should not be assumed reachable without a confirmed structural breakout.
Key Zones
Current Price: 4,331.700
Demand / Reclaim Zone: 4,330–4,350
Recovery Resistance: 4,380–4,400
OB / Key Resistance: 4,430–4,445
Major Supply: 4,475–4,490
Major Demand / Bullish OB: 4,285–4,305
Major Liquidity / Swing Low: 4,283.319
Trading Plan
Buy Priority: 4,330–4,350
Condition: wait for bullish rejection, liquidity sweep + reclaim, MSS or clear higher-low confirmation from the current demand area.
TP1: 4,380–4,400
TP2: 4,430–4,445
Invalidation: sustained H1 acceptance below 4,330 weakens the immediate recovery setup.
Buy/Sell View
The preferred idea is a confirmed recovery trade, not a blind buy.
Price remains below dynamic resistance and the macro backdrop still favors higher rates, so buyers need to prove control first.
If the reclaim zone fails, the deeper 4,285–4,305 Major Demand / Bullish OB becomes the next important reaction area rather than chasing shorts into support.
Final View
Gold enters FOMC week under strong macro pressure from hot inflation, elevated yields and surging oil, but H1 is now testing an important demand area.
The main scenario is a bullish reaction from 4,330–4,350, targeting 4,380–4,400 first and 4,430–4,445 if recovery momentum expands.
Can buyers defend the H1 reclaim zone before the Fed delivers the next major gold move? Short 
H2 Bullish Recovery From Major Demand
XAUUSD is trading around 4,349 after another volatile session around the lower H2 structure. Price remains inside a broader descending channel, but the current location is close to a major demand cluster where a recovery setup may begin to develop.
The macro backdrop remains challenging for gold. U.S. August CPI rose 0.4% MoM and 3.4% YoY, while core CPI increased 0.3% MoM and 2.4% YoY. Markets now price roughly an 85% probability of a Fed rate hike next week, keeping pressure on non-yielding gold. However, the U.S. 10-year yield eased back toward 4.93% after nearly touching 5%, providing some short-term relief.
Technical View
The broader structure remains below the descending channel resistance, so the recovery is not confirmed yet.
Price is currently holding around the 4,335–4,360 Demand / Reclaim Zone. This area may support a short-term bounce, but the cleaner bullish location remains lower at the 4,275–4,300 Major Demand / Bullish OB.
A liquidity sweep into that major demand followed by a strong reclaim, bullish MSS or higher-low confirmation would support the recovery path shown on the chart.
The first upside obstacle is 4,385–4,405 Resistance / Bearish OB. Acceptance above this area would strengthen the recovery and expose the larger 4,475–4,490 Major Resistance / Supply zone.
Key Zones
Current Price: 4,349.420
Demand / Reclaim Zone: 4,335–4,360
Buy Priority: 4,275–4,300
Resistance / Bearish OB: 4,385–4,405
Major Resistance / Supply: 4,475–4,490
Trading Plan
Buy Priority: 4,275–4,300
Condition: wait for a liquidity sweep into Major Demand followed by bullish rejection, reclaim, MSS or clear higher-low confirmation.
TP1: 4,335–4,360
TP2: 4,385–4,405
TP3: 4,475–4,490
Invalidation: sustained acceptance below 4,275.
Buy/Sell View
The preferred setup is to wait for a deeper pullback into Major Demand rather than chase the current bounce.
Shorts also become less attractive near 4,300 because price would already be entering a major bullish OB. The cleaner decision is to let demand confirm whether buyers can absorb the remaining sell-side pressure.
Important Note
Inflation remains the main macro risk. With CPI and PPI both firm, Fed tightening expectations remain elevated, while oil above $100 continues to reinforce inflation concerns. Any renewed rise in Treasury yields could pressure gold again.
Final View
Gold remains structurally weak, but 4,275–4,300 is the key H2 area where the risk/reward begins to shift toward a recovery setup.
My main scenario is a liquidity sweep into Major Demand followed by bullish confirmation, targeting 4,385–4,405 first and potentially 4,475–4,490 if the recovery strengthens.
Will gold sweep Major Demand before starting the next H2 recovery? Long 
Bitcoin (BTCUSD) — Falling Wedge Inside a Bigger Range, **Bitcoin (BTCUSD) — Falling Wedge Inside a Bigger Range, Targeting a Breakout Toward 81,200+ 🟠**
**Market Structure Overview:**
BTC exploded higher from the 76,000 zone, tapped just above 82,000, then pulled back into consolidation. Since then, price has been carving out a **falling wedge** — a series of lower highs and lower lows that are converging, which is typically a bullish continuation/reversal pattern rather than a bearish one.
**What's happening on the chart:**
🔹 **Falling Wedge Pattern (marked in red):** Price is compressing downward inside two converging trendlines. Falling wedges statistically resolve upward more often than not, especially when they form after a strong impulsive move like the rally from 76K to 82K.
🔹 **Bullish Order Block (~77,600–78,000):** This is the last zone of aggressive buying before the breakout leg to 82K. It's currently being retested as the wedge grinds lower — a natural magnet for price before any reversal.
🔹 **Demand Zone (DZ ~76,400–76,800):** This is the deeper liquidity pool below current price. If the wedge breaks down further instead of holding the Bullish OB, this is the next realistic support to watch — it also lines up with the origin of the original impulsive rally.
🔹 **Target Zone (~81,200):** Marked at the prior high/resistance area. This is the logical target if the wedge resolves bullishly and price reclaims the breakdown level.
**Setup / Signal Breakdown (bottom summary):**
📍 **Primary setup:** Watch for price to tap either the Bullish OB or the deeper DZ, followed by a bullish reaction candle (rejection wick, bullish engulfing, or higher low forming) — that's the long trigger.
📍 **Confirmation signal:** A clean break and close above the falling wedge's upper trendline would confirm bullish momentum is taking over, adding confluence to the long bias.
📍 **Bearish invalidation:** A strong close below the DZ (~76,400) would invalidate the bullish wedge thesis and suggest deeper downside continuation instead.
📍 **Risk management note:** Wedge patterns can extend longer than expected — wait for confirmation rather than anticipating the bounce blindly.
**Bias:** Cautiously bullish while price holds above the DZ, with 81,200 as the primary upside target on confirmation.
---
📚 **This is an educational post only — not financial advice.** Always manage your own risk and confirm setups with your own analysis before trading.
💬 Like/comment/follow if this breakdown added value — more setups coming soon!
#BTCUSD #Bitcoin #Crypto #TradingView #PriceAction #FallingWedge #SmartMoneyConcepts #TechnicalAnalysis  Long
Long
Long 
XAU/USD (Gold) Daily Outlook: Bearish Fractal Symmetry TargetingGold is presenting a compelling daily market structure setup on the 1-Day timeframe. Price action is forming a clear structural reflection of its previous drop, signaling potential downside continuation toward lower key support.
Technical Breakdown
Shooting Star Rejection at Trendline Resistance: The recent move higher tested a descending trendline resistance, forming a strong Shooting Star candlestick on the Daily timeframe around the 4,700.00 region. This highlights aggressive selling pressure and institutional distribution at high prices.
Fractal Measure Symmetry: Looking back at the February-March decline, price made a rapid ~15% drop (-770 pts). The current breakdown setup displays a near-identical measured move projection (~16.5% / -770 pts) originating from the recent high.
Key Support Test: Price is currently retesting a minor horizontal level near 4,365.00. A clean daily closure below this pivot opens the floodgates for a full continuation move toward the primary demand zone.
Primary Target Zone ("Supply/Demand Target"): The ultimate bearish objective aligns with the high-timeframe demand block sitting between 3,880.00 – 3,960.00, where previous major structural accumulation took place late last year.
Trade Setup Signal
Bias: Short / Sell 📉
Sell Zone / Breakout: 4,360.00 – 4,400.00
Stop Loss (SL): 4,720.00 (Above Daily Shooting Star High)
Take Profit 1 (TP1): 4,180.00 (Intermediate Horizontal Support)
Take Profit 2 (TP2): 3,920.00 (Major Daily Demand Zone)
Risk/Reward Ratio: ~1:2.3
Risk Management Note
Keep risk controlled on daily setups. Confirmation on lower timeframes (1H/4H Market Structure Shift) after a retest of broken support can offer a tighter entry and improved R:R.
Disclaimer: This breakdown is provided strictly for educational purposes and is not financial advice. Always trade with proper risk management.
#XAUUSD #Gold #DailyAnalysis #ForexTrading #TradingView #TechnicalAnalysis #PriceAction #SmartMoneyConcepts #MarketStructure Short 
 Long
Long
H1 Bullish Reclaim Toward Upper Liquidity
XAUUSD is trading around 4,430 after recovering from the 4,360–4,375 Major Demand + POI and reclaiming the short-term resistance structure. The latest H1 price action is beginning to shift from bearish delivery into a recovery phase, although the market still faces important supply overhead.
The macro backdrop remains mixed. Friday’s strong U.S. payroll report pushed expectations for a September Fed hike to around 60%, but the U.S. dollar is currently subdued as markets wait for fresh inflation data. Meanwhile, Brent crude has moved above $97 as Middle East tensions intensify, keeping inflation risks elevated and adding another layer of volatility for gold.
The next major U.S. catalysts are PPI on September 10 and CPI on September 11, both released at 8:30 a.m. ET. These reports could materially shift Fed expectations ahead of the September policy meeting.
Technical View
The H1 chart shows a meaningful recovery after price reacted from the 4,355–4,375 Major Demand + POI and formed a higher low.
Price has now pushed back above the 4,400–4,420 Key Reclaim / Resistance area. Holding this reclaimed structure would support another expansion higher.
The first major upside objective sits at 4,470–4,490 Supply / Resistance. Above that, buy-side liquidity near 4,510 becomes the next target.
The broader bullish recovery remains constructive while Major Demand continues to hold.
Key Zones
Current Price: 4,429.700
Key Reclaim / Support: 4,400–4,420
Major Demand + POI: 4,355–4,375
Supply / Resistance: 4,470–4,490
Buy-Side Liquidity: around 4,510
Bullish OB / Major Demand: 4,285–4,305
Trading Plan
Buy Priority: 4,400–4,420
Condition: wait for an H1 pullback into the reclaimed structure followed by bullish rejection, liquidity-sweep reclaim or higher-low confirmation.
TP1: 4,445–4,450
TP2: 4,470–4,490
TP3: around 4,510 BSL
Important Note
Price is already trading above the reclaim zone, so chasing the current recovery offers weaker positioning.
A deeper correction into 4,355–4,375 would still preserve the recovery structure if buyers defend the Major Demand + POI. Sustained H1 acceptance below this demand would weaken the immediate bullish thesis.
PPI and CPI later this week may also create sharp liquidity sweeps before the next clean directional move.
Buy View
The preferred setup is a controlled retest of 4,400–4,420, followed by confirmed buyer response.
If this zone holds, the path toward 4,470–4,490 remains open. Acceptance above supply would then expose the buy-side liquidity resting near 4,510.
Final View
Gold is showing an improving H1 recovery structure after defending Major Demand and reclaiming short-term resistance.
The main scenario is a retest of 4,400–4,420 followed by bullish continuation, targeting 4,470–4,490 first and the 4,510 buy-side liquidity above.
Can buyers defend the reclaim zone before inflation data drives the next expansion? Long 
Long 
USD/JPY: a long into the FOMC window (demand zone)USD/JPY has dropped from 164 and is sitting in a demand zone that has been tested before and held. My reference points:
Entry: the blue zone at ~153.46
Stop: below the zone at ~151.64
First target: 155.29 (1R)
Second target: 157.11 (2R)
The trigger for this one is the calendar, not (only) the chart. This is a setup for the Pre-FOMC window on Wednesday, not a standing trade. If the move plays out into that event, fine, if not, the idea is discarded when the window closes.
Why long USD/JPY specifically: the setup is essentially a short-JPY read through the dollar side. The macro score is currently -4, which reads mildly negative against risk — but the trade is only open for the event window, and that gauge can flip around the meeting. I am not trading a macro call; I am trading a strong technical pattern into a scheduled catalyst, with the position only valid for that window.
The zone is pre-tested and holding. Structure first, event second, guard rails around it.
Educational content only. Not investment advice.
XAGUSD 4H | Pullback Into Order Block Before Potential ContinuatMarket Structure
XAGUSD remains within a broader bullish market structure on the 4-hour timeframe. The chart shows a sequence of higher highs and higher lows, with multiple breaks of structure (BOS) confirming the upside progression.
Price recently pushed into the weak high / liquidity area near the recent peak and then produced a strong bearish displacement. This suggests that the immediate focus is now on the downside retracement and how price reacts around the marked demand areas.
Key SMC & Price Action Zones
Supply Zone: 70.20 – 71.20
This area contains the recent weak high and potential buy-side liquidity. Price has already reacted sharply from this region, making it an important reference point for any future upside continuation.
Order Block / FVG: 63.40 – 64.50
The first key reaction zone below current price. A retracement into this imbalance and order-block area may provide important information about whether buyers are still defending the broader bullish structure.
Demand Zone: 61.20 – 62.70
This is the deeper support area. If price moves through the first reaction zone, this region becomes the next important area to watch for a potential bullish response.
Possible Scenario
The current bearish move may continue toward the Order Block / FVG, where price action can be monitored for a potential reaction. A sweep into the zone followed by bullish confirmation could support a continuation back toward the previous highs.
A deeper retracement into the Demand Zone would still be consistent with the broader bullish structure, provided price does not show sustained bearish acceptance below the key structural support.
What to Watch
Bearish momentum as price approaches the 63.40–64.50 reaction zone
Liquidity sweep or rejection inside the Order Block / FVG
Lower-timeframe CHoCH or BOS as confirmation of a potential bullish response
A deeper move toward 61.20–62.70 if the first zone fails to hold
Previous highs and nearby buy-side liquidity as a possible upside reference
Overall Bias: Broader bullish structure, with a short-term bearish retracement currently in progress. The next directional clue is likely to come from the reaction inside the marked SMC zones.
This idea is based on market structure, liquidity concepts, Fair Value Gaps, order blocks, and price action. It outlines possible scenarios rather than guaranteed outcomes Long 
XAUUSD H1: Bullish Structure Shift & FVG Retest in FocusGold has transitioned from a clear bearish structure into a potential bullish market-structure phase
After the decline into the 4,280–4,300 demand area, price formed a strong recovery and produced a CHOCH, followed by bullish displacement. The subsequent structure suggests that buyers have gained short-term control
Price is now retracing toward the 4,365–4,400 FVG zone, making this area important for monitoring how price reacts
🔎 Key Levels
Current price: ~4,430
FVG: ~4,345–4,368
Key demand: ~4,280–4,300
Previous swing area: ~4,480–4,500
BSL: ~4,637
Higher BSL: ~4,690
📈 Bullish Scenario
If the FVG holds and price establishes bullish confirmation on a lower timeframe, the next areas of interest would be the previous swing high and potentially the 4,637 BSL.
The idea remains conditional: a reaction from the FVG is more meaningful than simply assuming the zone will hold
⚠️ Bearish Invalidation
A sustained breakdown through the bullish structure and especially the 4,280–4,300 demand area would weaken the current bullish thesis and suggest that the broader bearish pressure may be returning
Educational market analysis only. This is a scenario-based interpretation of price action, not a guarantee or investment advice. Always consider your own risk management Long 
CAT: Excavator digs for bottom. Found it?NYSE:CAT
It seems Caterpillar is getting ready to build not just data centers, but also new all-time highs in our brokerage accounts.
On the industrial horizon, one of the cleanest reversal setups of the year is taking shape. CAT shares have completed a large-scale correction from the all-time high of $1,073.46 and are approaching the most important point of the cycle. The chart is forming a classic potential double bottom pattern right at the 200-day moving average, the primary long-term reference for institutional capital.
The first bottom in July at $776, a local bounce to $934, and then a second bottom in early September at $771 — a precision liquidity sweep just $5 below the July low, followed by a strong impulsive reaction to the upside. The pattern will be confirmed on a break above the neckline at $934 on elevated volume. Until then, the scenario remains potential.
The most interesting part is happening in the fundamentals. On August 4, Caterpillar posted a historic earnings report: revenue exceeded $20 billion for the first time in a single quarter, adjusted EPS of $8.17 beat consensus by 31.99%, and backlog reached a record $72 billion, growing 92% year-over-year. Following such a report, institutional capital has been methodically accumulating positions on the correction, visible through the character of the decline on diminishing volume.
This technical setup is perfectly synchronized with the company's real business. On September 2, Caterpillar announced a partnership with FieldAI to deploy physical AI and autonomous systems on construction sites using NVIDIA technology. The Power & Energy segment grew 72% quarter-over-quarter on the data center construction boom. CAT is no longer a cyclical industrial player — it is a key infrastructure player in the AI era. Management raised full-year revenue guidance to mid-to-high teens and increased the quarterly dividend to $1.63 per share.
Current levels around $813.94 look optimal for positioning. The first target is $912.66, a profit-taking zone. The global target is $1,046.53, returning the asset to pre-correction levels. The scenario would be invalidated by a daily close below $755, where the MA200 loses its role as support. The industrial sector has no mercy for over-risking — we enter strictly by the system.
This publication is for analytical purposes only and does not constitute individual investment advice. Share your thoughts in the comments and don't forget to support the idea with a like if you found the analysis useful! SUPPORT & RESISTANCE — THE FOUNDATION OF PRICE ACTIONSupport and Resistance are two of the most important concepts in technical analysis and price action trading. They help traders understand where price may react, reverse, consolidate, or break out.
🟢 WHAT IS SUPPORT?
Support is a price area where buying pressure becomes stronger than selling pressure.
When price reaches a support zone, buyers may step in and push the market higher.
A support level can be identified when price reacts from the same area multiple times.
What to look for:
🔹 Previous swing lows
🔹 Multiple price reactions
🔹 Strong bullish rejection
🔹 Higher lows forming around the zone
🔹 Increasing buying momentum
🔴 WHAT IS RESISTANCE?
Resistance is a price area where selling pressure becomes stronger than buying pressure.
When price reaches resistance, sellers may enter and push the market lower.
A resistance level becomes more meaningful when price rejects the same area multiple times.
What to look for:
🔸 Previous swing highs
🔸 Multiple rejections
🔸 Strong bearish candles
🔸 Lower highs forming around the zone
🔸 Increasing selling momentum
📈 HOW DO WE TRADE SUPPORT?
When price approaches support, don't automatically buy just because price touched the level.
Wait for confirmation.
A possible bullish setup:
Price → Support → Rejection → Bullish confirmation → BUY
Confirmation can include:
✅ Bullish engulfing candle
✅ Strong rejection wick
✅ CHOCH / BOS
✅ Higher low formation
✅ Strong bullish momentum
Stop Loss: Below the support zone or recent swing low.
Take Profit: Previous high, resistance, or the next liquidity area.
📉 HOW DO WE TRADE RESISTANCE?
The same principle applies to resistance.
Don't automatically sell just because price touches resistance.
Wait for confirmation.
A possible bearish setup:
Price → Resistance → Rejection → Bearish confirmation → SELL
Confirmation can include:
✅ Bearish engulfing candle
✅ Strong rejection wick
✅ CHOCH / BOS
✅ Lower high formation
✅ Strong bearish momentum
Stop Loss: Above the resistance zone or recent swing high.
Take Profit: Previous low, support, or the next liquidity area.
🔥 WHAT IF SUPPORT OR RESISTANCE BREAKS?
A level is not guaranteed to hold.
When price breaks through support or resistance with strong momentum, the old level can sometimes change its role.
Support breaks ↓
Support → Breakout → Retest → Resistance
Resistance breaks ↑
Resistance → Breakout → Retest → Support
This is commonly called a Support/Resistance Flip.
🧠 THE BIGGEST MISTAKE
❌ Don't trade every touch.
Instead:
LEVEL → REACTION → CONFIRMATION → ENTRY → RISK MANAGEMENT
Price can temporarily move through a level, take liquidity, and then reverse. That's why confirmation and risk management are important.
KEY RULE
Support tells us where buyers may become active.
Resistance tells us where sellers may become active.
But price action confirmation tells us whether the level is actually being respected.
Study the reaction, not just the level.
Educational content only — not financial advice.
SUPPORT & RESISTANCE — HOW TO IDENTIFY, TRADE & CONFIRM KEY LEVELS 📈📉
#PriceAction #SupportAndResistance #TradingEducation #TechnicalAnalysis #ForexTrading #SmartMoney #MarketStructure #TradingView #ForexEducation #ReubenMiles Education 
 Long
Long
 Long
Long
Does the Rally-Base-Rally Structure Still Matter on the Revisit?XAUUSD is currently near an identified demand zone . This technical area is being observed because it originated from a strong price imbalance following a Rally-Base-Rally (RBR) structure.
Why is this area technically significant?
The zone represents an area where price previously paused, formed a relatively defined base, and was followed by a strong upward leg. From a market-structure perspective, this sequence can indicate a notable imbalance between buying and selling activity during that earlier phase.
Several characteristics make this particular area relevant for technical observation:
• Fresh zone: The area has not yet been significantly revisited since its formation.
• Strong leg-out: Price moved away from the base with notable momentum, creating a visible imbalance.
• Quality basing structure: The base preceding the move provides a relatively identifiable structural area for analysis.
• Multiple-timeframe context: The significance of a zone can change depending on how the surrounding market structure appears across different timeframes. Observing the broader structure alongside the 4H chart may provide additional context.
What might happen when price revisits such a demand zone?
A revisit to a demand zone does not automatically imply a particular future direction. Traders often observe how price behaves within and around the area to understand whether the earlier imbalance is still being respected.
One possible scenario is that price may show a reaction from the zone, accompanied by changes in short-term market structure or momentum. Another possible scenario is that price may move through the area, suggesting that the zone is no longer being respected in the same way.
For example:
• If price shows rejection and develops supportive price-action structure around the zone, it may indicate that the area remains technically relevant.
• If price spends significant time moving through the zone or breaks below its underlying structure, the demand zone could become weakened or invalidated.
• Price may also consolidate within or around the area before establishing a clearer directional structure.
The importance of confirmation and invalidation
The presence of a fresh Rally-Base-Rally demand zone is only one component of technical analysis. Price-action confirmation can provide additional information about how the market is responding when price interacts with the area.
Zone invalidation is also possible and should be considered when analysing any supply-and-demand structure. A zone that previously produced a strong move may not necessarily produce the same market behaviour on a later revisit.
From an educational risk-management perspective, market participants often define invalidation conditions before evaluating a market scenario. The purpose of such planning is to understand when the original technical premise may no longer be valid rather than assuming that a historical zone must continue to hold.
The broader technical question
The key observation is not whether the zone must produce a reaction, but how price behaves as it interacts with the structure.
Will the historical imbalance remain visible in current price action, or could the revisit lead to a deeper move through the zone? The developing market structure and price-action confirmation may provide further technical context.
This publication is intended solely for educational and informational purposes. It reflects a technical analysis of market structure and should not be interpreted as investment advice, a recommendation, or a solicitation to buy or sell any financial instrument. Always perform your own analysis and manage risk according to your individual circumstances. Long 
XAUUSD 4H — Reaction From H4 FVG Could Define the Next Leg MarkGold has experienced a strong bearish displacement from the 4,600 area into the 4,300–4,320 region. Price is now approaching a previously identified H4 Fair Value Gap (FVG), with a deeper H4 Order Block (OB) below it.
Technical view
Current price: ~4,322
H4 FVG: roughly 4,275–4,305
H4 OB: roughly 4,220–4,260
Upside liquidity: around 4,625 and 4,695
The recent sell-off has created a significant imbalance, so the FVG/OB area is important for assessing whether buyers can regain control.
The LQ sweep near the recent low adds confluence, but confirmation is still required.
Bullish scenario
If price retraces into the 4,275–4,305 FVG and shows a clear bullish reaction, the area could act as support. A sustained recovery above the nearby structure would strengthen the case for a move toward the 4,625 liquidity level, with the higher 4,695 area as a secondary objective.
Invalidation / bearish scenario
If price decisively breaks and holds below the H4 OB around 4,220–4,260, the bullish thesis would lose strength and the market could continue its broader bearish structure.
Key idea: Rather than assuming an immediate reversal, I would watch how price behaves inside the H4 FVG/OB zone. The reaction there should determine whether this is a retracement opportunity or continuation of the bearish move.
TradingView-safe note: This wording focuses on chart analysis, reasoning, conditional scenarios and invalidation rather than presenting a guaranteed result or a bare “BUY/SELL” call. TradingView specifically recommends explaining why the view exists and what would invalidate it; it also prohibits promotional content and after-the-fact ideas.
Suggested title
XAUUSD 4H: H4 FVG Reaction Could Shape the Next Move
Suggested TradingView description — ready to paste
Gold is currently trading near an important H4 imbalance after a strong bearish displacement from the 4,600 area.
The H4 FVG around 4,275–4,305 is the first area I am watching for a potential reaction, while the H4 OB around 4,220–4,260 represents a deeper support zone.
If price respects the FVG/OB area and develops bullish confirmation, attention could shift toward the upside liquidity around 4,625, followed by the 4,695 region.
A sustained break below the H4 OB would weaken this bullish scenario and suggest that the bearish structure remains dominant.
For now, the reaction around these H4 zones is more important than anticipating the direction prematurely Long 


