Light Crude Oil OverviewsCrude oil prices have rebounded from the recent low around $55 and are currently trading in the mid-$66 range. Prices are clearly holding above the 200-day simple moving average (around $62.4), indicating that the medium-term trend is shifting from a downtrend toward a neutral to recovery phase.
The volume profile (VRVP) shows a thick concentration of traded volume in the $60–70 range, suggesting this zone serves as a strong supply-demand support area. On the other hand, $70 represents a key psychological and technical resistance level, where prices have frequently pulled back in the past. If this level is broken decisively with increased volume, there is room for a rebound toward the $80 area.
From a seasonal perspective, crude oil tends to be relatively firm from early in the year through spring. In the short term, as long as prices remain above $62–64, buying on pullbacks remains the dominant strategy, with the ability to break above $70 being the main focus going forward.
In addition to the technical analysis, fundamentals also suggest that, amid rising international geopolitical tensions, crude oil prices may have transitioned into a long-term bullish trend above the $70 level.  Long
Long
 Short
Short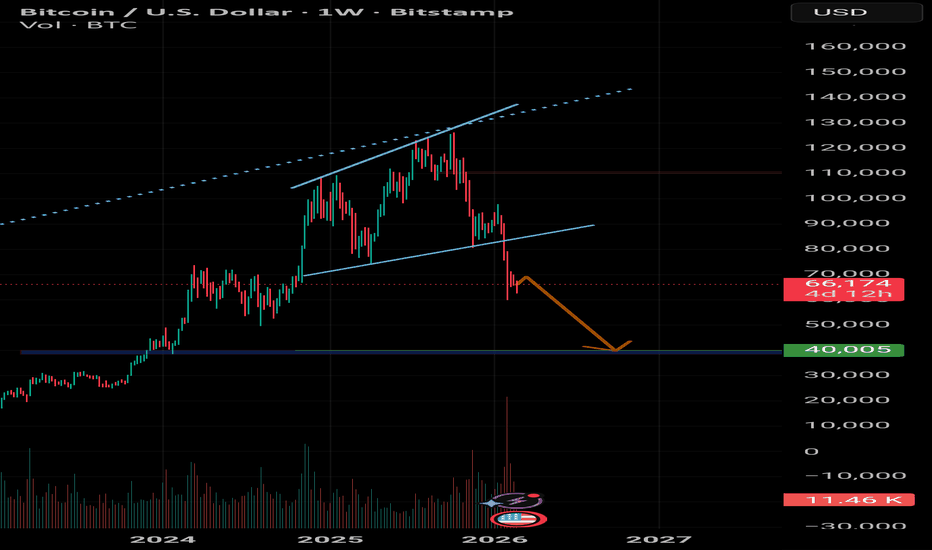
Long 
Bearish outlook for Bitcoin!Bitcoin Cycle Analysis and Trade Thesis
For more than a decade, Bitcoin has evolved through recurring cyclical patterns, consistently respecting long-term moving averages and two logarithmic regression curves — one defining market peaks and the other defining troughs. I expect this structural behavior to persist over the coming years.
On Friday, as INDEX:BTCUSD briefly topped 123,000, I initiated a bear put spread on NASDAQ:IBIT (50/45 strike), expiring January 2026.
Target: BTCUSD ≈ 70,000.
If this target is not reached by late 2026, I will close the position regardless of price.
Bearish Counterpoints
“Never trade against the trend” — Bitcoin has remained structurally bullish since inception.
“No parabolic top” — Historically, bear markets have emerged only after parabolic blow-offs, which are not currently visible.
“No fundamental trigger” — Major bear phases have often begun with clear catalysts (e.g., Mt. Gox invalid transaction issues, Mt. Gox collapse, China’s mining ban…), none of which are present now.
I admit it feels somewhat awkward to go short while everyone else is buying.
But in trading, profit often comes from being contrarian — buying near the bottom when fear dominates, and selling near the top when euphoria takes over.
And one last thought: even if I believe crypto will still exist in 50+ years — stablecoins, for example, are undeniably useful for fast money transfers and cross-border payments — I expect many of the most speculative assets to trade far closer to zero than to today’s prices.
Bitcoin, along with others tokens, remains, in my view, vastly overvalued.
Short 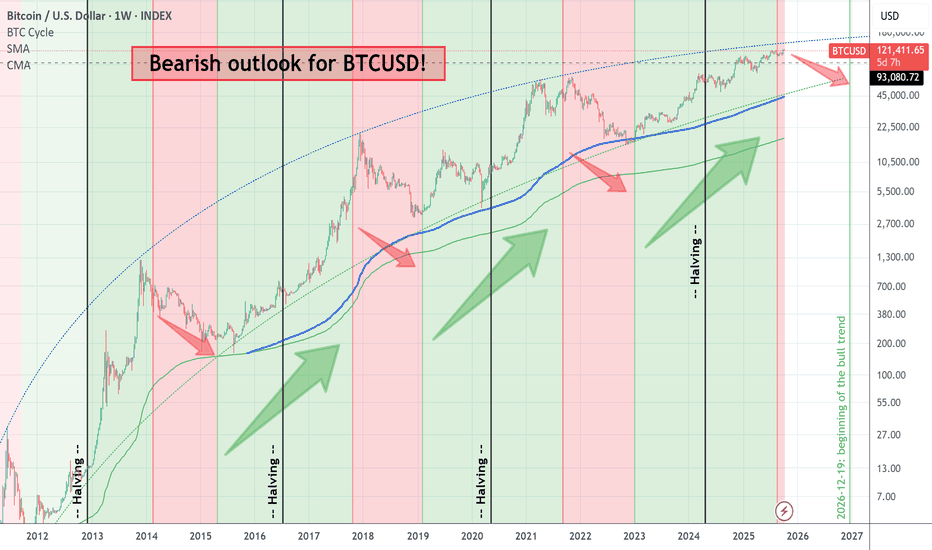
COT Report: Uncovering the "New Crop" SignalHow to Refine COT Analysis Using Term-Structure Alignment ("New Crop" Signal)
Most traders who use the Commitments of Traders (COT) report focus only on the aggregated Commercial net position from the Legacy combined report. While this provides a broad view of positioning, it blends all contract months together and hides how risk is distributed across the forward curve.
In this tutorial, we explore a more granular approach: comparing the standard Legacy Futures – Total Positions data with the Legacy Futures – Other Positions (New Crop) data to identify positioning alignment across delivery cycles.
What You Will Learn:
Why aggregated COT positioning can mask curve-specific behavior.
How deferred (New Crop) positioning differs structurally from total positioning.
How alignment across both segments can highlight positioning saturation.
1. The Limitation of Combined COT Data
The standard Legacy COT report aggregates all contract months into a single total. In agricultural markets, this means old-crop and new-crop contracts are blended together.
Because Commercials hedge across the entire forward curve, the combined net position may smooth out important shifts occurring specifically in deferred delivery months.
As a result, the aggregate index can:
React slower,
Show broader basing patterns,
Mask concentrated positioning in specific crop years.
2. The Structural Role of New Crop Contracts
In agricultural markets such as Soybean Meal or Lean Hogs, new-crop contracts represent a distinct production cycle.
Positioning in these contracts reflects:
Forward production exposure,
Deferred inventory hedging,
Risk transfer tied to the next supply cycle.
Because new-crop open interest is typically smaller than the full aggregated market, positioning shifts in this segment can appear sharper and reach statistical extremes faster than the combined report.
This does not necessarily imply directional forecasting - rather, it reflects curve-specific risk concentration.
3. The Alignment Framework
Instead of using New Crop data as a standalone signal, the focus is on confluence .
Setup:
Monitor the Legacy Commercial Index (e.g., 13- or 26-week normalization).
Simultaneously monitor the Legacy "Other Positions" (New Crop) Commercial Index.
Identify moments when both indices reach historical extremes simultaneously.
When both the aggregate positioning and the deferred-cycle positioning reach extremes together, this indicates broad positioning saturation across the forward curve.
Why This Can Matter:
When risk transfer is concentrated across both front and deferred months:
The commercial side may already be heavily hedged.
Marginal hedging pressure can diminish.
The market may become vulnerable to reversal if positioning becomes crowded.
In practice, the New Crop index often reaches extremes earlier because it represents a smaller and more cycle-specific segment. This can make it appear to "lead" the aggregate index, though this effect is structural rather than predictive by itself.
Example Application: Soybean Meal
On the weekly Soybean Meal chart, observe:
The New Crop Commercial Index frequently reaches extreme readings before or at major price inflection points.
The aggregated Legacy index may confirm shortly after.
Major turning points often coincide with alignment between both indices.
Filtering setups to require alignment between total and deferred positioning may help isolate higher-quality positioning extremes compared to using the combined report alone.
Disclaimer: This framework analyzes positioning structure, not forecasting intent. COT data should be integrated with broader market context, including seasonality, term structure, and price structure analysis.
 Education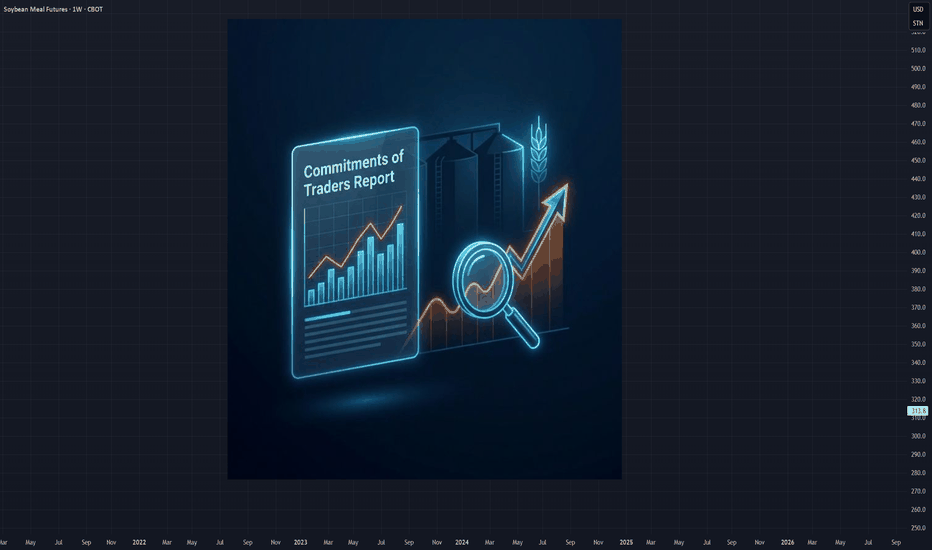
 Long
Long
Gold (XAUUSD) Signals Wave C BreakoutGold has completed a 7-swing corrective decline in wave B at 4838 and has since turned higher, signaling the start of a new impulsive sequence in wave C. The reaction from 4838 was decisive, suggesting that the correction has likely ended and buyers have regained control of the short-term trend. Within wave C, we have already seen a clear five-swing advance in wave ((i)), confirming the impulsive nature of the move higher. Following that advance, the market is now correcting in wave ((ii)). At this stage, wave ((ii)) may have already completed; however, there remains a possibility of one more marginal low between 4966 and 4937 to complete a three-swing pullback from the recent peak.
As long as price remains above the wave B low at 4838, the overall outlook continues to favor further upside. The next key objective stands at 5339, which represents equal legs measured from the 4402 low. Reaching that area would complete the larger corrective sequence in proportional symmetry.
In the near term, pullbacks are expected to remain corrective, with wave C projected to extend higher toward the 5339 target. The broader structure supports continued upside while holding above critical support at 4838  Long
Long
QQQ - Still Respecting the Range - Trade idea ***
As I mentioned in my previous post, since October QQQ has been trading inside a broad lateral range.
Different headlines.
Same structure.
Right now I don’t have a bullish bias.
I don’t have a bearish bias either.
What I see is range.
We recently swept liquidity near the 590–593 area and price is still respecting that broader structure. Tech looks slightly stronger short term, but not enough (in my opinion) to justify strong directional conviction.
In this environment, range strategies make more sense to me than directional bets.
For the first time on this channel, I’m considering an Iron Condor on QQQ.
Levels I’m working with:
• 585 on the downside
• 635 on the upside
(14 days to expiration)
As long as price stays inside that zone, the idea works.
The setup is offering around ~31% return on risk if held to expiration. That said, I rarely hold trades that long. If I see 10–15% profit, I usually take it and close early.
When markets are choppy, I prefer shorter duration exposure. I normally trade 1–2 months out, but in range conditions I don’t like giving price too much time to create unnecessary risk.
It’s important to remember that options trading is generally considered intermediate to advanced. Before taking any position, make sure you fully understand the strategy, the defined risk, and how options pricing works. Risk management always comes first.
No predictions.
Just structure and probabilities.
This is simply part of my trading framework and how I adapt to current conditions.
If you have questions about the setup or want to understand my process deeper, feel free to reach out. I answer every message personally and always free. Your feedback helps me improve, and we all learn in the process.
Likes and comments are appreciated.
Journal entry. Not financial advice.
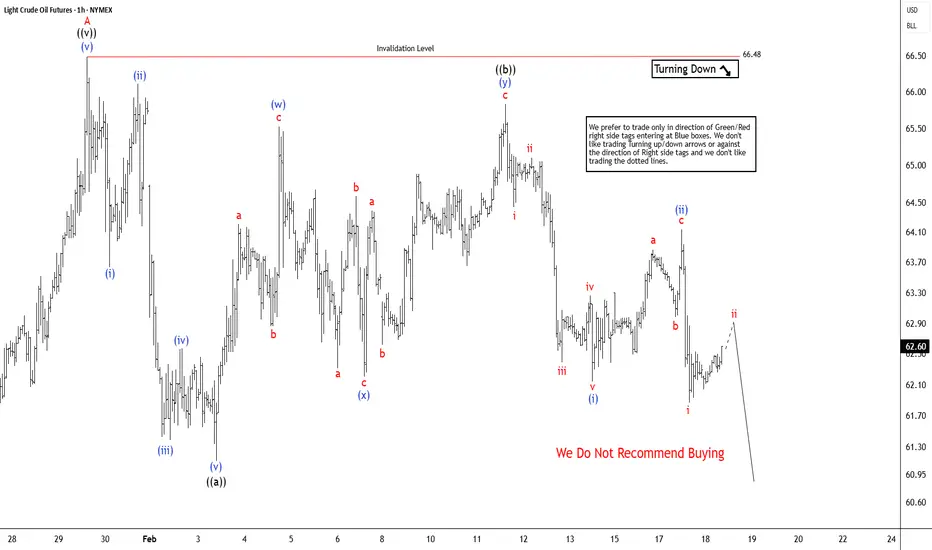
777bLESSTrading CL #F Elliott Wave Analysis: Extending Lower Toward 60.50Elliott Wave Crude Oil Futures CL #F have turned lower in a corrective zigzag pattern at the moment where wave ((a)) unfolded in 5 waves at 61.12 low. Up from there, wave ((b)) peak unfolded in lesser degree 7 swings structure at 65.83 high. And are now progressing through wave ((c)) to the downside. Within this structure, waves (i) and (ii) appear complete, and price has started to accelerate lower in wave (iii). Wave (iii) is expected to extend toward the 60.50 area, which represents equality with wave (i). This level serves as the next key downside target as bearish momentum builds. As long as the structure remains impulsive, further weakness is favored in the near term.
After reaching 60.50, we anticipate a corrective bounce in wave (iv), likely unfolding in at least three swings before sellers re-emerge in CL #F. Following that bounce, another leg lower in wave (v) should complete the five-wave sequence within the broader ((c)) structure.
The overall downside target for this corrective cycle in wave B is projected in the 60.50–57.20 range. Until the structure changes, rallies are expected to remain corrective, with the path of least resistance staying to the downside. GME Solid: The Phantom Pain: Overhead Supply & Monthly StructurePre-requisite Reading:
Preface:
I have many drawings on GME (AVWAPs, fibs, channels, SnD zones, trendlines, etc.). What I’m choosing to show here is intentional: a single framework that best illustrates the macro regime behavior I see.
This is not a predictive chart and not financial advice. I’m not here to tell anyone what GME will do next — I’m documenting regimes, acceptance, and recurring behavior.
Structure
This channel framework is built from fib channel bands, with lines color-coded to match my fib legend.
The correlations between these channel rails/centerlines and the fib bands were not planned. They are not perfect, but they are consistently close enough to be useful as a structural reference.
Band / Quadrant Map
0.114 (Blue): centerline of Quadrant 1
0.236 (Red): upper boundary of Quadrant 2 / below this begins Quadrant 2
0.382 (Light Green): approx. centerline of Quadrant 2
0.500 (Medium Green): lower boundary of Quadrant 2 (below this begins Quadrant 3)
0.618 (Yellow): approx. centerline of Quadrant 3
(Quadrants are simply the two sub-channels divided by their centerlines.)
Behavioral Repeat
The two thick white “Phantom Pain” trendlines highlight a recurring pattern: after GME rejects Quadrant 1, price continues to make descending acceptance tests in Quadrant 2 — as if overhead supply is “felt” repeatedly over time.
This is visible post-2021 and again post-2024, with similar slopes (~-25° vs ~-22°).
Momentum Confirmation
The 2024 impulse was materially weaker than 2021. Monthly RSI hit ~96 in 2021, while 2024 barely reclaimed the midpoint.
Post-2024 strength also produced RSI/price divergence, followed by continued weakening.
RSI is currently below its EMA, and volume continues to decline.
Current Context
Price is drifting toward the 0.382 band, which has historically been a key acceptance boundary in this framework.
Tradability/Risk-Reward:
I’m not predicting a breakdown — GME can change regimes abruptly — but based on this macro structure, the risk/reward here is not attractive in either direction.
This is not just a poor long location: it’s also a poor short location and a poor volatility-harvesting location. At these levels, price is positioned where extended chop or a sharp displacement in either direction is possible, and the structure does not provide clean entry/exit efficiency.
As an example: if you sold covered calls in the ~$25 area, this is the type of location where I’d be looking to buy-to-close and lock gains. Likewise, if you bought ATM puts in that same area, this is the type of location where I’d be taking profits, not pressing for continuation.
Personal Regime Triggers
Bullish trigger: I need monthly acceptance above 0.382 plus RSI reclaiming its EMA and holding above 50, and a break/acceptance above the descending supply trendline on a timeframe higher than daily. For this current month, I’ll allow a deep wick lower as long as the body closes above 0.382.
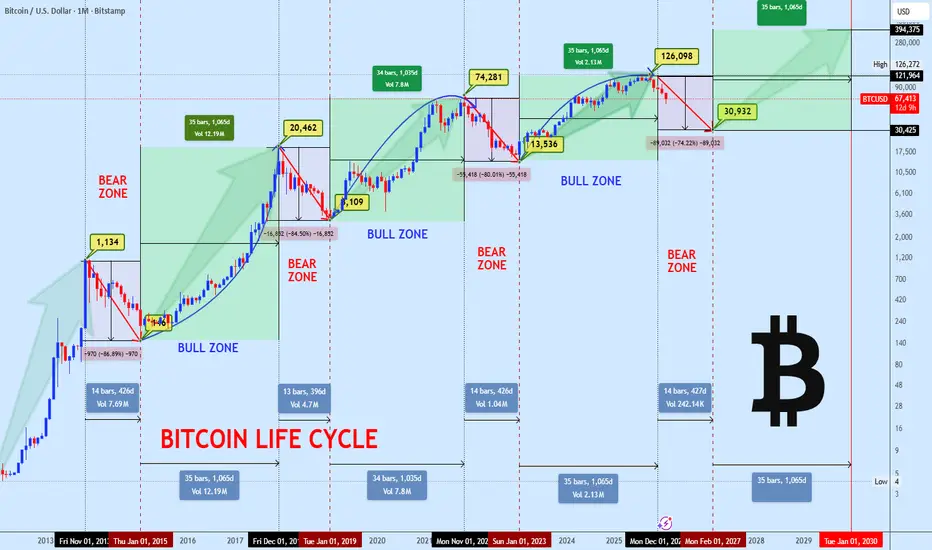
Bearish trigger: A monthly body close below 0.382 is enough for bearish confirmation — especially if there’s no constructive demand response from the 0.5 / 0.618 bands afterward(Wicks). BITCOIN MACRO UPDATE LIFE CYCLE, STRUCTURE & PRICE LEVELSIt is timely to revisit the typical crypto market cycle, as Bitcoin continues to respect it with remarkable precision.
The macro top was confirmed in October, when BTC tested the $126,000 zone, marking the current cycle ATH. Since that rejection, price has transitioned into a prolonged consolidation phase, which structurally aligns with the early stages of a broader bear market cycle.
From a wave structure perspective, price action is developing an extended corrective formation (ABC). The initial decline from $126K to the $59K region completes Wave A. Current market behavior suggests a potential Wave B recovery toward the key supply and resistance band around $84,800–$90,000, where sellers are expected to reassert control.
Failure to reclaim and hold above this supply zone would likely trigger Wave C, with downside continuation toward the $34,000–$30,000 projected target area. This zone aligns with historical demand, prior cycle accumulation, and long-term value based interest making it a critical region for strategic accumulation, not panic.
Cycle analysis indicates that this corrective phase may extend into early 2027, setting the stage for the next major accumulation and recovery phase. While short- to mid-term volatility and downside risk remain valid, the broader macro structure continues to support higher prices long term, with expansion potential toward $200,000+ once the cycle reset completes.  Short
Short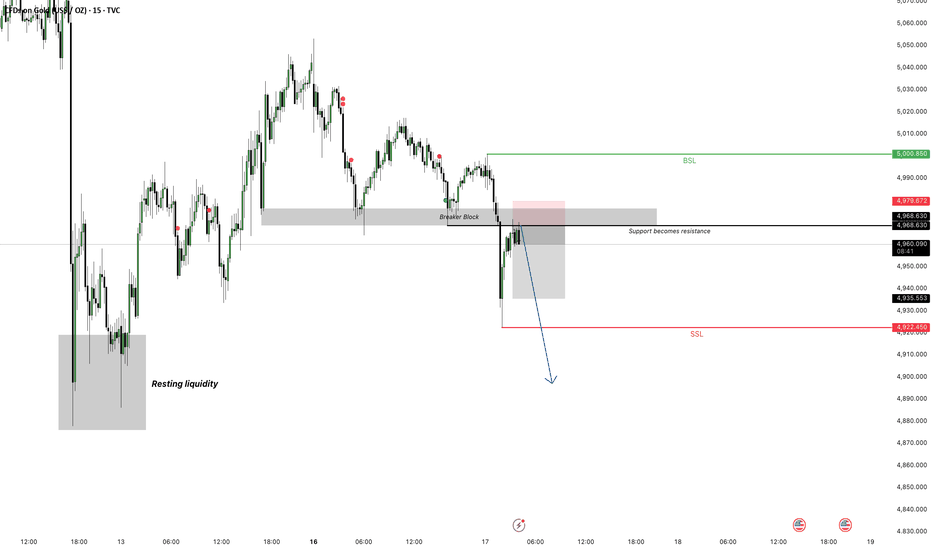
Long