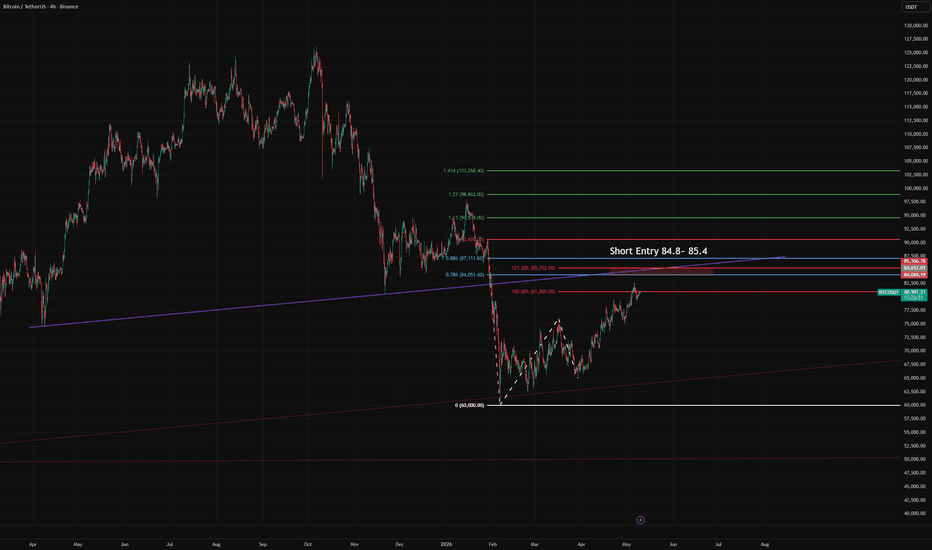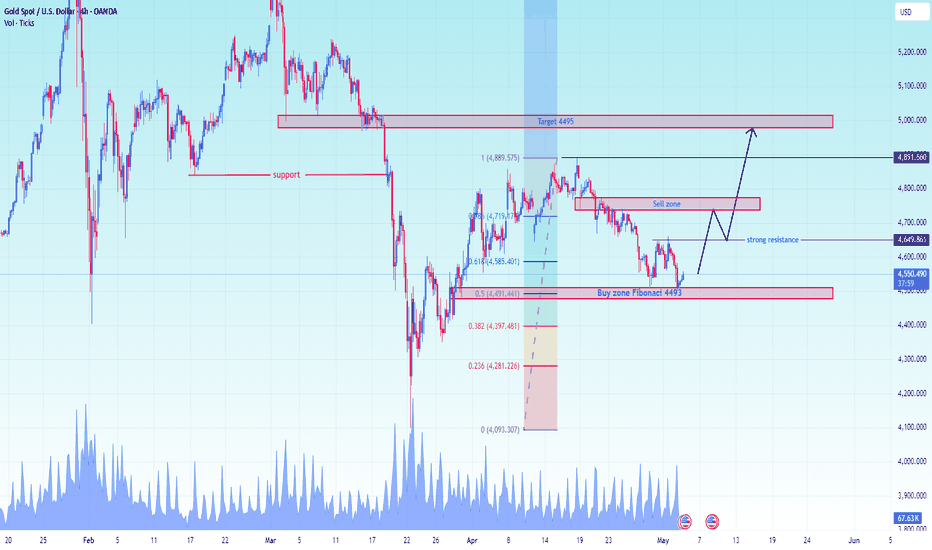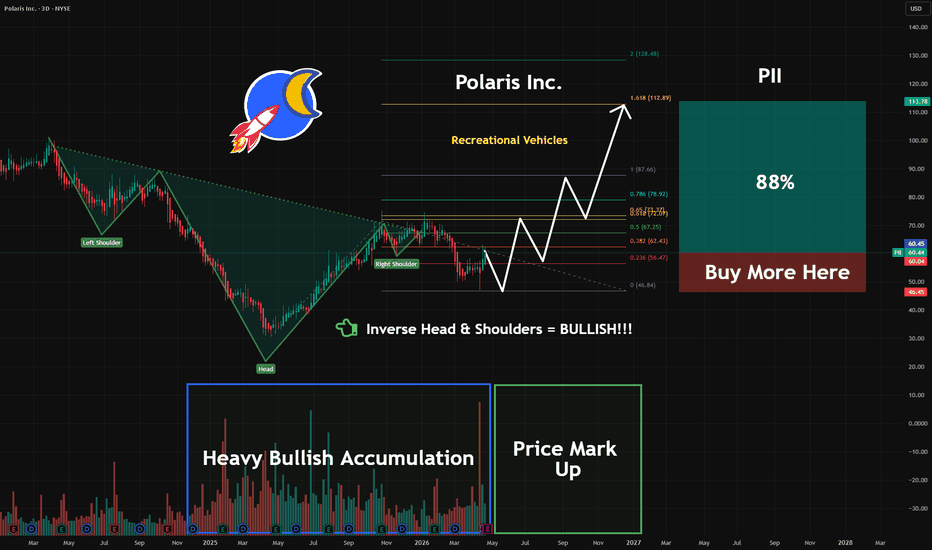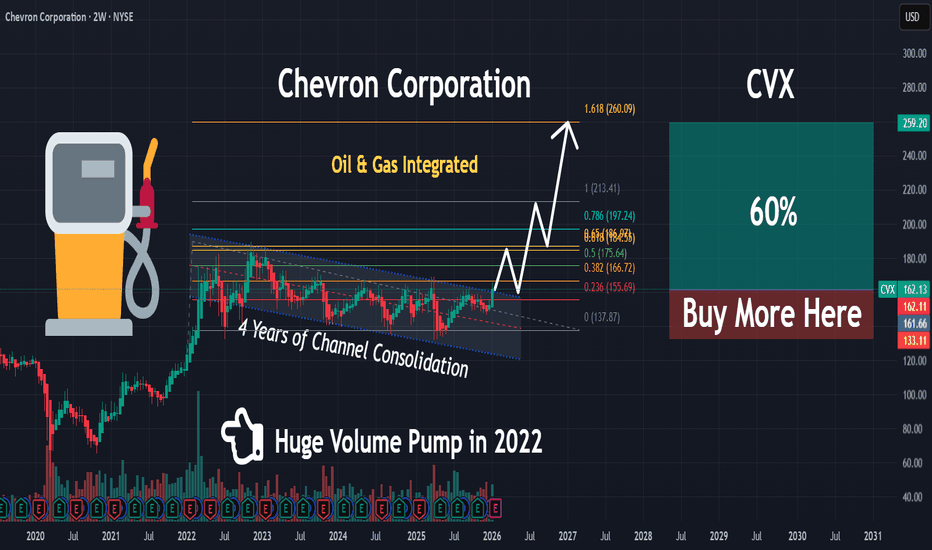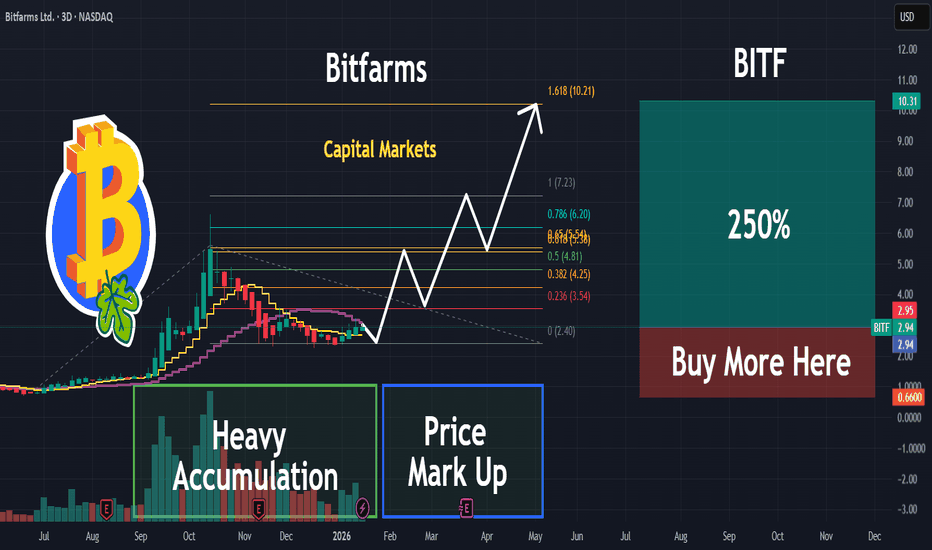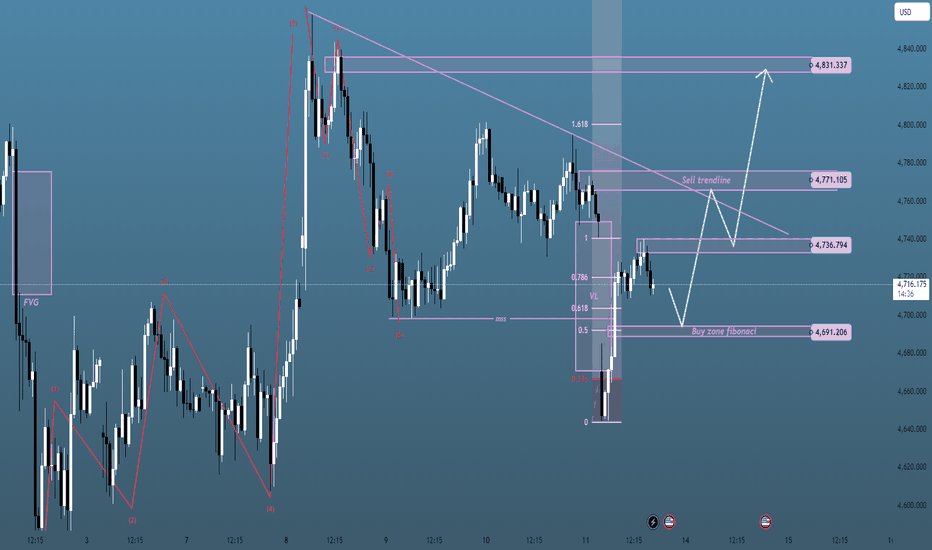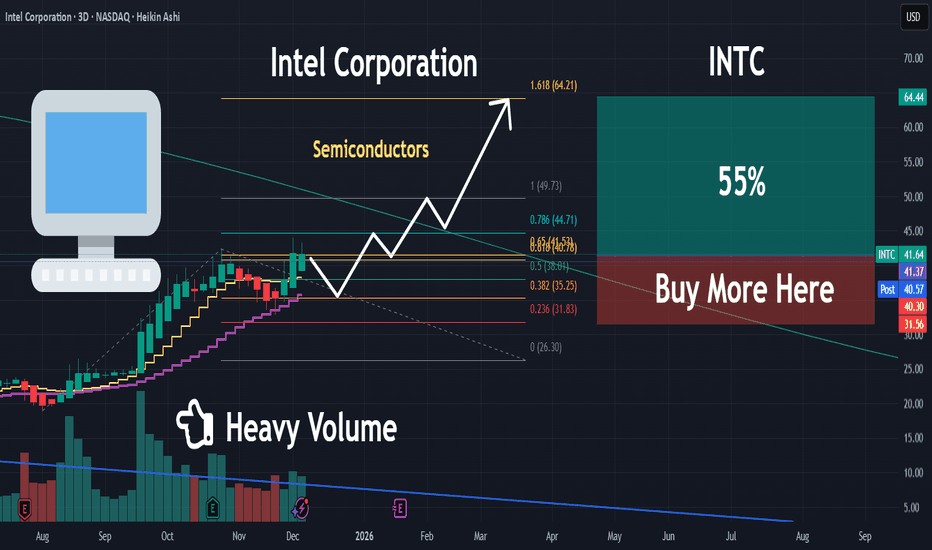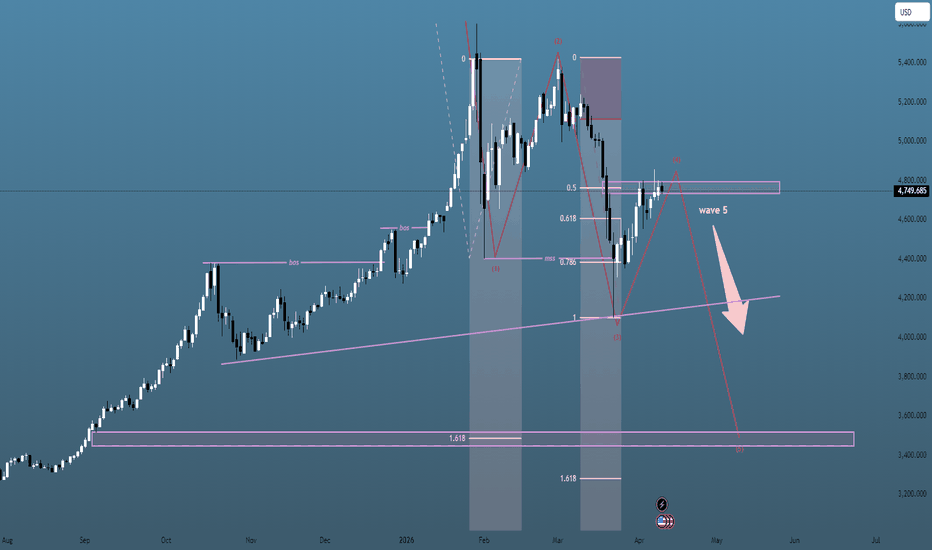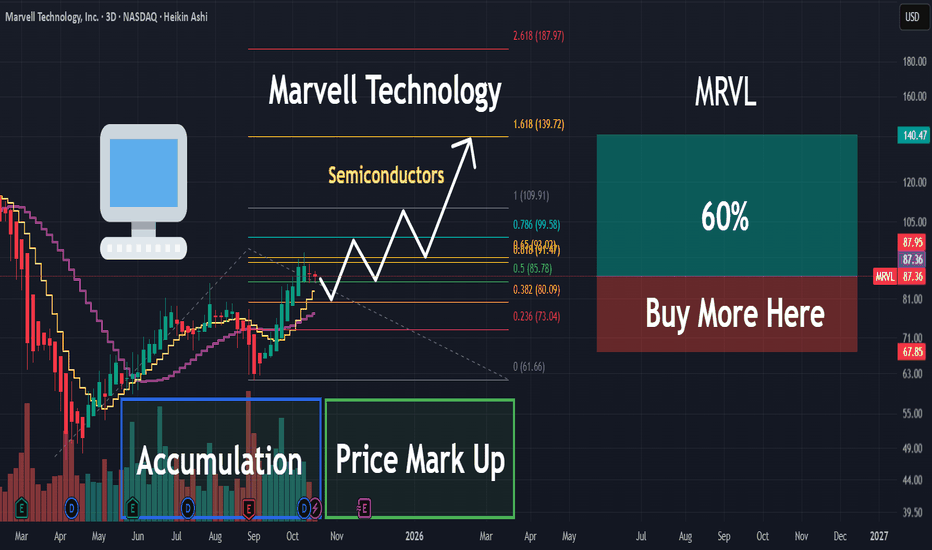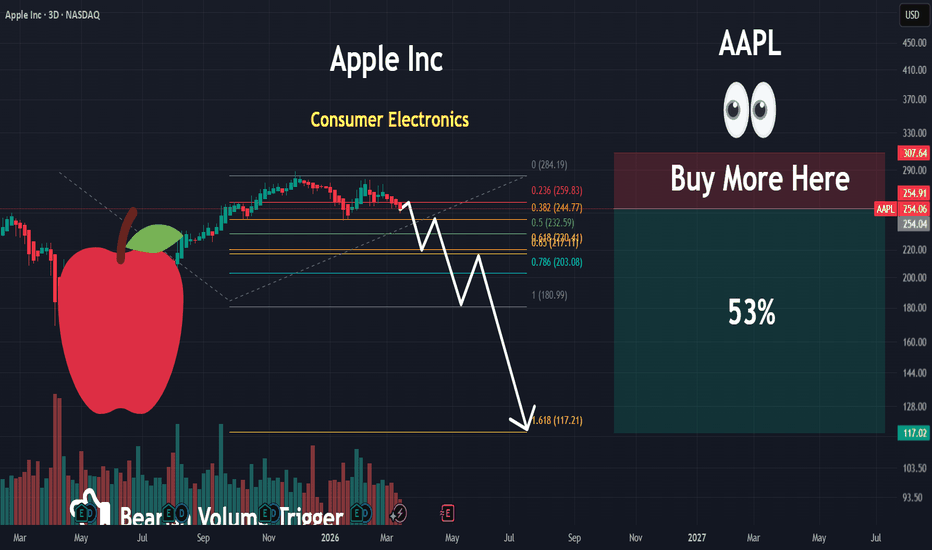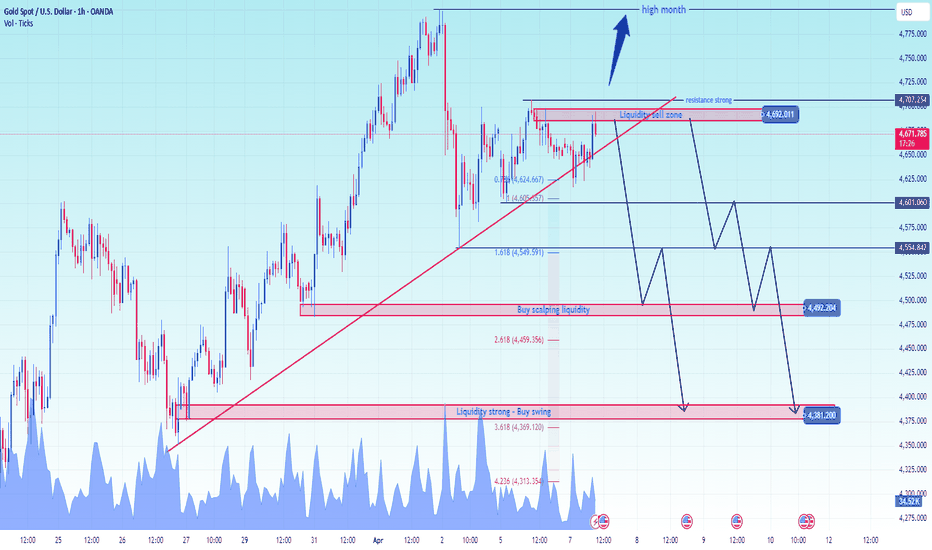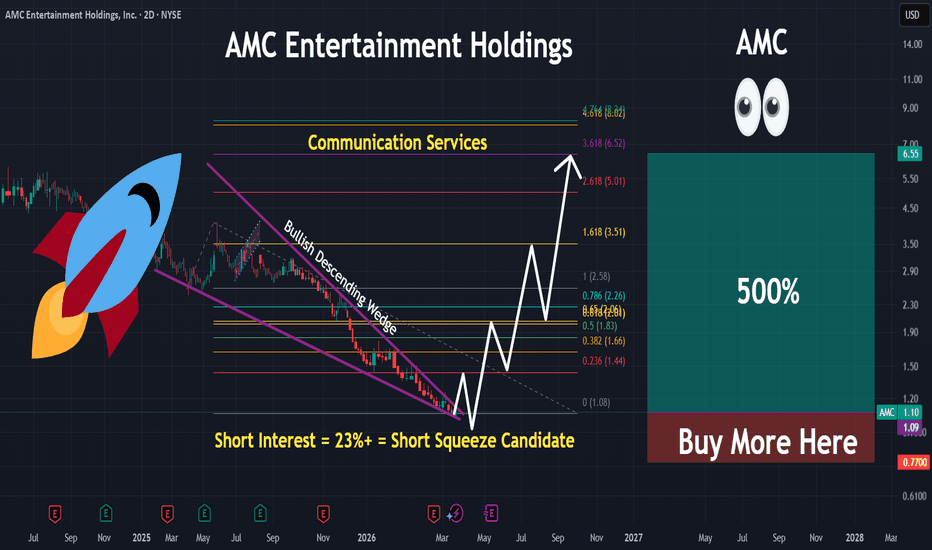
Fibonacci Extension
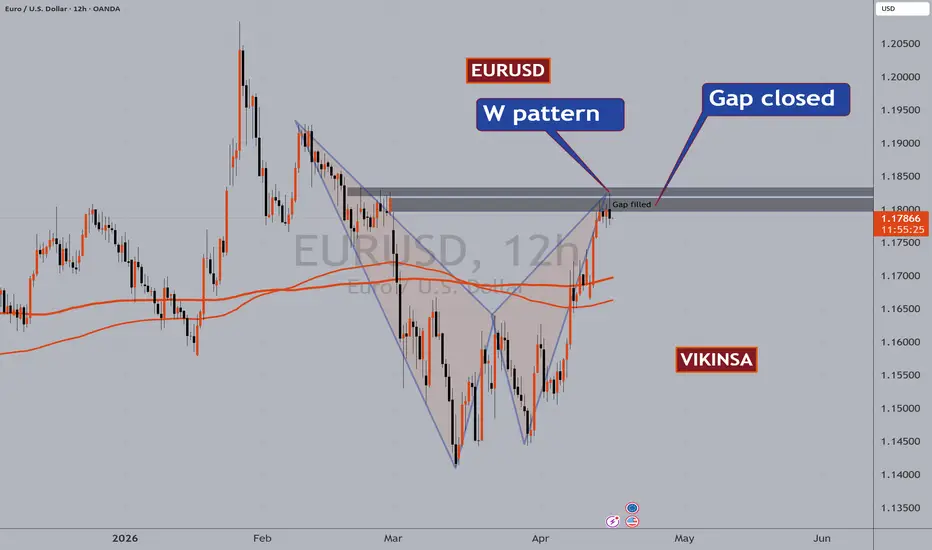
USDCAD Possible W Pattern and other scenariosUSDCAD has been very bullish in recent times.
However it is now forming and nearly has completed a W pattern. Tuis can create a correction.
If the price stay bullish and the previous high become support then it can rise much higher the the anticipated level.
Trade what you see.
Please support this analysis by liking, commenting, and sharing with friends, colleagues, traders, and trading communities. Follow me for more of these. Thanks👍🙂
NVO – Long-Term Cycle View (5–7 Years)Thesis
NYSE:NVO is transitioning from a completed Cycle Wave 2 into a new multi-year expansion phase. The long-term bull structure remains intact, with fundamentals now acting as a catalyst for the next cycle leg.
Context
- Weekly timeframe
- Primary bull trend originates from the 2009 GFC low (< $1)
- Cycle Wave 1 completed in July 2024
- Deep corrective Cycle Wave 2 now appears complete
What I see
-Structural reversal underway from long-term trend support
- Price stabilizing in a major accumulation / buy zone
- New Wegovy pill acts as a fundamental trigger aligning with the technical reversal
- Momentum and structure support the start of Cycle Wave 3
What matters now
- Holding the current base keeps the Cycle Wave 3 thesis intact
- This phase is about accumulation, not timing short-term moves
Buy / Accumulation zone
- Current zone remains suitable for long-term positioning
- This is where multi-year risk/reward is defined
Targets
- Cycle Wave 3 (1.618 Fib): ~$273. Expected around early 2029. Approx. +450% from the buy area
- Cycle Wave 5: ~$415. Expected around 2033. Approx. +730% from the buy area
Income
- Dividend yield ~2.1% adds meaningful carry while holding
Conclusion
Strong technical cycle alignment + improving fundamentals make NYSE:NVO a compelling long-term hold. This is a position built to be held through volatility, not traded.
CVS | Rally Mode In Progress Into 2026CVS Health Corp. is a health solutions company, which engages in the provision of healthcare services. It operates through the following segments: Health Care Benefits, Health Services, Pharmacy and Consumer Wellness, and Corporate and Other. The Health Care Benefits segment operates as a health care benefits provider. The Health Services segment offers a full range of PBM solutions, delivers health care services in its medical clinics, virtually, and in the home. The Pharmacy & Consumer Wellness segment dispenses prescriptions in its retail pharmacies and through its infusion operations. The Corporate and Other Segment is involved in management and administrative expenses. The company was founded by Stanley P. Goldstein and Ralph Hoagland in 1963 and is headquartered in Woonsocket, RI.
QQQ – Weekly Update | Breakout Being TestedThesis
QQQ remains in a late-stage bullish structure. Price is testing the upper boundary of a bullish wedge, with Wave 5 still the primary scenario while key supports hold.
Context
- Weekly timeframe
- Long-term bull trend intact
- Market approaching the final phase of the broader cycle
What I see
- Price tested the wedge breakout level twice this week
- Weekly close held right on the breakout line near $623
- 50-day MA has now been tested and appears to be flipping to support
- Structure remains compressive, not distributive
What matters now
- Breakout level needs to be clearly flipped to support to confirm continuation
- Market is not pricing near-term event risk (tariff ruling next week) as bearish
- As long as price holds above the $600 area, upside structure remains intact
Buy / Accumulation zone
- No aggressive adds at current levels
- Long-term accumulation remains near the $440 area (200WMA confluence)
Targets
- Primary Wave 5 reference: $720–$725 area (2.618 Fib)
Risk / Invalidation
- Loss of $600 and failure to hold the wedge breakout would shift the structure to consolidation
UROY | Nuclear Energy Sources Will Rise | LONGUranium Royalty Corp. operates as an exploration company, which engages in acquiring and assembling a portfolio of royalties, and investing in companies with exposure to uranium and physical uranium. The company was founded by Amir Adnani on April 21, 2017 and is headquartered in Vancouver, Canada.
ULong
BIDU – Breakout Confirmed | Watching Wave 3Thesis
BIDU has completed a multi-year corrective phase and is now advancing within a developing Wave 3 structure following a confirmed breakout.
Context
- Weekly timeframe
- Prolonged correction since 2021
- Structural transition from downtrend → base → breakout
What I see
- Clean breakout confirmed at the end of December
- Prior support found on the 50-day moving average before expansion
- Successful acceptance above former resistance
- Price holding above long-term trend support
- Structure now showing impulsive characteristics
What matters now
- Wave 3 remains intact while price holds above post-breakout support
- After Wave 3 completes, attention shifts to a controlled Wave 4 pullback
- Confirmed support during Wave 4 would define the next add opportunity
Buy / Accumulation zone
- Initial breakout already played
- Next accumulation opportunity expected on confirmed Wave 4 support
Targets
- Primary upside reference at the 1.618 Fibonacci extension ($225 area)
- Higher extensions remain possible if momentum persists
Risk / Invalidation
- Loss of key breakout support would delay the bullish structure
ZETA – Breakout Confirmed | Primary Wave 3Thesis
NYSE:ZETA is transitioning from long-term accumulation into the early phase of Primary Wave 3 following a confirmed breakout.
Context
- Daily / weekly structure
- Primary Wave 2 completed near $10 (April 2025)
- Wave 1 advanced to ~$22
- Recent phase was a controlled Wave 2 consolidation
What I see
- Price has broken out of the accumulation structure
- Higher highs and higher lows now in place
- Price holding above rising moving-average support
- Former resistance has turned into support
What matters now
- Holding above the breakout level keeps the Wave 3 structure intact
- Pullbacks toward former resistance should be viewed as constructive
- Momentum confirms a shift from accumulation to expansion
Buy / Accumulation zone
- Initial accumulation was completed in the $14–$15 area
- Post-breakout pullbacks into support remain add zones
Targets
- $38 area (structural resistance)
- $65 area (1.618 Fib – Primary Wave 3)
- $100 area (Primary Wave 5 extension)
Risk / Invalidation
- Loss of post-breakout support would delay the Wave 3 scenario
BABA – Weekly / Daily Structure | Wave (4) Update
Thesis
NYSE:BABA remains in a broader bullish reversal, with the current pullback continuing to resolve as an intermediate corrective phase.
Context
- Weekly and daily timeframes
- Multi-year base already completed
- Prior impulsive advance followed by a controlled retracement
What I see
- Pullback continues to respect the prior breakout structure
- Price is consolidating inside a descending corrective channel
- Rising longer-term moving-average support remains intact
- Structure remains consistent with an intermediate Wave (4) correction
What matters now
- The 50-day moving average is aligned with the 0.382 Fibonacci retracement near the $159 area
- A break and hold above this confluence would signal completion of Wave (4)
- Failure to reclaim this level likely extends consolidation
Buy / Accumulation zone
- Current consolidation range within the Wave (4) retracement zone
- Risk remains defined against the recent higher low
Targets
- A confirmed flip of the $159 confluence opens the path toward the $230 area
- That level aligns with the next intermediate upside reference
Risk / Invalidation
- Loss of rising support would weaken the bullish reversal structure
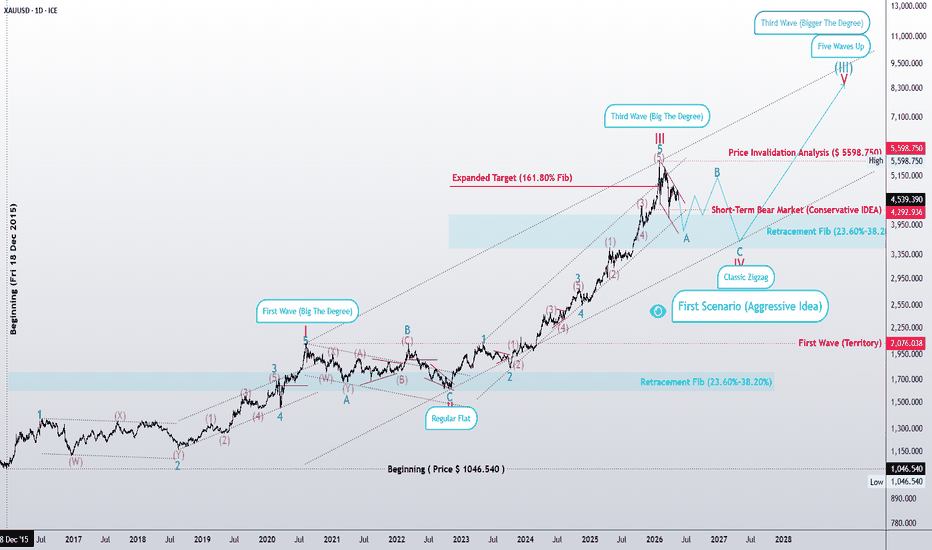
Political instability Can gold rebound to the previous ATH?Political instability: Venezuela’s President Maduro arrested – Can gold rebound to the previous ATH?
1️⃣ Market Context
The overall structure remains bullish.
Price is undergoing a short-term correction after a strong volatile move.
The 4300 area is acting as a key support zone.
RSI shows buy–sell convergence; bulls are gradually absorbing bears, keeping downside pressure well controlled.
2️⃣ News & Fundamental Factors
Geopolitical tension: Venezuela attacked by the U.S., President arrested and transferred to the U.S.
Expectation of a gap and bullish move in gold in the upcoming session.
Current news flow continues to support a positive outlook for gold.
3️⃣ Main Scenario
Priority scenario: Price holds above 4300 and resumes the bullish structure.
Key intraday levels to watch:
Support: 4300–431X, 4270–4275
Resistance: 4370–4375, 4402–4404
Focus on shallow pullbacks in line with the main trend.
4️⃣ Trading Strategy (Intraday / Weekly)
Trend-following remains the core approach, while being prepared for minor pullbacks to avoid missing moves.
Closely monitor price reactions at:
4300: Nearest support, currently holding well.
437X: Potential intraday reaction zone.
Always wait for price action confirmation, avoid entries in the middle of the range.
5️⃣ Extensions & Notes
If 4300 breaks decisively:
Deeper correction toward 427X, 425X
Further extension to 417X, a zone worth watching for swing opportunities.
Volatility remains high → risk management is the top priority.
✨ Wishing everyone a profitable new week, green accounts as far as the eye can see
UPS – Weekly Structure | Wave 3 Breakout in ProgressThesis
NYSE:UPS is breaking out from a multi-month consolidation and transitioning into an impulsive Wave 3 structure, supported by improving price action and strong income characteristics.
Context
- Weekly timeframe
- Prolonged corrective phase followed by tightening consolidation
- Price has recently reclaimed key moving averages
- Dividend yield remains elevated, supporting longer-term positioning
What I see
- Price has broken above the 50-week moving average
- Psychological resistance at the $100 level has been cleared
- The upper boundary of the descending wedge has been breached
- Structure is consistent with the early stages of a Wave 3 advance
What matters now
- Holding above the $100 breakout zone is key to maintaining bullish structure
- Follow-through should remain controlled rather than impulsive, consistent with NYSE:UPS historical behavior
- Failure to hold the breakout would likely result in consolidation rather than trend failure
Buy / Accumulation zone
- Retests of the breakout area above $100 remain the primary zone of interest
- Risk is defined against the former wedge resistance
Targets
- Wave 3 reference aligns with the 1.618 Fibonacci extension near the $120 area
- Longer-term structure remains capped by the 200-week moving average overhead
Risk / Invalidation
- A sustained move back below the $100 level would weaken the breakout thesis
SNDK - Bullish Scenario Since 04 Sept, Momentum Still Intact!SNDK - CURRENT PRICE : 228.47
🔥 Bullish Scenario Supported by Trend Structure & Fibonacci Reactions
SNDK began showing early signs of a bullish scenario when price respected a rising support line , indicating steady accumulation and higher lows forming. The major bullish confirmation occurred on 04 September , when price broke above the 55.55 level (look at red arrow), triggering strong momentum and leading to a rapid vertical rally. As with many fast-moving stocks, a healthy retracement followed, and SNDK pulled back precisely toward the Fibonacci 38.2% golden ratio, where the stock found support and began forming a new base. This behavior suggests the prior uptrend remains intact, and the uptrend may resume as long as the stock continues to hold above this retracement zone.
Some Elliott Wave practitioners may also interpret the current structure as a developing Wave 5, suggesting the potential for another upside leg if the trend continues to follow impulsive wave behavior.
Take note that I'm using logarithmic scale chart because the share price has already risen more than 300% since the 04 September breakout, making it more suitable for analyzing large percentage moves and trend structure.
ENTRY PRICE : 228.47
FIRST TARGET : 270.00
SECOND TARGET : 324.00 (Projected based on Fibonacci extension)
SUPPORT : 183.00 (The low of 21 Nov HAMMER candle)
$NVO – Weekly Structure | Reversal From Long-Term SupportThesis
NYSE:NVO is attempting a structural reversal after a deep corrective phase, supported by long-term trend support and improving fundamental visibility.
Context
- Weekly timeframe
- Multi-year uptrend followed by a sharp corrective decline
- Price has retraced into the long-term rising support zone
- Recent developments in weight-loss treatments improve medium- to long-term outlook
What I see
- Price has held the long-term rising trendline
- Corrective ABC structure appears complete
- Price is stabilizing inside a well-defined accumulation range
- Momentum is shifting from expansion down to basing behavior
What matters now
- The key confluence level sits at the 200-day moving average and the 0.618 Fibonacci retracement near the $59 area
- A break and hold above this level would confirm the reversal structure
- Failure at this level would likely extend consolidation
Buy / Accumulation zone
- The current base along long-term support remains the primary area of interest
- Structure favors accumulation while price holds above the rising trendline
Targets
- First confirmation level at the 200-day MA / 0.618 Fib confluence
- Longer-term reference remains the 200-week moving average in the $80 area
- That level represents a full structural reset following the correction
Risk / Invalidation
- Loss of the long-term rising trendline would invalidate the reversal thesis
DLTR | Something is Brewing for Dollar Tree | LONGDollar Tree, Inc. owns and operates discount variety stores offering merchandise at fixed prices. It operates through the Dollar Tree business segment. The Dollar Tree segment includes operations under Dollar Tree and Dollar Tree Canada brands, with its distribution centers in the United States and Canada. The company was founded by J. Douglas Perry and Macon F. Brock, Jr. in 1953 and is headquartered in Chesapeake, VA.
NVO – Weekly Structure UpdateThesis
NVO is attempting a structural reversal after a deep corrective phase, supported by both long-term trend support and improving fundamental visibility.
Context
- Weekly timeframe
- 70% correction from cycle highs
- Price has respected the long-term trendline originating in 2016
- Recent product developments in weight-loss therapies improve long-term business outlook
What I see
- Price held the long-term rising support after the correction
- Recent advance reclaimed the 50-day moving average
- Price is consolidating above short-term support, suggesting stabilization
- Structure is transitioning from decline to base formation
What matters now
- Holding above the 50-day MA keeps the early reversal structure intact
- Next key test sits at the confluence of the 0.618 Fibonacci retracement and the 200-day moving average near the $60 area
Buy / Accumulation zone
- Pullbacks toward the current base and rising support zone remain the area of interest
Targets
- Initial resistance at the 0.618 Fib / 200-day MA confluence
- A confirmed higher low after that test would define Wave 1–2 structure
- Longer-term reference remains the 200-week moving average overhead
Risk / Invalidation
- Loss of the long-term trendline would invalidate the reversal thesis
BIDU – Weekly Structure BreakoutContext
- Weekly timeframe
- Long corrective phase since 2021
- Recent transition from downtrend to base and breakout
What I see
- Clean breakout from the long-term descending channel
- Successful retest of the channel and rising support
- Price holding above the 200-week moving average
- Consolidation formed directly on long-term support
- Recent advance from a higher low confirms support acceptance
What matters now
- Holding above the 200-week MA keeps the reversal structure intact
- Continuation requires sustained trade above former resistance
Buy / Accumulation zone
- Pullbacks toward the 200-week MA and former channel resistance acting as support
Targets
- Primary upside reference at the 1.618 Fibonacci extension ($211 area)
- Higher extensions remain possible toward prior cycle projections if trend continues
Risk / Invalidation
- Sustained weekly loss of the 200-week MA would invalidate the support confirmation
FICO | Strong Momentum Incoming | LONGFair Isaac Corp. engages in the provision of decision management solutions. It operates through the Software and Scores segments. The Software segment includes pre-configured analytic and decision management solutions designed for a specific type of business need or process. The Scores segment focuses on business-to-business scoring solutions and services, business-to-consumer scoring solutions and services including myFICO solutions for consumers and associated professional services. The company was founded by Bill Fair and Earl Isaac in 1956 and is headquartered in San Jose, CA.
CLBT | This Software Tech Stock Will Rise | LONGCellebrite DI Ltd. engages in the provision of digital investigative solutions for the public and private sectors, empowering organizations in mastering the complexities of legally sanctioned digital investigations by streamlining intelligence processes. Its services include training and advisory, value realization, advanced services, and technical customer support. The firm also offers software solutions and analytic tools designed to accelerate digital investigations and address the growing complexity of handling crime and security challenges in the digital era. The company was founded on April 13, 1999 and is headquartered in Petach Tikva, Israel.
JD – Weekly Descending Wedge (Late-Stage Compression)Thesis
JD remains in a late-stage descending wedge, with volatility compression increasing the probability of a range resolution. Peers already broke out in 2025 a similar setup (BABA, BIDU). 2026 can be the time for JD to catch up.
Context
- Weekly timeframe
- Multi-year downtrend transitioning into a base
- Support zone acting as the wedge “floor”
What I see
- 12+ months of narrowing range
- Repeated rejection at descending resistance
- Demand holding the same support region
- Compression suggests a decision point approaching
What matters now
- A weekly close above wedge resistance is the confirmation trigger
- Until then, this remains a compression structure, not a breakout
Buy / Accumulation zone
- Support zone at the wedge floor (risk defined by a breakdown).
Targets
- First: $70s
- Next: higher extensions into Wave 5, once pull back held
Risk / Invalidation
Weekly breakdown below the support floor invalidates the wedge thesis.
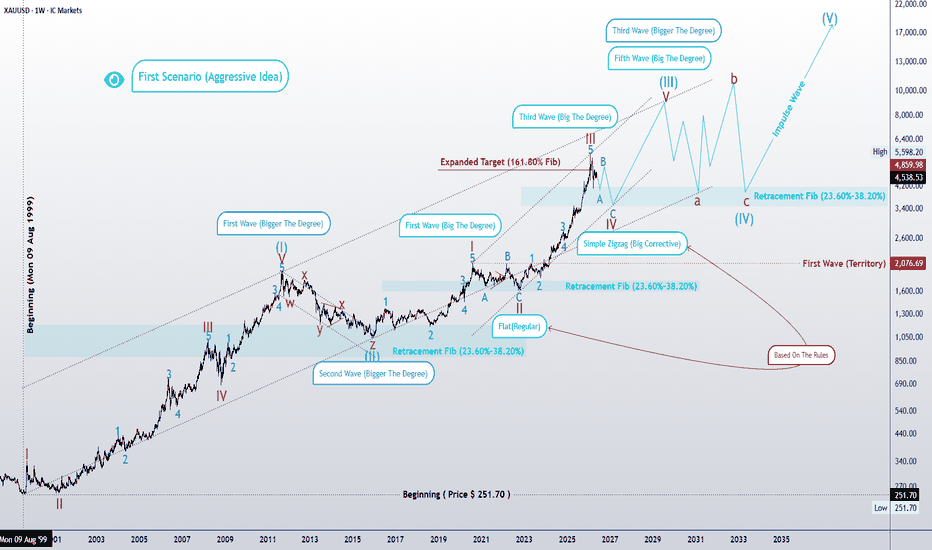
The vertical rise of Gold.In the mid-seventies Gold made a top and a bottom, from which we measure using a fibonacci extension tool.
Of special interest are the 2.272, 3.272 and 4.272 levels. Those give us a glimpse into the possible future, at which levels Gold might top out.
Since 2022 major Central Banks have been going on a Gold shopping spree, the once described barabrous relic seems to be a very coveted commodity, and it makes sense.
When everything becomes digital, virtual and ephemere, hard assets save the day.
Do you see 15K happening ?
QQQ – Weekly Structure OverviewThesis
Weekly uptrend intact. Price is extended; next decision is breakout vs. consolidation near highs. We are next to the end of the long term bull trend.
Context
200WMA is rising and aligns with major support near 440 (long-term mean reversion / reset zone).
What I see
- Prior stress phases reverted toward the 200WMA (2022 and early 2025).
- Current structure is a rising consolidation near highs (compression).
What matters now
- Continuation remains favored while price holds above key trend support ($600 on chart).
- A clean weekly expansion above the consolidation keeps upside structure intact.
Buy / Accumulation zone
- Long-term accumulation zone: $440 area (200WMA + horizontal support confluence).
Targets
- Extension reference: 2.618 Fib $720s (measured upside within current structure).
SLV | Next Leg Higher Is Here | LONGiShares Silver Trust seeks to reflect generally the performance of the price of silver. The Trust seeks to reflect such performance before payment of the Trust's expenses and liabilities. It is not actively managed. The Trust does not engage in any activities designed to obtain a profit from, or to ameliorate losses caused by, changes in the price of silver.
ALLY | Nice Incoming Move Higher | LONGAlly Financial, Inc. engages in the provision of automotive financing and insurance services. It operates through the following segments: Automotive Finance Operations, Insurance Operations, Corporate Finance Operations, and Corporate and Other. The Automotive Finance Operations segment offers automotive financing services to consumers, automotive dealers and retailers, companies, and municipalities. The Insurance Operations segment includes consumer finance protection and insurance products sold primarily through the automotive dealer channel, and commercial insurance products sold directly to dealers. The Corporate Finance Operations segment is involved in senior secured asset-based and leveraged cash flow loans to mostly U.S.-based middle-market companies, with a focus on businesses owned by private equity sponsors. The Corporate and Other segment consists of centralized corporate treasury activities, such as management of the cash and corporate investment securities and loan portfolios, short- and long-term debt, retail and brokered deposit liabilities, derivative instruments, original issue discount, and the residual impacts of corporate FTP and treasury ALM activities. The company was founded in 1919 and is headquartered in Detroit, MI.