XAUUSD — Bearish Continuation Toward Fibonacci Target
Fundamental Analysis
Gold remains sensitive to USD momentum, Treasury yields, and upcoming U.S. macro data. For next week, the technical bias still leans bearish while price stays below the major descending structure.
Technical Analysis
On the 4H chart, XAUUSD is trading around 4,017 after losing momentum under the downtrend trendline. The nearest sell reaction zone is around 4,050 - 4,070, where price may retest the Fibonacci sell area before another downside move. If this zone rejects price
Fibonacci Retracement
GOLD - The hunt for liquidity before the fall to 3900...FX:XAUUSD has completely unwound the bullish momentum generated by the recent news and has printed fresh local lows. The market remains in both a local and broader bearish trend, driven by persistent fundamental and geopolitical uncertainty
Gold continues to trade under pressure, with sellers firmly in control. The next key catalysts will be the U.S. Consumer Sentiment and Inflation Expectations reports. The technical outlook remains bearish, with price making new local lows while still ho
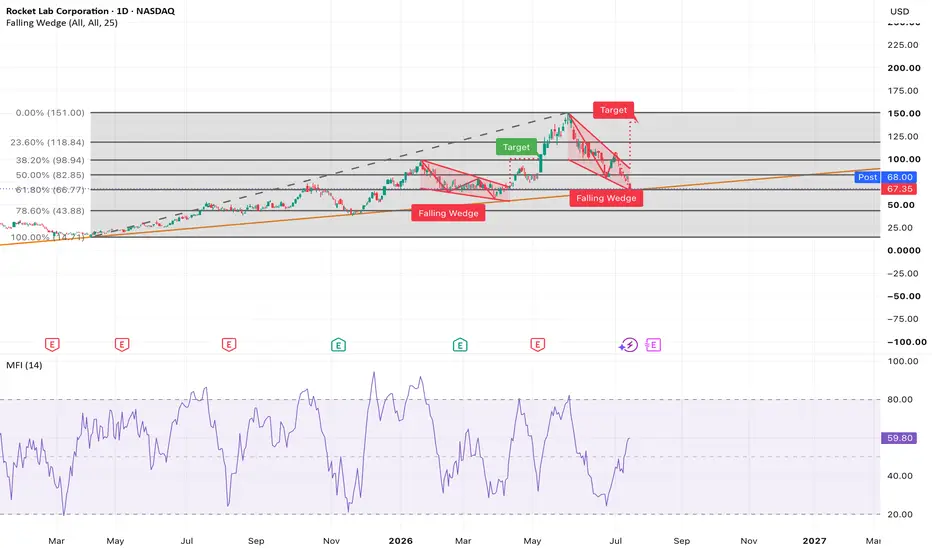
RKLB dip buying opportunity Many high beta stocks in the space and AI sectors are dumping right now. RKLB sits at an attractive price level after today's sell-off for long-term investing.
- 61.80% retracement of a move from April 2025
- Falling wedge pattern that's typically bullish once broken
- Ascending trendline that has been tested 3 times now
- MFI keeps rising despite bearish price movement
Additionally, earnings season is approaching which is likely to change the market sentiment soon.
BITCOIN - A false breakout of resistance in a bear market BINANCE:BTCUSDT.P is forming a retest of the key 64,500 resistance level as part of a countertrend correction, trapping late buyers while the market remains in a liquidity sweep phase
The broader trend remains bearish. Unstable ETF flows, the lack of meaningful fundamental support, and ongoing geopolitical uncertainty continue to weigh on the market.
Within the broader bear market, the market maker has swept liquidity above 64,500 before pushing price back into the trading range. Bitcoin
GOLD - Anticipating a short squeeze before the decline continuesICMARKETS:XAUUSD experienced a short squeeze around the key liquidity zone following Tuesday's CPI release. However, the market quickly regained its bearish momentum and resumed selling in line with the prevailing trend
The U.S. dollar remains in consolidation, as does the broader market, but the Dollar Index (DXY) continues to maintain its broader bullish trend, keeping pressure on gold. The lack of fundamental support, combined with ongoing geopolitical tensions, continues to favor the b
HL Near Golden Pocket!ITANZ Analysis
Closed at 42.87 (29-06-2026)
As suggested on 12-06-2026 (when the price touched 53+) to wait for
a good support zone; the price went down to 39 - 40.
Now 42.50 - 44.50 is an important Resistance Zone.
Monthly Closing above this range would be a +ve sign.
However, 38 - 42 is a Golden Pocket Zone which may act as a Strong Support.
There is a high probability of prirnting HL around this zone.
Crossing 53 - 54 with good volumes may lead it towards 60.
Breaking the Golden Pocket Zone
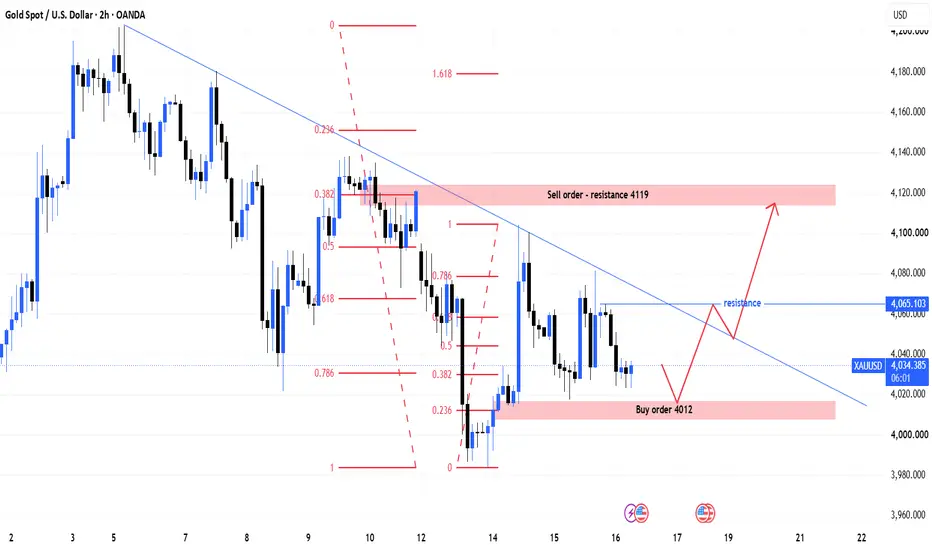
MASON XAUUSD – Bullish Setup Above 4,012 Buy Zone
XAUUSD is trading around 4,036 after forming a short-term base above the 4,012 buy order zone. Price is still below the descending trendline, but the current structure shows that buyers are trying to defend the lower support area.
The priority view is bullish recovery, as long as gold holds above 4,012 and breaks the 4,065 resistance with clear confirmation.
Technical View
Gold is currently moving inside a short-term corrective structure after the previous bearish move. However, the selling
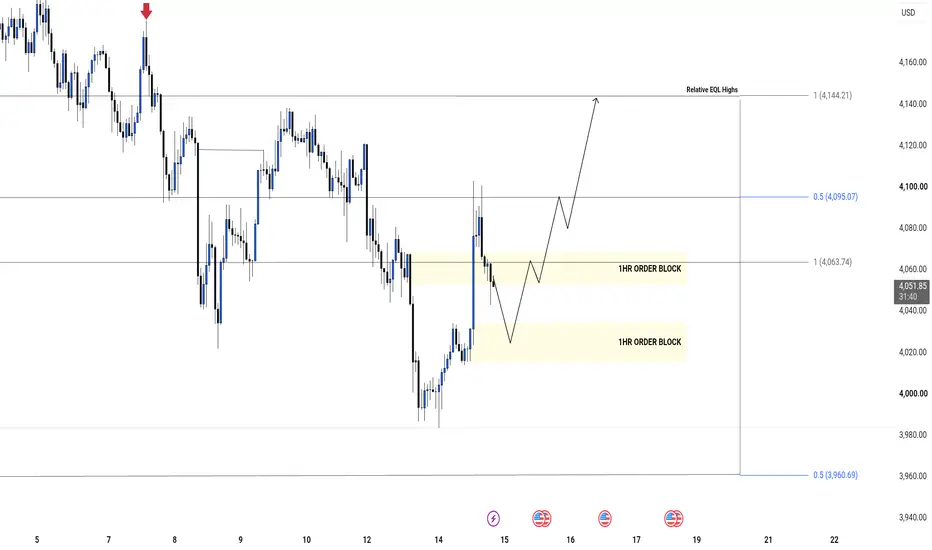
SMC Structural Shift: Targeting Relative EQL HighsTechnical Breakdown
1. Liquidity Sweep & Displacement
The Sweep: Price aggressively took out the previous structural lows, dipping below 4,000 to hunt sell stops.
The Shift: Immediately after the sweep, a sharp, impulsive green candle pushed back upward, indicating strong institutional displacement and buying pressure.
2. The Dual 1HR Order Blocks
We have two high-probability demand zones highlighted in yellow:
First 1HR Order Block (Discount Zone): Located around the 4,020.00 – 4,035.00 range
USDCAD - From consolidation to downward distributionFX:USDCAD is forming a reversal pattern following its recent strong rally. The market appears to be transitioning from a consolidation phase into a distribution phase
The U.S. dollar has entered a period of consolidation, while the Canadian dollar is beginning to strengthen, putting additional pressure on the pair.
After the strong advance, USDCAD moved into a 1.4150–1.4250 trading range. Instead of continuing higher, price is now showing signs of a reversal. Buyer participation may lead t
GOLD - A countertrend correction before a decline FX:XAUUSD has reversed lower from the 4120–4133 resistance zone—exactly the scenario we had been anticipating since the end of last week—and is now testing the 4050 support area while forming a false breakout. The fundamental and geopolitical backdrop remains weak, suggesting that the broader decline may continue
Gold fell sharply on Monday, breaking below the $4100 level as renewed tensions in the Middle East boosted the U.S. dollar. Although the dollar is currently consolidating, it rema
Breaker Block / Order Flow Trade setup Next move on the way, focus on proper risk management & stay disciplined. Wishing you successful trades..!
Key Reason:
1. Price sweep 3998 major liquidity and create equal low, and then retest back and hunt equal low liquidity and close the rejection candle. After this price break the M30 key level upward.
2. Where price create range.
3. Untap breaker block and valid pullback is left.
4. Already price is moving inside the News candle range.
5. Internal structure was bullish.
6. wait for
XAGUSD 4H — Is Silver Setting a Bull Trap Near $59.86?Silver remains technically bearish despite the current recovery. Price is still producing lower highs beneath the descending trendline, while the broader structure continues to favor sellers.
The recent bounce from approximately $56.86 appears corrective rather than impulsive. Price has reclaimed the 0.236 and 0.382 Fibonacci levels and is now trading around the 0.50 retracement near $58.81. This recovery could continue higher before the next bearish expansion begins.
The Main Area I’m Watchi
XAUUSD 4H — Bearish Continuation After a 0.62 FVG Fill?Gold remains structurally bearish inside a well-defined descending channel. Price continues to form lower highs beneath the major descending trendline, and the recent reaction from 3,983 currently looks more like a corrective retracement than the beginning of a confirmed bullish reversal.
Why I’m Maintaining a Bearish Bias
The larger market structure remains bearish. Every meaningful rally has been rejected beneath descending resistance, while price continues trading far below the major supp
Euro / British Pound ($EURGBP) Daily: Tactical Pivot TriggerEuro / British Pound ( OANDA:EURGBP ) Daily: Tactical Pivot Trigger Sets Up High-Asymmetry Counter-Trend Mean Reversion
### 🇪🇺🇬🇧 Euro / British Pound ( OANDA:EURGBP ) Daily Technical Matrix (Ref: EURGBP_2026-07-14_08-57-08.png)
We are releasing a tactical counter-trend study on the EURGBP currency cross on the Daily (1D) time interval. Following a prolonged markdown phase that left price action severely stretched, the pair is constructing a localized bottoming signature, printing a key pivot p
XAUUSD — Is 4,080 the Sell Trap?Gold is still moving inside a descending price channel.
Price is trading around 4,050 - 4,060, right near the middle zone of the channel.
This is not a clean buy area.
And it is not the best place to chase a sell either.
For me, today’s chart is about one question:
Will gold retest the sell zone first before dropping deeper?
The simple read
Gold remains under short-term bearish pressure while price stays inside the descending channel.
The nearest sell reaction area is around 4,080 - 4,091.
Th
XAUUSD — Bearish Pressure Below Liquidity Sell Zone
Fundamental Analysis
Gold remains sensitive to USD momentum, Treasury yields, and upcoming U.S. macro data. For now, the market is still showing defensive price action, with sellers controlling the structure after price failed to hold above the previous trendline.
Technical Analysis
On the 1H chart, XAUUSD is trading around 4,026 after breaking below the short-term uptrend structure. The nearest reaction area is the liquidity buy scalping zone at 3,998 - 4,004, where price may create a short b
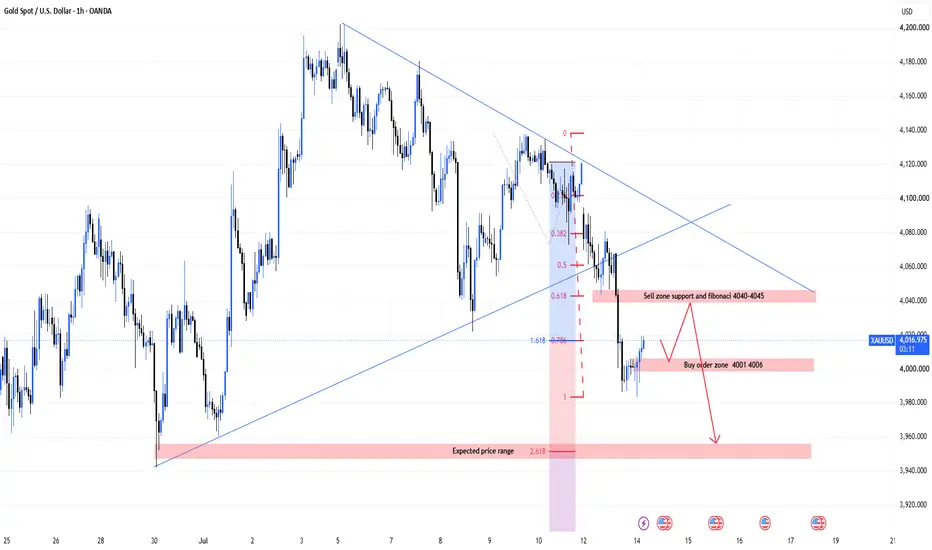
MASON XAUUSD – Bearish Trend Targets Fibonacci Range
XAUUSD is trading around 4,017 after breaking below the rising trendline support. The short-term structure has shifted back into bearish pressure, and price is now moving below the broken support area.
The priority view remains sell with the current bearish structure, especially if gold retests the 4,040–4,045 zone and fails to recover above it.
Technical View
Gold has broken below the rising trendline that previously supported the recovery structure. This is an important bearish signal beca
BTC | The Inevitable Collapse of Bitcoin to Sub-$20K | SHORTHISTORY IN THE MAKING: The Inevitable Collapse of Bitcoin to Sub-$20K (And Why Saylor Got It Wrong)
Traders, we are currently witnessing the greatest distribution phase in modern financial history.
With Bitcoin hovering precariously around the $64,000 mark after its staggering collapse from the 2025 highs, the retail crowd is desperately clinging to the hope of a "bull flag" or a "healthy correction." Let me be crystal clear: this is not a dip to be bought. This is the structural unwinding of a
AAPL | The Trap - Why Apple’s AI Halo Is Fading | SHORTIf you think the $4.37 trillion "iStock" is invincible, you might want to check the expiration date on this rally.
While everyone is busy hyperventilating over "Apple Intelligence," Siri upgrades, and WWDC software reveals, the chart is quietly downgrading its future. Here’s why we’re looking at a potential 65% liquidation event at the Apple Store.
1. The Bearish Divergence (The Momentum Whisperer)
Price is making "Higher Highs" up near $315 that look great on a billboard, but the RSI (sittin
KOSPI: Major Market Correction or the Ultimate Re-Accumulation?The South Korean KOSPI Composite Index is experiencing a massive, rapid sell-off, dropping over 8.9% on the daily chart and piercing straight through recent structural highs. After an explosive, overextended bull run lasting through late 2025 and early 2026, the market is aggressively unwinding and hunting for major institutional liquidity.
When a dominant trend corrects this heavily, we strip away the noise and focus purely on macro structural value. Here is how the technical roadmap shapes up
BITCOIN - Retest of the 64,500 liquidity zone BINANCE:BTCUSDT.P remains within the 58,000–67,000 trading range, established as part of the broader bearish trend. Locally, the market is testing the upper boundary of the consolidation zone at 61,000–64,500, with the primary focus now on the resistance area
Bitcoin is currently caught between three major forces: the hawkish FOMC minutes, unstable ETF flows—with outflows resuming after three consecutive days of inflows—and ongoing geopolitical uncertainty. The market still lacks a strong
MASON XAUUSD – Trendline Break May Target Fibonacci
XAUUSD is trading around 4,071 after losing short-term recovery momentum near the Ichimoku structure. Price is now testing the rising trendline support, and the early-week focus is on whether gold can hold this structure or break lower.
The priority view is bearish if gold breaks below the trendline and strong support area. A clean breakdown may open the way toward the Fibonacci extension targets.
Technical View
Gold is currently moving inside a tightening structure between the descending res
XAUUSD — Recovery First, Bearish Rejection Later
Fundamental Analysis
Gold remains sensitive to USD momentum, Treasury yields, and upcoming U.S. macro data. For next week, price may create a technical recovery first, but the larger structure still shows bearish pressure while gold stays below the main descending trendline.
Technical Analysis
On the 12H chart, XAUUSD is trading around 4,120 after holding above short-term support. The first upside area to watch is 4,204, which acts as strong resistance. If price continues higher, the major se