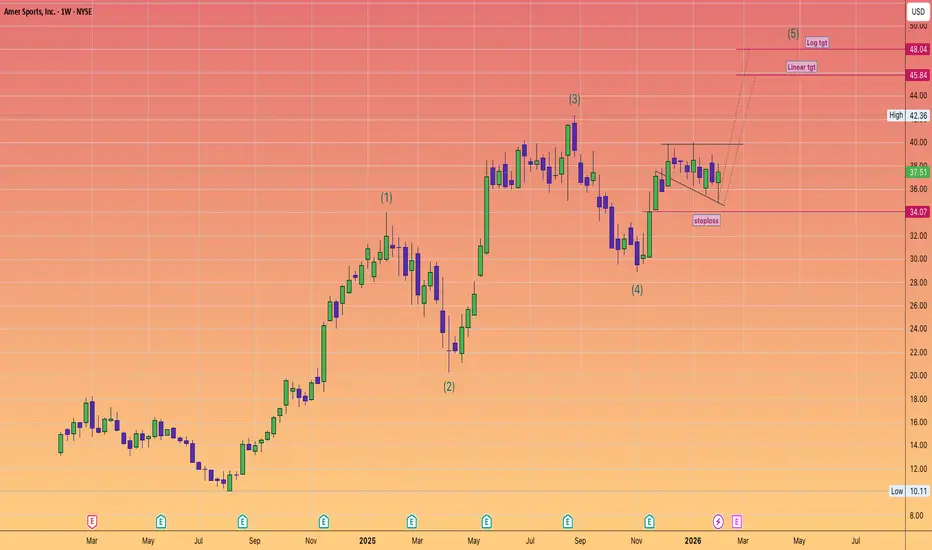
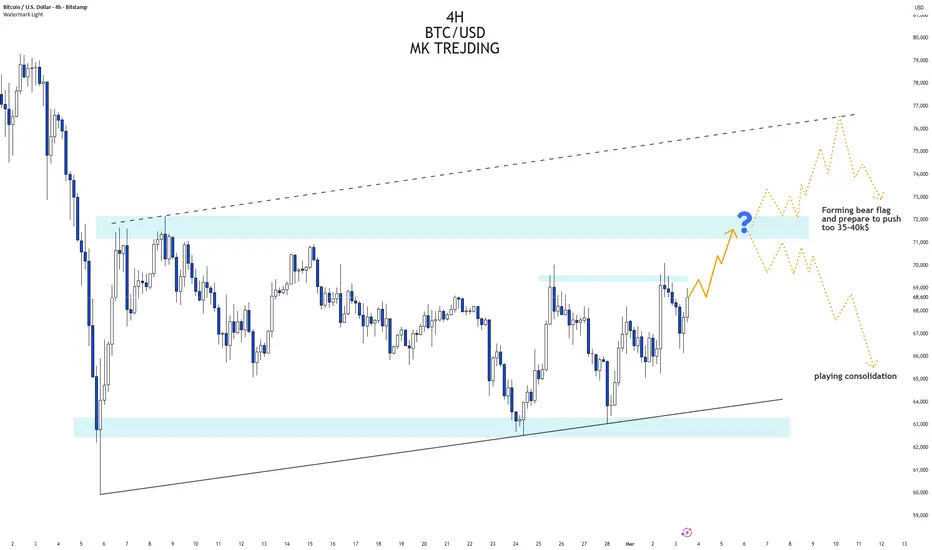
STRL - Strong Fundamentals, Strong Chart, Breakout WatchThis is one of the strongest non-tech growth names in the market, and the chart is starting to line up with the fundamentals in a big way.
Sterling Infrastructure continues to deliver exactly what you want to see from a true market leader: powerful earnings growth, strong margin expansion, rising backlog, and clear exposure to high-demand areas like data centres, advanced manufacturing, warehouses, and other mission-critical infrastructure projects. This is not just a slow industrial name grinding higher. The business has been transforming into a much higher-quality growth story, and the numbers are backing it up.
The latest quarter was outstanding, with 51% revenue growth and 78% adjusted EPS growth, while the company continues to show strong profitability and solid forward visibility. Backlog remains a major strength, and institutional sponsorship has also been improving. That is the kind of combination that can keep momentum names working longer than most expect.
Now the chart is getting interesting.
Price is still holding above the 50 DMA and well above the 200 DMA, so the primary trend remains firmly bullish. More importantly, the current consolidation looks like a bullish flag after a strong move higher. That usually puts the focus on continuation, not breakdown.
What I really like here is the volume action. As price has pulled in and tightened up, volume has been drying up. That often signals seller exhaustion rather than heavy distribution. In other words, weak hands may be getting cleared out while stronger hands absorb shares in the background.
That sets up a very clear trigger:
A breakout above flag resistance with strong volume could be a powerful entry signal.
If buyers step in with conviction, this setup has the look of a stock that could start its next leg higher. The trend is already strong, the fundamentals are already strong, and now the chart may be offering a clean continuation pattern.
Bullish view:
Strong earnings and revenue growth
Expanding margins
Strong backlog and business momentum
Institutional support improving
Bullish flag above key moving averages
Drying volume during consolidation
Breakout with volume could confirm trend continuation
Key levels to watch:
Breakout above the current flag resistance
50 DMA as near-term support
200 DMA as major trend support
Bottom line:
STRL is acting like a leader. If this flag resolves higher with volume, it could be one of the cleaner bullish continuation setups on the board.
Not financial advice. Aussie in the Crosscurrents of Iran, Oil, and RBA HikesAUD/USD bounced more than 1% from Friday’s close to start the week as sentiment improved across risk assets on Monday. Still, the broader backdrop remains complicated – disruptions around the Strait of Hormuz have pushed crude prices sharply higher, injecting a fresh inflation impulse into the global economy. For Australia, the surge in energy prices is feeding directly into higher petrol costs and broader price pressures, complicating the domestic outlook even as the Australian Dollar remains sensitive to shifts in global commodity markets and risk sentiment.
The Reserve Bank of Australia now faces a difficult policy backdrop as policymakers assess how the oil shock could influence the inflation outlook. Higher energy costs risk pushing headline inflation higher again, potentially reinforcing the RBA’s hawkish stance even as growth risks build. To this end, the RBA is expected to hike rates by 25-bps to 4.10% when they meet on Tuesday (11:30pm Monday ET). Traders will be watching the RBA decision closely for guidance on the rate path beyond this week and any language around energy-driven inflation risks. From there, attention shifts to the FOMC on Wednesday, where markets continue to push out expectations for rate cuts into the fall.
In the above chart, AUD/USD may still be in the form of a bull flag, having broken out, retested the breakout level, and holding a consolidation above former resistance. Even though the pair has failed to generate topside momentum after setting a fresh yearly high last week, the lack of breakdown and rebound at the 50-day exponential moving average (EMA) reinforces the bull flag interpretation. With Monday’s close, AUD/USD is back above each of the daily 5-, 20-, 50-, and 100-EMAs. Once again, a break above the 2023 high at 0.7158 would validate the bull flag breakout and could open the path for a measured move towards 0.7230 (2022 resistance). On the other hand, a failure to hold above 0.7000 could invalidate the pattern and shift focus back to the downside.  Long
Long
Synopsys May Be FlaggingSynopsys has sputtered for more than two years, and some traders may see risk of a push to the downside.
The first pattern on today’s chart is the series of higher lows since mid-November. SNPS has held that line without significant bounces, which could suggest support is at risk of breaking.
Second, the 50-day simple moving average (SMA) had a “death cross” below the 200-day SMA in October. The 8-day exponential moving average (EMA) crossed below the 21-day EMA in late January and has remained there since. Those signals may reflect bearishness in the long and short terms.
Third, stochastics are turning lower.
Finally, there’s the drop between January 29 and February 4. The chip-software company retraced no more than half that move before stalling at the 21-day EMA, which may confirm a downward direction.
TradeStation has, for decades, advanced the trading industry, providing access to stocks, options and futures. If you're born to trade, we could be for you. Learn more here about TradingView’s Broker of the Year!
Past performance, whether actual or indicated by historical tests of strategies, is no guarantee of future performance or success. There is a possibility that you may sustain a loss equal to or greater than your entire investment regardless of which asset class you trade (equities, options or futures); therefore, you should not invest or risk money that you cannot afford to lose. Online trading is not suitable for all investors. View the document titled Characteristics and Risks of Standardized Options at www.TradeStation.com . Before trading any asset class, customers must read the relevant risk disclosure statements on www.TradeStation.com . System access and trade placement and execution may be delayed or fail due to market volatility and volume, quote delays, system and software errors, Internet traffic, outages and other factors.
Securities and futures trading is offered to self-directed customers by TradeStation Securities, Inc., a broker-dealer registered with the Securities and Exchange Commission and a futures commission merchant licensed with the Commodity Futures Trading Commission). TradeStation Securities is a member of the Financial Industry Regulatory Authority, the National Futures Association, and a number of exchanges.
TradeStation Securities, Inc. and TradeStation Technologies, Inc. are each wholly owned subsidiaries of TradeStation Group, Inc., both operating, and providing products and services, under the TradeStation brand and trademark. When applying for, or purchasing, accounts, subscriptions, products and services, it is important that you know which company you will be dealing with. Visit www.TradeStation.com for further important information explaining what this means. Amazon.com Has Fallen. Can it Get Up?Amazon.com fell sharply last month, and some traders may see further downside risk.
The first pattern on today’s chart is the drop on February 6 after earnings missed estimates.
The e-commerce giant has yet to recover from that decline, which may reflect negative sentiment.
Second is the low of $220.38 immediately before the drop. AMZN rebounded to stall at that level on March 5. Has old support become new resistance?
Third, a series of higher lows in the last few weeks may be viewed as a potentially bearish flag.
Fourth, stochastics are turning down from an overbought condition.
Next, the 8-day exponential moving average (EMA) has remained stubbornly below the 21-day EMA. The 50-day simple moving average (SMA) also had a “death cross” below the 200-day SMA. Those patterns may reflect bearishness in the short and long terms.
Finally, AMZN is a highly active underlier in the options market. (Its average daily volume of 886,500 contracts ranks fourth in the S&P 500, according to TradeStation data.) That could help traders take positions with calls and puts.
TradeStation has, for decades, advanced the trading industry, providing access to stocks, options and futures. If you're born to trade, we could be for you. See our Overview for more.
Past performance, whether actual or indicated by historical tests of strategies, is no guarantee of future performance or success. There is a possibility that you may sustain a loss equal to or greater than your entire investment regardless of which asset class you trade (equities, options or futures); therefore, you should not invest or risk money that you cannot afford to lose. Online trading is not suitable for all investors. View the document titled Characteristics and Risks of Standardized Options at www.TradeStation.com . Before trading any asset class, customers must read the relevant risk disclosure statements on www.TradeStation.com . System access and trade placement and execution may be delayed or fail due to market volatility and volume, quote delays, system and software errors, Internet traffic, outages and other factors.
Securities and futures trading is offered to self-directed customers by TradeStation Securities, Inc., a broker-dealer registered with the Securities and Exchange Commission and a futures commission merchant licensed with the Commodity Futures Trading Commission). TradeStation Securities is a member of the Financial Industry Regulatory Authority, the National Futures Association, and a number of exchanges.
Options trading is not suitable for all investors. Your TradeStation Securities’ account application to trade options will be considered and approved or disapproved based on all relevant factors, including your trading experience. See www.TradeStation.com . Visit www.TradeStation.com for full details on the costs and fees associated with options.
Margin trading involves risks, and it is important that you fully understand those risks before trading on margin. The Margin Disclosure Statement outlines many of those risks, including that you can lose more funds than you deposit in your margin account; your brokerage firm can force the sale of securities in your account; your brokerage firm can sell your securities without contacting you; and you are not entitled to an extension of time on a margin call. Review the Margin Disclosure Statement at www.TradeStation.com .
TradeStation Securities, Inc. and TradeStation Technologies, Inc. are each wholly owned subsidiaries of TradeStation Group, Inc., both operating, and providing products and services, under the TradeStation brand and trademark. When applying for, or purchasing, accounts, subscriptions, products and services, it is important that you know which company you will be dealing with. Visit www.TradeStation.com for further important information explaining what this means.
 Long
Long
Aussie Holds Firm as RBA Path Anchors SentimentAUD/USD held a strong tone on March 10 as investors continued to weigh the Reserve Bank of Australia’s policy outlook against a rocky U.S. macro backdrop – and hope that the U.S.-Israel war against Iran will conclude soon. The RBA’s February rate increase to 3.85% and persistent inflation pressures have kept markets alert to the possibility of additional tightening if price growth proves sticky. Recent sentiment indicators in Australia showed a modest rebound in consumer confidence, though readings remain below neutral as higher fuel costs and geopolitical tensions weigh on household outlooks.
In the above chart, AUD/USD rates may have started the next leg higher in a bullish breakout. Recent choppiness found support in the form of the 2024 high near 0.6943. Price action took the form of a bull flag – breaking out, retesting the breakout, and consolidating in a range before continuing to fresh yearly highs today – adds evidence to support that view. Momentum is building to the topside anew, with each of the 5-day, 20-day, 50-day, and 100-day exponential moving averages (EMA) securing positive rates of change. The 2023 high at 0.7158, as a last hurdle to clear before the bull flag breakout is validated, potentially seeking a measured move north of 0.7230.  Long
Long
Kraft Heinz: Potential Bear FlagKraft Heinz has been falling for years, and some traders may see further downside in the consumer staples giant.
The first pattern on today’s chart is the series of higher lows since late January. KHC closed below that rising line yesterday, which could be viewed as a bear-flag breakdown.
Second, the 50-day simple moving average (SMA) has remained below the 100-day SMA. You also have a series of lower highs since October. Those signals may reflect a longer-term downtrend.
Prices are under the 21-day exponential moving average (EMA) and MACD just turned lower. That may be consistent with short-term bearishness.
Finally, KHC made a six-year low of $21.99 on January 21. Could investors expect a retest of that level?
TradeStation has, for decades, advanced the trading industry, providing access to stocks, options and futures. If you're born to trade, we could be for you. Learn more here about TradingView’s Broker of the Year!
Past performance, whether actual or indicated by historical tests of strategies, is no guarantee of future performance or success. There is a possibility that you may sustain a loss equal to or greater than your entire investment regardless of which asset class you trade (equities, options or futures); therefore, you should not invest or risk money that you cannot afford to lose. Online trading is not suitable for all investors. View the document titled Characteristics and Risks of Standardized Options at www.TradeStation.com . Before trading any asset class, customers must read the relevant risk disclosure statements on www.TradeStation.com . System access and trade placement and execution may be delayed or fail due to market volatility and volume, quote delays, system and software errors, Internet traffic, outages and other factors.
Securities and futures trading is offered to self-directed customers by TradeStation Securities, Inc., a broker-dealer registered with the Securities and Exchange Commission and a futures commission merchant licensed with the Commodity Futures Trading Commission). TradeStation Securities is a member of the Financial Industry Regulatory Authority, the National Futures Association, and a number of exchanges.
TradeStation Securities, Inc. and TradeStation Technologies, Inc. are each wholly owned subsidiaries of TradeStation Group, Inc., both operating, and providing products and services, under the TradeStation brand and trademark. When applying for, or purchasing, accounts, subscriptions, products and services, it is important that you know which company you will be dealing with. Visit www.TradeStation.com for further important information explaining what this means. K