Short
Short
XAU/USD 19 March 2026 Intraday AnalysisH4 Analysis:
-> Swing: Bullish.
-> Internal: Bullish.
Analysis and bias to remain the same as analysis dated 02 February 2026.
Price has printed as per analysis dated 22 January where I mentioned price to print bearish CHoCH to indicate bearish pullback phase initiation.
Price is now trading within an established internal range.
Intraday expectation:
Price to react at either discount of 50% internal EQ, or H4 supply zone before targeting weak internal high priced at 5,602,225.
Note:
The Federal Reserve’s renewed easing cycle, alongside a weaker U.S. dollar and persistent geopolitical tensions, continues to drive volatility in the gold market.
Traders should remain cautious and adjust risk management strategies to navigate sharp price swings.
Additionally, gold pricing is highly sensitive to U.S. policy under President Trump, where tariff measures, fiscal uncertainty, and shifting geopolitical strategy amplify market repricing risks and reinforce safe‑haven demand.
H4 Chart:
M15 Analysis:
-> Swing: Bullish.
-> Internal: Bearish.
Price has printed according to my analysis dated 16 March 2026 where I mentioned price to trade up to either premium of 50% EQ or M15 supply zone before targeting weak internal low priced at 4686.885.
Price had previously printed a bullish CHoCH, however, pullback was insignificant, therefore, I shall not map this is such.
Price is currently trading within an internal high and fractal low with CHoCH positioning denoted with a blue horizontal dotted line, however, I shall monitor price with respect to depth of pullback.
Intraday expectation:
Price to print bullish CHoCH to indicate bullish pullback phase initiation, thereafter, price to trade up to either premium of 50% EQ or M15 supply zone before targeting weak internal low priced at 4967.775.
Note:
Gold remains highly reactive as geopolitical risk dominates market sentiment. The latest escalation between the US, Israel, and Iran has injected a fresh safe‑haven bid into XAU/USD, with traders bracing for further headline‑driven volatility. Safe‑haven flows remain elevated as markets weigh the risk of broader regional spillover and the potential for sudden sentiment shocks.
At the same time, shifting US tariff policy under President Trump is adding another layer of macro uncertainty, amplifying risk‑off moves and fuelling sharp intraday swings. With liquidity pockets and whipsaw‑like behaviour becoming more common, disciplined risk management is essential in this environment.
Gold’s geopolitical premium remains firmly intact and until tensions ease, volatility is likely to stay front‑loaded.
M15 Chart:  Short
Short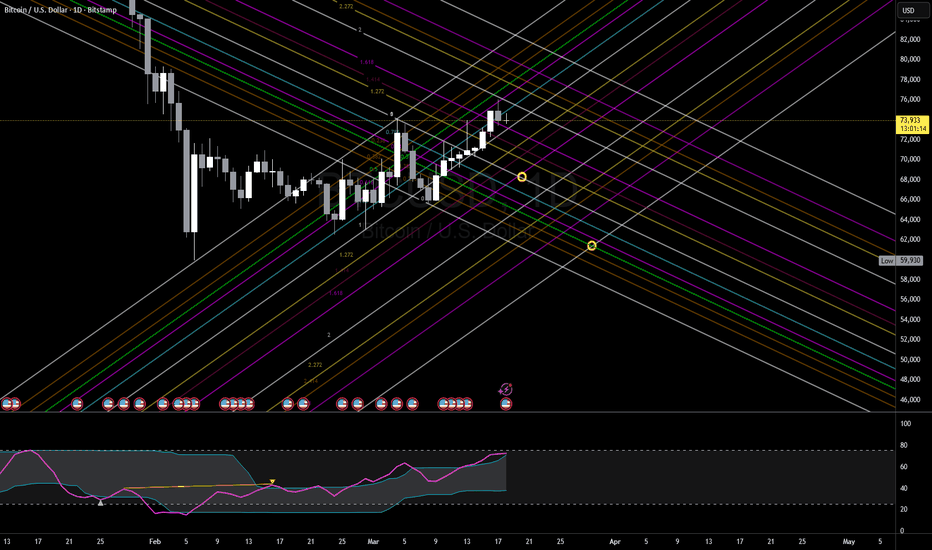
XAU/USD 18 March 2026 Intraday AnalysisH4 Analysis:
-> Swing: Bullish.
-> Internal: Bullish.
Analysis and bias to remain the same as analysis dated 02 February 2026.
Price has printed as per analysis dated 22 January where I mentioned price to print bearish CHoCH to indicate bearish pullback phase initiation.
Price is now trading within an established internal range.
Intraday expectation:
Price to react at either discount of 50% internal EQ, or H4 supply zone before targeting weak internal high priced at 5,602,225.
Note:
The Federal Reserve’s renewed easing cycle, alongside a weaker U.S. dollar and persistent geopolitical tensions, continues to drive volatility in the gold market.
Traders should remain cautious and adjust risk management strategies to navigate sharp price swings.
Additionally, gold pricing is highly sensitive to U.S. policy under President Trump, where tariff measures, fiscal uncertainty, and shifting geopolitical strategy amplify market repricing risks and reinforce safe‑haven demand.
H4 Chart:
M15 Analysis:
-> Swing: Bullish.
-> Internal: Bearish.
Analysis and bias to remain the same as yesterday's analysis dated 16 March 2026.
Price has printed according to my analysis dated 03 March 2026 where I mentioned price to target weak internal low priced at 4996.275.
Price has printed a bullish CHoCH to indicate bullish pullback phase initiation.
Price is now trading within an established internal range, however, I will continue to monitor price with respect to depth of pullback.
Intraday expectation:
Price to trade up to either premium of 50% EQ or M15 supply zone before targeting weak internal low priced at 4967.775.
Note:
Gold remains highly reactive as geopolitical risk dominates market sentiment. The latest escalation between the US, Israel, and Iran has injected a fresh safe‑haven bid into XAU/USD, with traders bracing for further headline‑driven volatility. Safe‑haven flows remain elevated as markets weigh the risk of broader regional spillover and the potential for sudden sentiment shocks.
At the same time, shifting US tariff policy under President Trump is adding another layer of macro uncertainty, amplifying risk‑off moves and fuelling sharp intraday swings. With liquidity pockets and whipsaw‑like behaviour becoming more common, disciplined risk management is essential in this environment.
Gold’s geopolitical premium remains firmly intact and until tensions ease, volatility is likely to stay front‑loaded.
M15 Chart: XAU/USD 17 March 2026 Intraday AnalysisH4 Analysis:
-> Swing: Bullish.
-> Internal: Bullish.
Analysis and bias to remain the same as analysis dated 02 February 2026.
Price has printed as per analysis dated 22 January where I mentioned price to print bearish CHoCH to indicate bearish pullback phase initiation.
Price is now trading within an established internal range.
Intraday expectation:
Price to react at either discount of 50% internal EQ, or H4 supply zone before targeting weak internal high priced at 5,602,225.
Note:
The Federal Reserve’s renewed easing cycle, alongside a weaker U.S. dollar and persistent geopolitical tensions, continues to drive volatility in the gold market.
Traders should remain cautious and adjust risk management strategies to navigate sharp price swings.
Additionally, gold pricing is highly sensitive to U.S. policy under President Trump, where tariff measures, fiscal uncertainty, and shifting geopolitical strategy amplify market repricing risks and reinforce safe‑haven demand.
H4 Chart:
M15 Analysis:
-> Swing: Bullish.
-> Internal: Bearish.
Analysis and bias to remain the same as yesterday's analysis dated 16 March 2026.
Price has printed according to my analysis dated 03 March 2026 where I mentioned price to target weak internal low priced at 4996.275.
Price has printed a bullish CHoCH to indicate bullish pullback phase initiation.
Price is now trading within an established internal range, however, I will continue to monitor price with respect to depth of pullback.
Intraday expectation:
Price to trade up to either premium of 50% EQ or M15 supply zone before targeting weak internal low priced at 4967.775.
Note:
Gold remains highly reactive as geopolitical risk dominates market sentiment. The latest escalation between the US, Israel, and Iran has injected a fresh safe‑haven bid into XAU/USD, with traders bracing for further headline‑driven volatility. Safe‑haven flows remain elevated as markets weigh the risk of broader regional spillover and the potential for sudden sentiment shocks.
At the same time, shifting US tariff policy under President Trump is adding another layer of macro uncertainty, amplifying risk‑off moves and fuelling sharp intraday swings. With liquidity pockets and whipsaw‑like behaviour becoming more common, disciplined risk management is essential in this environment.
Gold’s geopolitical premium remains firmly intact and until tensions ease, volatility is likely to stay front‑loaded.
M15 Chart:  Long
Long
XAU/USD 16 March 2026 Intraday AnalysisH4 Analysis:
-> Swing: Bullish.
-> Internal: Bullish.
Analysis and bias to remain the same as analysis dated 02 February 2026.
Price has printed as per analysis dated 22 January where I mentioned price to print bearish CHoCH to indicate bearish pullback phase initiation.
Price is now trading within an established internal range.
Intraday expectation:
Price to react at either discount of 50% internal EQ, or H4 supply zone before targeting weak internal high priced at 5,602,225.
Note:
The Federal Reserve’s renewed easing cycle, alongside a weaker U.S. dollar and persistent geopolitical tensions, continues to drive volatility in the gold market.
Traders should remain cautious and adjust risk management strategies to navigate sharp price swings.
Additionally, gold pricing is highly sensitive to U.S. policy under President Trump, where tariff measures, fiscal uncertainty, and shifting geopolitical strategy amplify market repricing risks and reinforce safe‑haven demand.
H4 Chart:
M15 Analysis:
-> Swing: Bullish.
-> Internal: Bearish.
Price has printed according to my analysis dated 03 March 2026 where I mentioned price to target weak internal low priced at 4996.275.
Price has printed a bullish CHoCH to indicate bullish pullback phase initiation.
Price is now trading within an established internal range, however, I will continue to monitor price with respect to depth of pullback.
Intraday expectation:
Price to trade up to either premium of 50% EQ or M15 supply zone before targeting weak internal low priced at 4967.775.
Note:
Gold remains highly reactive as geopolitical risk dominates market sentiment. The latest escalation between the US, Israel, and Iran has injected a fresh safe‑haven bid into XAU/USD, with traders bracing for further headline‑driven volatility. Safe‑haven flows remain elevated as markets weigh the risk of broader regional spillover and the potential for sudden sentiment shocks.
At the same time, shifting US tariff policy under President Trump is adding another layer of macro uncertainty, amplifying risk‑off moves and fuelling sharp intraday swings. With liquidity pockets and whipsaw‑like behaviour becoming more common, disciplined risk management is essential in this environment.
Gold’s geopolitical premium remains firmly intact and until tensions ease, volatility is likely to stay front‑loaded.
M15 Chart:
Long 
 Short
Short

 Short
Short
XAU/USD 13 March 2026 Intraday AnalysisH4 Analysis:
-> Swing: Bullish.
-> Internal: Bullish.
Analysis and bias to remain the same as analysis dated 02 February 2026.
Price has printed as per analysis dated 22 January where I mentioned price to print bearish CHoCH to indicate bearish pullback phase initiation.
Price is now trading within an established internal range.
Intraday expectation:
Price to react at either discount of 50% internal EQ, or H4 supply zone before targeting weak internal high priced at 5,602,225.
Note:
The Federal Reserve’s renewed easing cycle, alongside a weaker U.S. dollar and persistent geopolitical tensions, continues to drive volatility in the gold market.
Traders should remain cautious and adjust risk management strategies to navigate sharp price swings.
Additionally, gold pricing is highly sensitive to U.S. policy under President Trump, where tariff measures, fiscal uncertainty, and shifting geopolitical strategy amplify market repricing risks and reinforce safe‑haven demand.
H4 Chart:
M15 Analysis:
-> Swing: Bullish.
-> Internal: Bearish.
Bias and analysis to remain the same as analysis dated 03 March 2026.
Price did not print according to analysis dated 02 March 2026. Price instead printed a bearish iBOS which would indicate that all HTF's remain in bearish pullback phase.
Price has printed a bullish CHoCH to indicate bullish pullback phase initiation.
We are now trading within an established internal range.
Intraday expectation:
Price to trade up to either premium of 50% EQ or M15 supply zone before targeting weak internal low priced at 4996.275
Note:
Gold remains highly reactive as geopolitical risk dominates market sentiment. The latest escalation between the US, Israel, and Iran has injected a fresh safe‑haven bid into XAU/USD, with traders bracing for further headline‑driven volatility. Safe‑haven flows remain elevated as markets weigh the risk of broader regional spillover and the potential for sudden sentiment shocks.
At the same time, shifting US tariff policy under President Trump is adding another layer of macro uncertainty, amplifying risk‑off moves and fuelling sharp intraday swings. With liquidity pockets and whipsaw‑like behaviour becoming more common, disciplined risk management is essential in this environment.
Gold’s geopolitical premium remains firmly intact and until tensions ease, volatility is likely to stay front‑loaded.
M15 Chart: Final Shakeout Likely Before Reversal and AccumulationHi all,
Considering the current global macro environment, liquidity conditions, and seasonal market behavior, I’m anticipating one final downside move in Bitcoin, potentially dipping below $60K, followed by several weeks of accumulation. This scenario aligns with the broader cycle structure we’ve been tracking.
As mentioned in my previous analysis, I opened put option positions in the $70K–$74K range. My plan is to gradually close (sell) these put options as price declines, starting around $63K and continuing down to approximately $55K. At the same time, I intend to rotate that capital into June and later dated call options, positioning for the next upward phase after the accumulation period.
From a structural perspective, the 2022 bear market fractal remains a useful reference. However, if a similar pattern unfolds now, I expect it to play out with reduced magnitude. The reason is that the recent bull phase did not fully reach its most optimistic targets, which often implies that the corresponding downside may also fall short of the most extreme bearish projections.
On the chart, this idea is represented by two potential fractal paths:
• Dark red fractal: the full historical fractal replication.
• Dark blue fractal: a partial or “misfilled” fractal, implying a shallower correction.
If Bitcoin does move below $60K, my expectation is that price action will likely develop somewhere between these two trajectories, though closer to the dark blue path, suggesting a more moderate correction rather than a full fractal repeat.
As always, these are personal views and strategy considerations, not financial advice. Please do your own research and manage risk accordingly.
Cheers! Short 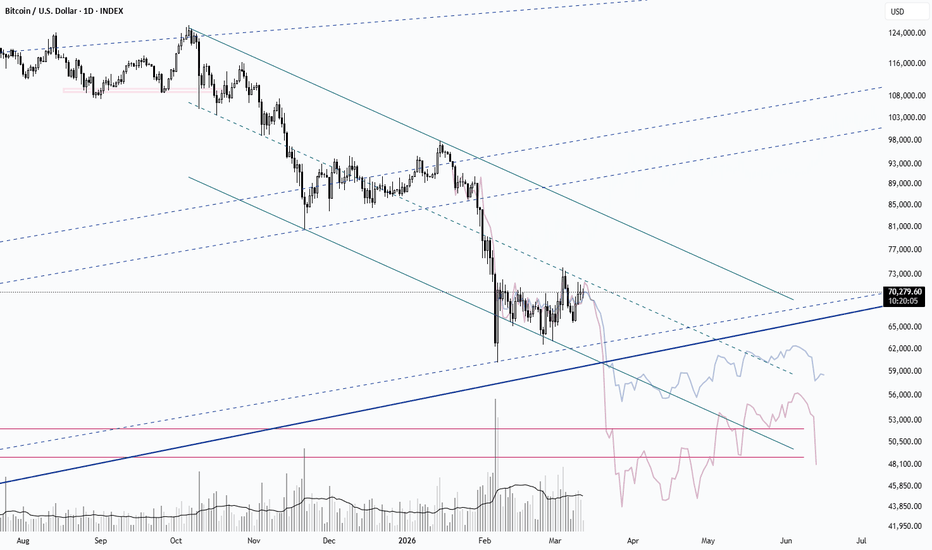
XAU/USD 12 March 2026 Intraday AnalysisH4 Analysis:
-> Swing: Bullish.
-> Internal: Bullish.
Analysis and bias to remain the same as analysis dated 02 February 2026.
Price has printed as per analysis dated 22 January where I mentioned price to print bearish CHoCH to indicate bearish pullback phase initiation.
Price is now trading within an established internal range.
Intraday expectation:
Price to react at either discount of 50% internal EQ, or H4 supply zone before targeting weak internal high priced at 5,602,225.
Note:
The Federal Reserve’s renewed easing cycle, alongside a weaker U.S. dollar and persistent geopolitical tensions, continues to drive volatility in the gold market.
Traders should remain cautious and adjust risk management strategies to navigate sharp price swings.
Additionally, gold pricing is highly sensitive to U.S. policy under President Trump, where tariff measures, fiscal uncertainty, and shifting geopolitical strategy amplify market repricing risks and reinforce safe‑haven demand.
H4 Chart:
M15 Analysis:
-> Swing: Bullish.
-> Internal: Bearish.
Bias and analysis to remain the same as analysis dated 03 March 2026.
Price did not print according to analysis dated 02 March 2026. Price instead printed a bearish iBOS which would indicate that all HTF's remain in bearish pullback phase.
Price has printed a bullish CHoCH to indicate bullish pullback phase initiation.
We are now trading within an established internal range.
Intraday expectation:
Price to trade up to either premium of 50% EQ or M15 supply zone before targeting weak internal low priced at 4996.275
Note:
Gold remains highly reactive as geopolitical risk dominates market sentiment. The latest escalation between the US, Israel, and Iran has injected a fresh safe‑haven bid into XAU/USD, with traders bracing for further headline‑driven volatility. Safe‑haven flows remain elevated as markets weigh the risk of broader regional spillover and the potential for sudden sentiment shocks.
At the same time, shifting US tariff policy under President Trump is adding another layer of macro uncertainty, amplifying risk‑off moves and fuelling sharp intraday swings. With liquidity pockets and whipsaw‑like behaviour becoming more common, disciplined risk management is essential in this environment.
Gold’s geopolitical premium remains firmly intact and until tensions ease, volatility is likely to stay front‑loaded.
M15 Chart: XAU/USD 11 March 2026 Intraday AnalysisH4 Analysis:
-> Swing: Bullish.
-> Internal: Bullish.
Analysis and bias to remain the same as analysis dated 02 February 2026.
Price has printed as per analysis dated 22 January where I mentioned price to print bearish CHoCH to indicate bearish pullback phase initiation.
Price is now trading within an established internal range.
Intraday expectation:
Price to react at either discount of 50% internal EQ, or H4 supply zone before targeting weak internal high priced at 5,602,225.
Note:
The Federal Reserve’s renewed easing cycle, alongside a weaker U.S. dollar and persistent geopolitical tensions, continues to drive volatility in the gold market.
Traders should remain cautious and adjust risk management strategies to navigate sharp price swings.
Additionally, gold pricing is highly sensitive to U.S. policy under President Trump, where tariff measures, fiscal uncertainty, and shifting geopolitical strategy amplify market repricing risks and reinforce safe‑haven demand.
H4 Chart:
M15 Analysis:
-> Swing: Bullish.
-> Internal: Bearish.
Bias and analysis to remain the same as analysis dated 03 March 2026.
Price did not print according to analysis dated 02 March 2026. Price instead printed a bearish iBOS which would indicate that all HTF's remain in bearish pullback phase.
Price has printed a bullish CHoCH to indicate bullish pullback phase initiation.
We are now trading within an established internal range.
Intraday expectation:
Price to trade up to either premium of 50% EQ or M15 supply zone before targeting weak internal low priced at 4996.275
Note:
Gold remains highly reactive as geopolitical risk dominates market sentiment. The latest escalation between the US, Israel, and Iran has injected a fresh safe‑haven bid into XAU/USD, with traders bracing for further headline‑driven volatility. Safe‑haven flows remain elevated as markets weigh the risk of broader regional spillover and the potential for sudden sentiment shocks.
At the same time, shifting US tariff policy under President Trump is adding another layer of macro uncertainty, amplifying risk‑off moves and fuelling sharp intraday swings. With liquidity pockets and whipsaw‑like behaviour becoming more common, disciplined risk management is essential in this environment.
Gold’s geopolitical premium remains firmly intact and until tensions ease, volatility is likely to stay front‑loaded.
M15 Chart: XAU/USD 10 March 2026 Intraday AnalysisH4 Analysis:
-> Swing: Bullish.
-> Internal: Bullish.
Analysis and bias to remain the same as analysis dated 02 February 2026.
Price has printed as per analysis dated 22 January where I mentioned price to print bearish CHoCH to indicate bearish pullback phase initiation.
Price is now trading within an established internal range.
Intraday expectation:
Price to react at either discount of 50% internal EQ, or H4 supply zone before targeting weak internal high priced at 5,602,225.
Note:
The Federal Reserve’s renewed easing cycle, alongside a weaker U.S. dollar and persistent geopolitical tensions, continues to drive volatility in the gold market.
Traders should remain cautious and adjust risk management strategies to navigate sharp price swings.
Additionally, gold pricing is highly sensitive to U.S. policy under President Trump, where tariff measures, fiscal uncertainty, and shifting geopolitical strategy amplify market repricing risks and reinforce safe‑haven demand.
H4 Chart:
M15 Analysis:
-> Swing: Bullish.
-> Internal: Bearish.
Bias and analysis to remain the same as analysis dated 03 March 2026.
Price did not print according to analysis dated 02 March 2026. Price instead printed a bearish iBOS which would indicate that all HTF's remain in bearish pullback phase.
Price has printed a bullish CHoCH to indicate bullish pullback phase initiation.
We are now trading within an established internal range.
Intraday expectation:
Price to trade up to either premium of 50% EQ or M15 supply zone before targeting weak internal low priced at 4996.275
Note:
Gold remains highly reactive as geopolitical risk dominates market sentiment. The latest escalation between the US, Israel, and Iran has injected a fresh safe‑haven bid into XAU/USD, with traders bracing for further headline‑driven volatility. Safe‑haven flows remain elevated as markets weigh the risk of broader regional spillover and the potential for sudden sentiment shocks.
At the same time, shifting US tariff policy under President Trump is adding another layer of macro uncertainty, amplifying risk‑off moves and fuelling sharp intraday swings. With liquidity pockets and whipsaw‑like behaviour becoming more common, disciplined risk management is essential in this environment.
Gold’s geopolitical premium remains firmly intact and until tensions ease, volatility is likely to stay front‑loaded.
M15 Chart: