DAX W30 - four references inside 50 pointsTHE FRAME
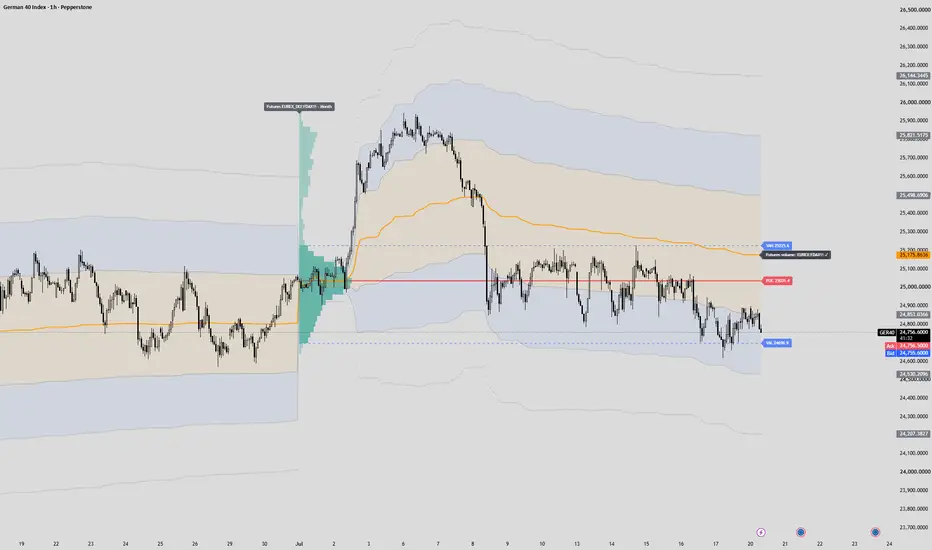
The week closed at 24,842.1. Below July's point of control, below the first standard deviation of the monthly VWAP, bottom third of the value area.
Volume for all of this comes from the FDAX contract, not from CFD tick counts, and gets mapped onto the price of the chart it is drawn on.
Value area high 25,225.6 Point of control 25,035.4 Value area low 24,698.9 Monthly VWAP 25,176.2 VWAP -1 sigma 24,853.4 Friday's close 24,842.1
WHERE THINGS STACK
Four references sit overhead inside 50.2 points:
25,126.0 gamma flip (7-45 DTE structure map) 25,150.5 Wednesday high 25,168.1 Monday high 25,176.2 monthly VWAP
An options-positioning model, two weekday highs and a volume-weighted average. None of the three knows the other two exist. This week they land on the same band anyway.
Downside has stations, not a void:
24,698.9 value area low 24,530.6 VWAP -2 sigma 24,500.0 put wall 24,207.8 VWAP -3 sigma
The put wall and the -2 sigma band are 30.6 points apart. Two methods, one shelf.
WHAT THE FRAME IMPLIES
Price sits under all of it, and the gamma model reads short gamma — moves get amplified instead of dampened. So the frame points down. The point of control at 25,035.4 is the first thing any bounce has to get through; going the other way, 24,698.9 comes first and 24,530.6 sits behind it.
One-day expected move is 242 points. That is the scale for a single session.
WHAT INVALIDATES IT
A daily close above 25,176.2. Above the whole band, not just into it. That puts price back inside value, flips the gamma reading, and everything above becomes history. It gets updated here when it happens.
And if neither 24,698.9 nor 25,176.2 is reached by Thursday, the reading was not wrong. It was useless. That verdict gets posted too.
THE LIMITS
The hit rate of a confluence like this has never been measured here, so nothing above is a probability statement.
In own backtesting the gamma flip sits above spot on roughly 85% of days, which means being below it carries almost no information by itself. It only counts here because three unrelated references agree with it.
And when these gamma levels were tested as magnets, the correlation came out at 0.21 or lower. Shelves, not walls.  Short
Short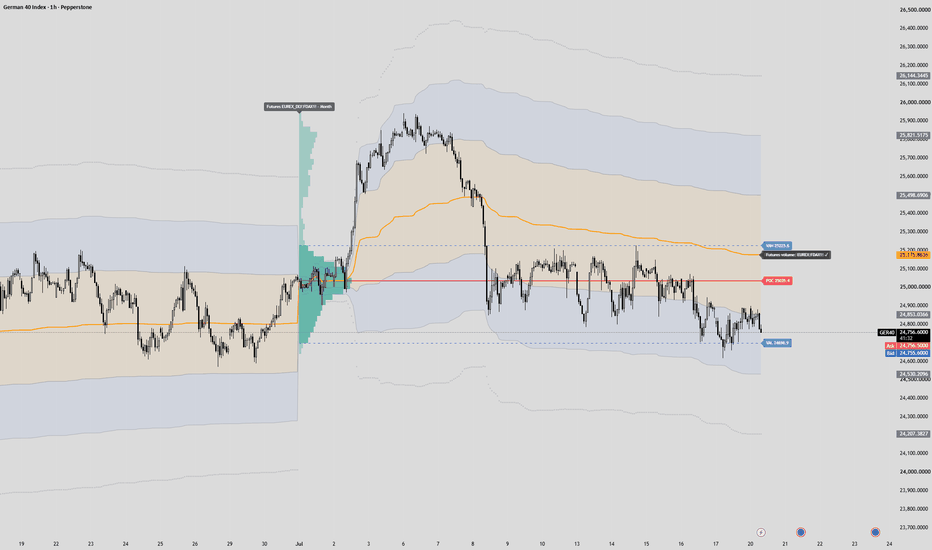
SPX – Double Bounce Off 50 SMA, 7600 Call Wall Confluence SPX is showing a constructive daily structure after two recent rebounds off the 50 SMA — first in June, then again in July. Each dip found buyers at that moving average before price pushed back higher.
Price is now trading around 7554, well above the 7495 HVL, which keeps SPX inside a positive GEX regime. In this environment, moves tend to be more controlled than below HVL, and upside can extend as long as the structure holds.
The next major reference is 7600 — the highest call NETGEX wall and the largest absolute gamma concentration on the profile.
🔶 Regime Context 🔶
With spot firmly above 7495 HVL, SPX remains in a positive GEX regime. The transition zone between 7400 P1 and 7600 C1 is where direction is being decided — but the gamma flip level has already been cleared, which favors controlled upside rather than reactive volatility.
🔶 Options Structure Context 🔶
👉 7600 – C1 (highest call NETGEX wall)
Confluence at 7600:
C1 — highest call NETGEX
Ab1 — largest absolute gamma
That makes 7600 a clear reaction zone — not just a round number. Price is now approaching this level after holding above HVL and bouncing twice from the 50 SMA.
🔶 Downside Structure 🔶
👉 7495 – HVL — regime pivot; must hold to keep positive GEX intact
👉 7400 – P1 — strongest put wall / primary downside support
A clean break below 7495 would shift the structure back toward a more reactive regime. 7400 remains the main put-side floor below.
🔶 Options Sentiment 🔶
PUT$ 57.3% (42 DTE) means put options at an equivalent distance from spot are priced 57.3% higher than the corresponding calls — this is put pricing skew. At this level, downside hedging demand is present but not extreme, which fits a mildly constructive rather than heavily defensive positioning tone.
Put pricing skew remains moderate rather than at defensive extremes — hedging urgency has not escalated into panic-style levels.
IVRank 31
IVx 15.6 (42 DTE)
PUT$ 57.3% (42 DTE) — put pricing skew
Implied move ±0.34% (±25.3)
🔶 Key Structure to Watch 🔶
7600 – C1 + Ab1 confluence — next major upside reaction zone
7495 – HVL — regime pivot; positive GEX depends on holding above
7400 – P1 — primary put wall / downside floor
50 SMA – dynamic support; two recent bounces confirm its role
For now, SPX is holding a positive GEX structure above HVL after two clean 50 SMA rebounds, with 7600 as the next major test.
The key question is whether momentum can reach the 7600 call wall confluence — and how price reacts once it gets there. ETH GEX - Price Rejection at 1790 Call Wall AgainETH is showing a structurally important pullback after failing at the highest call NETGEX wall for the second time.
On the daily chart, price recently formed a double bottom near the 1590 zone — where the strongest put wall (P1) and HVL align — and rallied back into the upper transition area. That bounce held the downside structure, but the upside test at 1790 has now been rejected again, with today's red candle marking the second failure at the C1 call wall.
This matters because 1590 is not just put wall — it is also the gamma flip / regime pivot. As long as price holds above it, ETH remains in a positive GEX regime. A sustained break below would shift conditions into a more reactive negative gamma environment.
🔶 Regime Context
Price is trading above HVL at 1590, keeping ETH inside a positive GEX regime for now. However, with spot sitting between P1 and C1, the market is still inside the transition zone — where direction can shift quickly depending on which major wall accepts or rejects price next.
🔶 Options Structure Context
👉 1790 – C1 (highest call NETGEX wall)
Price has now tested 1790 for the second time, and each approach has resulted in rejection from the largest call-side gamma concentration. Until 1790 is clearly accepted and held, the positive extension zone above C1 — and any gamma squeeze potential toward the next call wall — remains off the table.
🔶 Downside Structure
👉 1590 – P1 / HVL — strongest put wall + regime pivot
Confluence at 1590:
P1 — strongest put NETGEX
HVL — gamma flip / regime pivot
That makes 1590 the key reaction zone on any pullback — not just a round number, but the level where put support and the positive/negative GEX boundary meet.
👉 P2 — next put wall below if 1590 fails
🔶 Options Sentiment
CALL$ 12.1% means call options at an equivalent distance from spot are priced 12.1% higher than the corresponding puts — this is call pricing skew, though still relatively moderate rather than extreme.
On the Options Oscillator, the green histogram was elevated through the rally off the double bottom, but the right edge is fading after the second rejection at 1790 — call pricing skew appears to be declining from its recent peak.
IVRank 13.8
IVx 58.1
CALL$ 12.1% — call pricing skew
Implied move ±2.61%
🔶 Key Structure to Watch
1790 (C1) — upside ceiling until acceptance; second rejection now in play
1590 (P1 / HVL) — primary support + regime pivot; must hold on pullback
50 SMA — dynamic resistance overhead; price is currently trading below it after the C1 rejection
For now, ETH is caught between 1590 put/HVL support below and 1790 call resistance above after a double-bottom bounce that stalled at C1 again.
The key question is whether price can hold above 1590 on this pullback — or whether momentum re-tests the P1/HVL zone and forces a regime reassessment. Gamma – The Invisible Hand of the Market Part (3)Gamma – The Invisible Hand of the Market
Part 3 – Gamma Walls
Why Markets Reverse at Precise Price Levels
In Part 2, we explored how dealer hedging can fundamentally change the behaviour of financial markets.
We learned that the exact same hedging process can produce completely different outcomes depending on the surrounding Gamma environment.
When dealers operate in a Positive Gamma environment, their hedging activity often absorbs volatility and encourages price to remain balanced.
In a Negative Gamma environment, however, the same risk management process can amplify volatility and fuel powerful directional moves.
This naturally leads to an important question.
If dealer hedging has the power to influence market behaviour so profoundly...
Where does this mechanism actually become visible on a price chart?
The answer often lies at very specific price levels.
Levels where thousands of independent option positions become concentrated.
Levels where dealers are forced to adjust their hedges more aggressively than usual.
Levels where liquidity, risk management and option exposure temporarily converge.
These areas are commonly known as Gamma Walls.
Although invisible to most market participants, Gamma Walls often become some of the most influential price levels in the market.
Many traders spend years searching for the perfect support or resistance indicator.
Others rely on trend lines, moving averages or Fibonacci levels to explain why price suddenly reverses.
Sometimes those tools appear to work remarkably well.
Sometimes they fail without any obvious reason.
Gamma Walls offer a different perspective.
Instead of asking where traders believe support or resistance should exist...
They ask where option exposure forces dealers to actively manage risk.
That distinction is important.
Because markets do not move according to opinions.
They move because orders enter the market.
And dealer hedging is, by definition, a continuous flow of real orders.
Understanding Gamma Walls does not replace technical analysis.
Instead, it often explains why certain technical levels repeatedly work while countless others are quickly forgotten.
Many of the market's most precise turning points are not random.
Nor are they necessarily the result of manipulation.
Very often, they are simply the visible consequence of invisible risk management.
---
## The Hidden Structure Behind Price
Every trading day, millions of buy and sell orders interact to create what we simply call "price."
To most traders, price appears almost chaotic.
It rises.
It falls.
Sometimes it trends smoothly.
Sometimes it reverses with astonishing precision.
Without understanding what happens behind the scenes, these movements can seem almost impossible to explain.
Yet beneath this apparent randomness lies an underlying structure.
One that is largely created by the options market.
Options are not distributed evenly across every possible price.
Instead, traders and institutions naturally concentrate their positions around specific strike prices.
Some strikes attract relatively little interest.
Others accumulate enormous open interest over time.
As more contracts become concentrated around the same strike, the dealers who provide liquidity for those positions inherit increasingly larger amounts of directional risk.
Unlike speculative traders, dealers generally do not attempt to predict whether the market will rise or fall.
Their objective is different.
They seek to remain as neutral as possible while continuously managing the risk created by their clients' positions.
To achieve this, they hedge.
And they continue hedging as market conditions evolve.
Most of the time, these adjustments happen quietly in the background.
The average trader never notices them.
But as price approaches a strike containing exceptionally large option exposure, something begins to change.
Small price movements suddenly require larger hedge adjustments.
Dealer activity increases.
Liquidity changes.
Market behaviour slowly starts to feel different.
Price may hesitate.
Momentum may fade.
Several breakout attempts may fail.
The market often appears strangely attracted to the same area over and over again.
This is the point where a Gamma Wall begins to reveal itself.
It is important to understand that a Gamma Wall is not a physical barrier.
Nothing on the chart marks its exact location.
No institution places a hidden wall designed to stop the market.
Instead, a Gamma Wall is an area where concentrated option positioning causes dealer hedging activity to become increasingly significant.
The wall itself is invisible.
Its effects are not.
The repeated reactions that traders observe around these levels are often nothing more than the visible footprint of continuous hedging flows.
This also explains why experienced traders often notice that certain price levels continue influencing the market long after traditional technical explanations become less convincing.
The chart may appear simple.
Behind it, however, thousands of independent positions are continuously interacting through mathematical risk models.
Price is simply the final result.
Before moving on, it is worth remembering one important principle.
Gamma Walls do not predict the future.
They do not guarantee reversals.
They do not eliminate risk.
What they provide is context.
They help explain why certain areas deserve far more attention than others.
For traders, that difference can be invaluable.
Because understanding *where* risk is concentrated is often just as important as understanding *where* price is trading.
Figure 1 illustrates this process visually and provides a simplified view of how dealer hedging activity gradually builds around a major Gamma Wall.
Why Markets Often Refuse to Break
Every experienced trader has witnessed days like these.
Price approaches an important level with remarkable precision.
Momentum builds.
Volume increases.
The breakout appears inevitable.
Financial news becomes increasingly optimistic.
Technical indicators align.
Everything seems to support continuation.
Then...
Nothing happens.
Price stalls.
The market hesitates.
Buyers continue entering.
Yet the market barely moves.
Minutes later it retreats.
Hours later it returns to exactly the same price.
Once again, the breakout fails.
By the third or fourth rejection, many traders begin searching for explanations.
Some blame algorithms.
Others accuse institutions of defending the level.
Some call it manipulation.
Others simply conclude that the resistance is exceptionally strong.
In reality, the explanation is often far less mysterious.
The market may simply have entered an area where dealer hedging has become unusually concentrated.
This behaviour is commonly referred to as Gamma Pinning.
Although the name may sound complex, the underlying idea is surprisingly simple.
As price approaches a strike containing significant option exposure, dealers often need to adjust their hedges continuously.
Each small movement in price slightly changes the risk of their option positions.
That change in risk requires another hedge adjustment.
Then another.
And another.
Rather than allowing price to accelerate freely, these hedging flows often begin working against short-term momentum.
Buying pressure is partially absorbed.
Selling pressure is partially absorbed.
Volatility gradually decreases.
Instead of expanding, price starts oscillating around the same area.
To many traders, it feels as though the market has become magnetically attracted to a specific price.
In reality, no invisible force is pulling price toward a strike.
Instead, thousands of independent hedge adjustments collectively create behaviour that appears almost magnetic.
The effect becomes even stronger as option open interest increases.
The larger the concentration of contracts around a particular strike, the greater the amount of risk dealers may need to manage.
Consequently, their hedging activity can become increasingly visible on the chart.
This is one of the reasons why markets sometimes spend hours trading within an unexpectedly narrow range despite heavy buying and selling activity.
Both sides appear active.
Yet neither side gains meaningful control.
The market simply remains balanced.
For traders who only observe candles, this behaviour can be deeply frustrating.
Breakout traders experience repeated false starts.
Trend traders become trapped inside seemingly random consolidations.
Mean-reversion traders often perform surprisingly well.
Without understanding the mechanics behind dealer hedging, these sessions can appear completely irrational.
However, once Gamma Pinning is recognised, the behaviour becomes far easier to interpret.
The market is not necessarily lacking buyers.
Nor is it necessarily lacking sellers.
Instead, a significant portion of incoming order flow is continuously offset by dealer hedging.
This distinction changes the way many experienced traders interpret price action.
Rather than asking,
"Why won't the market break?"
a more useful question becomes,
"Has price reached an area where dealer hedging is temporarily absorbing directional momentum?"
That single shift in perspective often explains why so many breakout attempts fail before a meaningful move finally develops.
Figure 1 illustrates how continuous dealer hedging can repeatedly slow, stabilise and temporarily pin price around a major Gamma Wall, creating the characteristic behaviour that many traders observe but rarely understand.
# Chapter 3
## When a Gamma Wall Finally Breaks
If Gamma Walls often stabilise markets...
Why do they sometimes fail completely?
This is one of the most important questions in options market structure.
Because sooner or later, every Gamma Wall is tested.
Sometimes price touches the same level five or six times before finally breaking through.
Other times, what appears to be an impenetrable barrier suddenly disappears within minutes.
To traders watching only the chart, these moves often seem completely unpredictable.
One moment the market appears perfectly balanced.
The next, volatility explodes.
The breakout accelerates.
Momentum builds rapidly.
And price travels far further than most participants expected.
So what changed?
The answer is surprisingly simple.
The wall itself did not suddenly disappear.
The concentrated option positions are often still there.
What changes is the balance between opposing market forces.
As long as dealer hedging is capable of absorbing incoming order flow, Gamma Walls often behave like shock absorbers.
Every new wave of buying is partially offset.
Every new wave of selling is partially offset.
The market remains relatively stable.
But markets are never static.
Fresh information enters the market.
Economic data surprises expectations.
Institutional positioning changes.
New option positions are opened.
Existing positions expire.
Liquidity shifts throughout the trading session.
Eventually, there comes a point where incoming directional order flow becomes stronger than the stabilising effect created by dealer hedging.
This is the tipping point.
The market is no longer being held in balance.
Instead of absorbing momentum...
Dealer hedging begins reacting to momentum.
This transition is subtle at first.
Breakout attempts become slightly stronger.
Retracements become slightly shallower.
Volatility begins expanding.
What previously looked like a perfectly defended level suddenly starts losing its influence.
Many traders mistake this moment for aggressive institutional buying or selling.
In reality, institutions may simply be responding to changing market conditions rather than causing them.
As the balance shifts, dealer hedging also changes.
Orders that previously slowed price movement may become insufficient to offset the increasing directional pressure.
Once that happens, price is no longer confined to the area surrounding the Gamma Wall.
It begins searching for the next area where risk can once again be redistributed.
This explains why some of the strongest market trends often begin immediately after prolonged periods of unusually low volatility.
The market spends hours appearing calm.
Participants become increasingly confident that the range will continue holding.
Then the balance changes.
What looked like stability was never permanent.
It was temporary equilibrium.
Once that equilibrium disappears, price can move remarkably quickly.
For experienced traders, this is an important lesson.
The objective is not to predict every breakout.
It is to recognise when market behaviour is changing.
A Gamma Wall should never be viewed as an unbreakable barrier.
It is better understood as an area where probabilities temporarily favour balance.
Eventually, every balance changes.
When it does, the market often transitions from compression to expansion.
This is why patience remains one of the most valuable skills a trader can develop.
Many failed trades do not occur because the analysis was incorrect.
They occur because the market had not yet completed its transition.
Understanding that difference fundamentally changes how traders interpret consolidation, breakouts and trend development.
Gamma Walls do not tell us exactly when a breakout will occur.
They tell us where market behaviour is most likely to change.
And in professional trading, understanding where probabilities begin to shift is often far more valuable than attempting to predict the future.
---
Practical Example
Figure 2 shows a recent DAX example where price repeatedly reacted around a major Gamma area before eventually breaking free.
Notice how several breakout attempts initially failed despite increasing participation.
Rather than immediately accelerating, price repeatedly slowed as dealer hedging absorbed part of the directional pressure.
Only after this balance gradually weakened did momentum begin expanding.
From that point onward, the market transitioned from a relatively stable environment into a directional move.
Viewed without context, this sequence appears random.
Viewed through the lens of Gamma exposure and dealer hedging, the behaviour becomes significantly easier to understand.
The chart itself has not changed.
Only the way we interpret it has.
# Key Takeaways
Before moving on to the next chapter, let's summarise the most important ideas.
• Gamma Walls are not physical barriers. They are areas where concentrated option positioning causes dealer hedging activity to become increasingly significant.
• Dealer hedging does not attempt to predict market direction. Its purpose is to continuously manage risk.
• As price approaches a major Gamma Wall, hedging flows can absorb buying and selling pressure, often reducing volatility and slowing market movement.
• This process can create the phenomenon known as Gamma Pinning, where price repeatedly returns to the same area despite multiple breakout attempts.
• Gamma Walls should never be viewed as permanent support or resistance. They represent temporary areas of balance that can change as market conditions evolve.
• When incoming directional order flow eventually exceeds the stabilising effect of dealer hedging, volatility often expands rapidly and new trends can emerge.
• Understanding Gamma Walls does not allow traders to predict the future. It provides context for why certain price levels repeatedly influence market behaviour while others do not.
Above all, remember this:
Gamma Walls are not trading signals.
They are pieces of market structure.
Like any form of analysis, they become most valuable when combined with sound risk management, patience and disciplined execution.
---
# Final Thoughts
Throughout this series, we have gradually moved further behind the visible price chart.
In Part 1, we explored how dealer hedging begins.
In Part 2, we discovered why the same hedging process can either stabilise or amplify market movements depending on the surrounding Gamma environment.
Now, in Part 3, we have seen where these forces often become visible.
Markets rarely reverse because someone simply decides they should.
More often, they react because risk becomes concentrated around specific prices, forcing thousands of independent hedging decisions to interact with one another.
Most traders only observe the final result.
Professional traders try to understand the process that creates it.
This distinction changes everything.
Once you begin recognising Gamma Walls, many market reactions that previously appeared random start following a logical structure.
The chart itself has not changed.
The candles have not changed.
The market has not changed.
Only your understanding has.
And sometimes...
That is the biggest edge a trader can develop.
---
Looking Ahead
In Part 4, we will take the next logical step.
If Gamma Walls explain why markets often slow down or reverse...
What happens when hedging activity no longer absorbs volatility but begins accelerating it instead?
This is where one of the most fascinating mechanisms in modern financial markets begins.
Gamma Squeezes.
We will explore why seemingly unstoppable trends develop, why momentum can expand far beyond what traditional technical analysis would normally expect, and why understanding dealer positioning can completely change the way traders interpret explosive market moves.
The invisible hand is still there.
We are simply about to watch it move much faster.
Education 
Gamma – The Two Personalities of the Market (Part 2)Gamma – The Two Personalities of the Market Part 2)
Why the same market absorbs every move one day—and amplifies every move the next.
In Part 1, we learned that Market Makers continuously manage their risk through Delta Hedging.
But those very hedging activities can influence the market in completely different ways.
Some days, the market feels glued to a narrow range.
Every breakout fails.
Every rally fades.
Every decline is bought back.
Price seems unwilling to trend.
On other days, a small move is all it takes.
Momentum builds.
Breakouts continue effortlessly.
Volatility explodes.
Many traders search for the explanation in the news.
Others blame market manipulation.
But the real reason often lies somewhere else.
Not in the chart.
Not in the participants.
But in the mathematical framework that forces Market Makers to adjust their hedges.
This is where the difference between Positive Gamma and Negative Gamma begins.
Two Completely Different Market Personalities
Imagine the market as a moving vehicle.
Sometimes that vehicle has an exceptionally powerful braking system.
The faster it moves, the stronger the braking force becomes.
Price briefly moves away from equilibrium before naturally returning.
On other days, those brakes seem to disappear.
Every move creates even more movement.
Buying attracts more buying.
Selling attracts more selling.
The market begins to accelerate itself.
The chart may look the same.
The mechanics underneath are completely different.
Positive Gamma – A Market With Built-In Brakes
In a Positive Gamma environment, Market Makers often hedge against the current market move.
As prices rise, they may sell futures.
As prices fall, they may buy them back.
These hedge adjustments absorb part of the market's momentum.
To traders, the market often feels like a stretched rubber band.
The further price moves away from equilibrium, the stronger the forces pulling it back.
This is why Positive Gamma environments often produce:
Failed breakouts
Range-bound markets
Lower volatility
Frequent reversals
Prices pinned around key levels
The market isn't weak.
It is constantly being stabilized.
Negative Gamma – A Market Without Brakes
Negative Gamma changes everything.
Now the hedging process often reinforces the existing move.
As prices rise, Market Makers may need to buy even more.
As prices fall, they may need to sell even more.
Hedging no longer acts as a brake.
It becomes an accelerator.
Small moves suddenly become powerful trends.
Volatility feeds on itself.
Typical characteristics include:
Strong trend days
Explosive breakouts
Short squeezes
Panic selling
Exceptionally high volatility
The market suddenly behaves completely differently.
Not because technical analysis has changed.
But because the mechanics beneath the chart have changed.
Why Does This Matter?
Many traders spend years refining their entries.
Far fewer ask the more important question:
What type of market am I trading today?
A strategy that performs exceptionally well during Positive Gamma can repeatedly fail in a Negative Gamma environment.
Likewise, breakout strategies that thrive during Negative Gamma often struggle when markets are stabilized by Positive Gamma.
The strategy hasn't changed.
The market regime has.
Conclusion
Perhaps one of the biggest mistakes traders make is assuming that markets always behave according to the same rules.
They don't.
Sometimes the market absorbs volatility.
Sometimes it amplifies it.
Recognizing which Gamma regime is currently in control may explain why the very same trading strategy performs brilliantly one week—and fails completely the next.
Before interpreting the chart...
we should first understand the mechanics that shape it.
In Part 3, we'll explore another fascinating topic:
Gamma Walls – Why markets often reverse with astonishing precision at specific price levels. Education 
/GC – Recovery Above HVL, 4315 Call Wall in FocusGold is showing early signs of stabilization on the daily chart after a sharp multi-month selloff. Price is now trading at 4175, holding above 4110 – HVL while the next major upside reference sits at 4315 – C1.
This matters because HVL acts as the regime pivot — above it, gold remains inside a positive GEX environment, where price action tends to become more controlled than in reactive downside conditions.
🔶 Regime Context 🔶
Gold is trading above HVL at 4110, keeping the market inside a positive GEX regime. The immediate question is not whether structure has turned fully bullish, but whether price can maintain acceptance above HVL and begin rotating toward the overhead call wall.
🔶 Options Structure Context 🔶
👉 4315 – C1 — highest call NETGEX wall / main upside reference
With spot at 4175, C1 sits roughly 140 points above current price — making it the clear upside magnet on the GEX profile if the recovery continues.
🔶 Downside Structure 🔶
👉 3935 – P1 — strongest put wall
Confluence at 3935:
P1 — highest negative NETGEX / strongest put wall
Ab1 — largest absolute gamma
nPOI — net put open interest peak
POI — highest put open interest
AbOI — highest absolute open interest
That makes 3935 a major multi-confluence reaction zone — not just a round number, but a deep put-side positioning cluster that anchors the downside structure well below current price.
👉 4110 – HVL — regime pivot directly below spot; loss of this level would shift gold back toward a more reactive gamma environment
🔶 Options Sentiment 🔶
IVRank at 33.5 sits in a moderate range — options are neither cheap nor at an extreme. IVx has edged lower over the past five days (IVx 5dCh -1.4%), consistent with slightly compressing premiums after the recent decline.
IVRank 33.5
IVx 25.6 | IVx 5dCh -1.4%
Implied move ±0.6% (±25)
🔶 Key Structure to Watch 🔶
4110 — HVL / regime pivot (must hold)
4315 — C1 / highest call wall above spot
3935 — P1 + Ab1 + nPOI + POI + AbOI / main downside floor
For now, gold is attempting a recovery above 4110 HVL, with 4315 C1 as the next major upside reference.
The key question is whether momentum can carry price toward the 4315 call wall — or whether the recovery stalls and rolls back toward HVL. HOOD – Breakout Above C2, 110 Call Wall in FocusHOOD is showing strong momentum on the daily chart, rallying sharply from the 70 area in April and now pressing into the 110 call wall after clearing 105 – C2 .
Price has flipped C2 from resistance into support and is trading inside the positive gamma extension corridor between 105 and 110 , with the next structural test at the highest call NETGEX concentration on the board.
🔶 Regime Context 🔶
Price is trading well above HVL at 82 , keeping HOOD inside a positive GEX regime — price action typically becomes more controlled than below HVL. The positive GEX dot on the Options Oscillator confirms the broader gamma backdrop remains supportive as momentum carries price toward C1.
🔶 Options Structure Context 🔶
👉 110 – C1 + CV (highest call NETGEX wall)
Confluence at 110:
C1 — highest call NETGEX
CV — strongest call volume flow today
That makes 110 a clear reaction zone — not just a round number, but the densest call-side NETGEX and volume cluster overhead.
👉 120 – C3 + nCV — next extension reference above C1 if 110 clears
If price accepts above 110 , HOOD enters deeper positive gamma extension — gamma squeeze potential opens toward 120 (C3 + nCV) if momentum holds.
👉 105 – C2 — cleared breakout support; must hold on any pullback
🔶 Downside Structure 🔶
👉 82 – HVL — regime pivot; loss of HVL would shift structure into a more reactive GEX environment
👉 75 – P2 — secondary put wall
👉 70 – P1 — strongest put NETGEX wall on the chart
👉 65 – P3 + nPV — lower put volume reference
🔶 Options Sentiment 🔶
CALL$ 72.8% (64 DTE) means call options at an equivalent distance from spot are priced 72.8% higher than the corresponding puts — this is call pricing skew , reflecting strong upside demand and elevated call premium relative to puts.
The Options Oscillator filled green histogram is elevated and rising at the right edge — call pricing skew is building at high levels , consistent with aggressive upside positioning as price approaches the 110 call wall.
IVRank 64.3
IVx 72.7 (64 DTE) | IVx 5dCh -2.1%
CALL$ 72.8% (64 DTE) — call pricing skew
Implied move ±2.17% (±2.3)
🔶 Key Structure to Watch 🔶
110 – C1 + CV multi-confluence call wall (immediate ceiling)
105 – C2 cleared support (must hold)
120 – C3 + nCV extension target if C1 breaks
82 – HVL regime pivot
For now, HOOD is pressing the 110 call wall after a powerful breakout above 105 , inside a positive GEX regime with elevated call pricing skew.
The key question is whether momentum can break and hold above 110 — triggering extension toward 120 — or whether C1 rejects and price retests 105 support.  Long
Long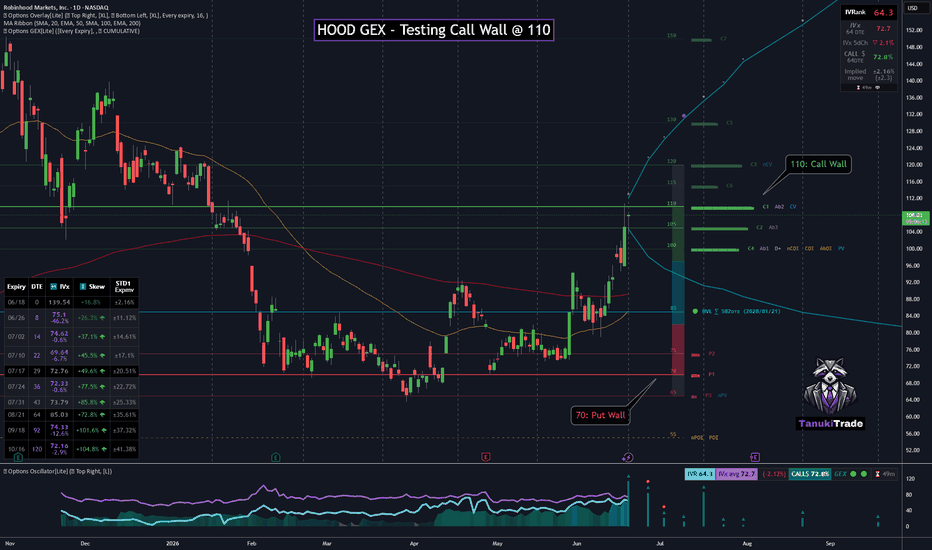
AAPL GEX - Testing 300 Call WallAAPL is consolidating on the daily chart after pulling back from the recent highs near 318 (nCOI zone), with price now sitting just below 300 — the highest call NETGEX wall on the board.
The stock remains structurally bullish on the daily timeframe, holding well above the 50 SMA and 200 SMA , but the immediate battle is whether momentum can reclaim and accept above the 300 multi-confluence cluster — or whether C1 continues to cap the bounce.
🔶 Regime Context 🔶
Price is trading well above HVL at 277.5 , keeping AAPL inside a positive GEX regime — price action typically becomes more controlled than below HVL. The broader gamma backdrop remains supportive, even as price compresses between nearby put support and the major call wall overhead.
🔶 Options Structure Context 🔶
👉 300 – C1 (highest call NETGEX wall)
Confluence at 300:
C1 — highest call NETGEX
Ab1 — largest absolute gamma
COI — highest call open interest
AbOI — largest absolute open interest
nCV / CV — strongest call volume flow
That makes 300 a clear reaction zone — not just a round number, but the densest call-side positioning cluster on the chart.
👉 310 – C2 — next call wall above if 300 clears
👉 318 – nCOI — overhead net call open interest reference from the recent peak zone
If price accepts above 300 , AAPL enters the positive gamma extension zone — gamma squeeze potential opens toward 310 (C2) and the 318 nCOI area if momentum holds.
🔶 Downside Structure 🔶
👉 292.5 – P3 — immediate put support below spot
👉 277.5 – HVL — regime pivot; loss of HVL would shift structure into a more reactive GEX environment
👉 250 – P2 + POI — secondary put cluster
👉 240 – P1 + nPOI — strongest put NETGEX wall on the chart
🔶 Options Sentiment 🔶
CALL$ 13.1% (66 DTE) means call options at an equivalent distance from spot are priced 13.1% higher than the corresponding puts — this is call pricing skew , reflecting modest upside demand rather than extreme call premium.
The Options Oscillator filled green histogram is rising from a recent low on the right edge — call pricing skew is building again after fading from prior peaks, consistent with renewed upside positioning interest as price approaches C1.
IVRank 32
IVx 24.3 (66 DTE) | IVx 5dCh -2.6%
CALL$ 13.1% (66 DTE) — call pricing skew
Implied move ±1.12% (±3.3)
🔶 Key Structure to Watch 🔶
300 – C1 multi-confluence call wall (immediate pivot)
292.5 – P3 immediate support
310 – C2 next upside target if C1 clears
277.5 – HVL regime pivot
For now, AAPL is pinned between P3 at 292.5 and the 300 call wall confluence , inside a positive GEX regime but below the heaviest call-side positioning.
The key question is whether momentum can break and hold above 300 — triggering extension toward 310 — or whether C1 rejects again and price retests 292.5 support.  Long
Long
MSFT GEX - Sitting right on Put WallMSFT is pressing into a familiar options level again.
On the daily chart, price is currently trading around 403 , sitting directly on top of 400 – P1 , the strongest put NETGEX wall. This is now the third time price has tested this zone in the current structure — and historically, 400 has acted as both support and resistance , not a one-direction level.
The immediate question is what happens right here , at the put wall.
🔶 Regime Context 🔶
Price is trading below HVL at 410 , keeping MSFT inside a negative GEX regime , where moves can become more reactive than above the gamma flip.
Technically, spot is also below the 50 SMA (~411) and well below the 200 SMA (~455) , so the broader daily structure remains heavy even while 400 is being defended again.
The first upside stabilization reference is not C1 yet — it is whether MSFT can reclaim and hold above 410 (HVL) . Until then, the structure stays in a more volatile, reactive environment.
🔶 Downside Structure 🔶
👉 400 – P1 — strongest put NETGEX wall / current battleground
This is the level to watch now. A hold here keeps the third test alive as a potential base. A clean break below 400 would shift MSFT into the negative gamma extension zone , opening downside gamma squeeze potential toward the next put references.
👉 380 – P2 — next put wall below
👉 385 – P3 — secondary downside reference
🔶 Options Structure Context 🔶
The upside map is much higher from here:
👉 460 – C1 — primary call NETGEX wall
👉 500 – C2 — major call-side cluster
Confluence at 500:
C2 — second-largest call NETGEX wall
COI — highest call open interest
CV — strongest call volume today
That makes 500 a significant upside positioning cluster — but it is far from current price. For now, the focus is not whether MSFT can reach 500, but whether 400 holds long enough for a rebound toward 410 (HVL) first.
🔶 Options Sentiment 🔶
CALL$ 21% means call options at an equivalent distance from spot are priced 21% higher than the corresponding puts — this is call pricing skew . The reading is present, but not extreme.
The Options Oscillator green histogram is modestly elevated at the right edge, with call pricing skew stable rather than accelerating into the P1 test.
IVRank 57.8
IVx 33.9 | IVx 5dCh +23.1%
CALL$ 21% — call pricing skew
Implied move ±1.82% (±7.34)
🔶 Key Structure to Watch 🔶
400 (P1) — third test / immediate decision level
410 (HVL) — regime pivot; reclaim needed for stabilization
500 (C2 + COI + CV) — major upside call cluster if momentum returns
For now, MSFT is not in a clean trend-reversal setup yet — it is in a put-wall decision zone below HVL.
The key question is whether 400 holds on this third test and allows a rebound toward 410 , or whether a break below P1 opens the negative extension path toward 390 (P2) .  Short
Short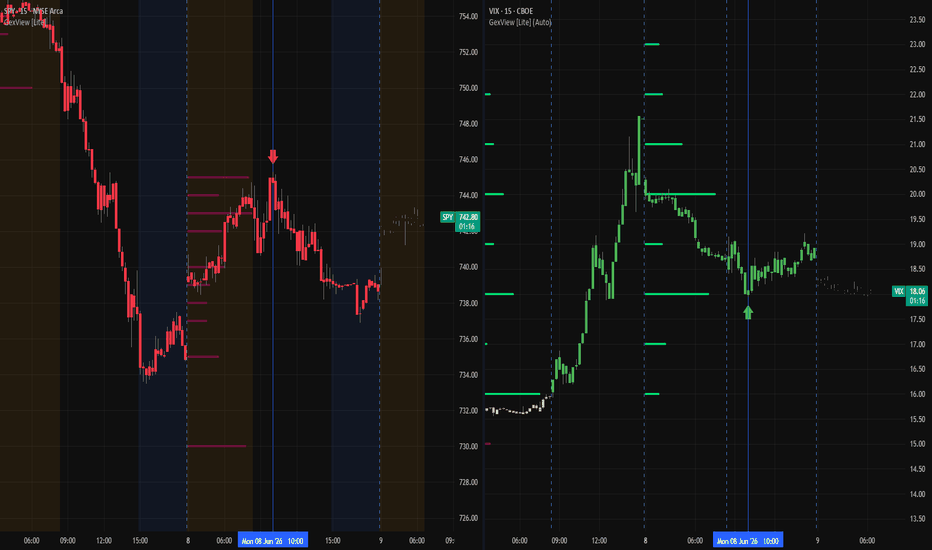
GOOGL GEX - Bounce from Put WallGOOGL is showing a powerful bullish reversal on the daily chart. Price tested 360 – P1 , where the strongest put NETGEX wall aligns with nPV and PV — today’s heaviest put volume flow — in the same zone as an earlier gap-up fill and the 50 SMA at 360.90 . The result is a large green bullish candle that reclaimed 362.5 – HVL and closed above 370 – C1 at 371.95 .
The 370 strike is not a thin call line alone: it stacks C1 (highest call NETGEX), Ab1 (largest absolute gamma), and CV / nCV (strongest call volume and net call volume). Clearing that cluster shifts focus toward 400 – C2 while positive GEX holds above HVL.
🔶 Regime Context 🔶
Price is trading above HVL at 362.5 , keeping GOOGL in a positive GEX regime . The sequence — defend P1/HVL, then accept above the 370 call cluster — is constructive: buyers absorbed put-side flow at 360 before challenging the densest call-side magnet on the board.
🔶 Options Structure Context 🔶
👉 370 – C1 (highest call NETGEX wall)
Confluence at 370:
C1 — highest call NETGEX
Ab1 — largest absolute gamma
CV — strongest call volume
nCV — strongest net call volume
That makes 370 a major reaction zone — not a round number. Today’s close above this stack opens the positive extension zone with gamma squeeze potential toward 400 – C2 if acceptance holds (retest 370 as support, not rejection).
👉 400 – C2 — next call NETGEX wall toward prior highs near 390–400.
🔶 Downside Structure 🔶
👉 360 – P1 (strongest put NETGEX support)
Confluence at 360:
P1 — highest put NETGEX
PV — strongest put volume
nPV — strongest net put volume
Together, this points to protective put flow and put gamma concentrated at 360 — exactly where price bounced today, overlapping the gap-fill reference and the 50 SMA .
👉 362.5 – HVL — gamma flip between P1 and C1; reclaim was required before the C1 cluster break.
👉 345 – P2 — next put wall if 360 fails.
🔶 Options Sentiment 🔶
CALL$ 41.1% means calls at equivalent distance from spot are priced 41.1% higher than puts — firm call pricing skew into the bounce.
The filled green call-skew histogram is turning higher off recent lows at the right edge after the P1 test — skew rebuilding with the rally (histogram body only, not the vertical NETGEX bars).
IVRank 37.2
IVx 33.8
CALL$ 41.1% — call pricing skew
🔶 Key Structure to Watch 🔶
370 – C1 + Ab1 + CV + nCV — breakout support; loss reopens HVL and the 360 put cluster
362.5 – HVL — regime pivot
360 – P1 + PV + nPV — put wall + put-flow floor
400 – C2 — upside target in extension if 370 holds
For now, GOOGL bounced from a put-flow-heavy P1 into a call-flow + gamma-heavy C1 break, above 50/200 SMA and inside positive GEX .
The key question is whether 370 holds on retest as support after clearing C1 + Ab1 + CV + nCV — and whether gamma squeeze potential can reach 400 – C2 , or the cluster stalls price again. Market Pulse After the CloseMarket Pulse - June 2, 2026 After-Close Map
Today was another “quiet headline, busy under the hood” session.
The S&P 500 and Dow closed modestly higher, Nasdaq finished nearly flat, and small caps outperformed. The bigger story was not broad index panic or euphoria. It was AI infrastructure strength, oil/geopolitical risk staying alive, and a hot JOLTS print that kept the labor market from looking weak.
Pre-market setup:
- Futures were slightly soft after Monday’s record-setting session.
- HPE was the standout AI infrastructure catalyst, surging pre-market after strong AI-server demand and higher long-term targets.
- JOLTS was the main macro event at 10:00 AM ET.
- Oil stayed in focus because U.S.-Iran / Strait of Hormuz headlines are still driving inflation and rate-risk sensitivity.
Macro read:
JOLTS job openings came in at 7.6M for April, well above expectations and up from 6.9M in March. That is not a clean “slowdown” signal. But hires and separations both fell, so the more accurate read is this:
Openings improved, but labor-market churn cooled.
That helped explain why equities did not fall apart, but also why the tape did not become a full-send everything rally.
Primary futures performance today:
| Product | Close | Change vs Prior Anchor | Session Range |
|---|---:|---:|---:|
| ES | 7,627.00 | +13.75 / +0.18% | 7,576.50 - 7,632.00 |
| NQ | 30,749.00 | +182.75 / +0.60% | 30,317.75 - 30,763.25 |
| YM | 51,421 | +287 / +0.56% | 50,841 - 51,443 |
| RTY | 2,934.00 | +24.30 / +0.84% | 2,889.30 - 2,938.40 |
| GC | 4,519.60 | +44.40 / +0.99% | 4,492.30 - 4,571.30 |
| CL | 93.57 | +1.41 / +1.53% | 90.12 - 94.00 |
My read:
- ES held bullish structure but did not explode.
- NQ was still leadership, but it is now stretched on higher-timeframe volatility.
- RTY confirming was important. Small caps helped the tape look healthier.
- Gold stayed bid, which tells me macro hedging is still present.
- Crude gained again, so the inflation/geopolitical risk valve is not closed.
Tomorrow’s Expected Moves - Wednesday, June 3, 2026
These are not predictions. They are volatility-defined reference zones. The useful signal is how price behaves at the edges: rejection, acceptance, or reclaim.
| Product | Anchor | 1SD Range | 2SD Range |
|---|---:|---:|---:|
| ES | 7,627.00 | 7,564.04 - 7,689.96 | 7,501.09 - 7,752.91 |
| NQ | 30,749.00 | 30,374.47 - 31,123.53 | 29,999.95 - 31,498.05 |
| YM | 51,421 | 50,997 - 51,845 | 50,572 - 52,270 |
| RTY | 2,934.00 | 2,909.78 - 2,958.22 | 2,885.56 - 2,982.44 |
| GC | 4,519.60 | 4,461.78 - 4,577.42 | 4,403.97 - 4,635.23 |
| CL | 93.57 | 90.65 - 96.49 | 87.74 - 99.40 |
Volatility snapshot:
- VIX: 15.77
- VXN: 23.27
- GVZ: 24.44
- OVX: 59.53
The equity vol backdrop is still compressed. That usually rewards patience inside the 1SD range, but it also means a clean acceptance outside the band can force fast repositioning.
Higher-timeframe expected-move alerts:
- ES is above its Q2 +1SD reference.
- NQ is above its Q2 +2SD reference.
- RTY is above its Q2 +1SD reference.
That is not automatically bearish. It means the market is extended enough that entries need better confirmation and cleaner invalidation.
Latest available gamma flip levels:
| Symbol | Price Area | Gamma Flip | Read |
|---|---:|---:|---|
| SPY | 708.00 | 708.00 | Directly on flip |
| QQQ | 646.30 | 646.00 | Positive above flip |
| SPX | 7,102.95 | 7,105.00 | Just below flip |
| NDX | 26,569 | 26,570 | Just below flip |
| IWM | 276.55 | 277.00 | Just below flip |
| NVDA | 200.07 | 200.00 | Positive above flip |
| MSFT | 418.94 | 420.00 | Below flip |
| AAPL | 272.93 | 272.50 | Positive above flip |
| AMZN | 247.71 | 247.50 | Positive above flip |
| TSLA | 392.71 | 392.50 | Positive above flip |
| DIA | 493.45 | 479.43 | Positive above flip |
| XLF | 52.52 | 50.90 | Positive above flip |
| RUT | 2,786 | 2,785 | Positive above flip |
Gamma takeaway:
The market is sitting near important regime boundaries. SPY/QQQ and several mega-cap leaders are constructive, but SPX/NDX/IWM were still close enough to their flip areas that a small move can change the hedging environment quickly.
Geopolitical risk:
The main risk remains energy. U.S.-Iran talks around the Strait of Hormuz are still a market input, and oil continues to trade like the macro pressure valve. If crude accepts above tomorrow’s CL 1SD upper zone near 96.49, I would expect equities to become more sensitive to yields and inflation language again.
Big earnings / AI catalysts:
- HPE was today’s major AI infrastructure confirmation.
- PANW reported after the close and is important for cybersecurity / enterprise AI security demand.
- AVGO reports Wednesday after the close. That is the biggest remaining AI hardware / custom silicon catalyst this week.
- CRWD also reports Wednesday after the close and matters for cybersecurity sentiment.
Game plan for tomorrow:
Bull case:
ES holds above 7,564, NQ holds above 30,374, RTY stays above 2,909, and CL fails to accept above 96.49. That would keep the tape constructive and allow buyers to keep pressing toward the upper 1SD bands.
Bear case:
NQ rejects near 31,123, ES loses 7,564, or crude breaks higher through 96.49. That combination would shift the session from continuation into digestion or a sharper mean-reversion trade.
Most important level cluster:
- NQ 31,123 upper 1SD
- ES 7,690 upper 1SD
- CL 96.49 upper 1SD
- RTY 2,909 lower 1SD
Bottom line:
The tape is bullish, but not carefree. AI leadership is still doing the heavy lifting, small caps helped today, and volatility remains contained. The risk is that NQ is now stretched against higher-timeframe expected-move references while crude and geopolitics are still active.
Trade the reaction at the levels. Don’t marry the headline.
Not financial advice.  Education
NVDA – Pullback Holding Above P1/HVLNVDA is pulling back after a sharp rally that peaked near 236 in late May.
On the daily chart, price has retraced from those highs but remains above P1 and the High Volatility Level around 207.5 . That keeps the stock inside a positive GEX regime for now — as long as this zone holds, price action tends to stay more controlled than in a negative gamma environment below HVL.
This matters because the current move is not a breakdown yet — it is a retracement within a broader uptrend , with price still holding well above the 50 SMA (~198) and 200 SMA (~187) .
🔶 Regime Context 🔶
Price is currently testing the 207.5 P1 / HVL zone — the immediate regime pivot after the rally. A clean loss of 207.5 would open the path toward the 200 confluence cluster below.
🔶 Options Structure Context 🔶
👉 220 – C1 (highest call NETGEX wall)
Confluence at 220:
C1 — highest call NETGEX
Ab1 — largest absolute gamma
CV / nCV — strongest call volume flow today
That makes 220 a clear reaction zone for any recovery attempt — not just a round number. Above that, structure extends toward 224 (C3) and 232 (C2) .
🔶 Downside Structure 🔶
👉 207.5 – P1 / HVL — immediate regime pivot (currently being tested)
👉 200 – POI + COI + AbOI + nPV + PV
Confluence at 200:
COI — highest call open interest
POI — highest put open interest
AbOI — highest absolute open interest
nPV / PV — strongest put volume
Together, this points to protective put positioning at 200 — a major dual-OI and put-flow cluster below spot.
👉 195 – P2 — next put wall below the 200 zone
🔶 Options Sentiment 🔶
CALL$ at 27.6% (51 DTE) means call options at an equivalent distance from spot are priced 27.6% higher than the corresponding puts — this is call pricing skew , showing moderate call-side demand in the options market.
On the Options Oscillator , the green histogram has declined from a recent peak — call pricing skew is fading from its highs , even though it remains positive.
IVRank 29.7
IVx 42.6 (51 DTE) | IVx 5dCh +0.3%
CALL$ 27.6% (51 DTE) — call pricing skew
Implied move ±0.25% (±0.5)
IVR 28.6 | IVx avg 42.4 | positive GEX dot
🔶 Key Structure to Watch 🔶
207.5 (P1 / HVL) — regime pivot / hold or break
220 (C1 + Ab1 + CV) — primary call wall / recovery ceiling
200 (COI + POI + AbOI + PV) — major support / protective put cluster
236 — recent swing high / pullback origin
195 (P2) — put support below 200
For now, NVDA is in a post-rally pullback, still holding above P1/HVL inside positive gamma, with call skew fading but still positive.
The key question is whether price stabilizes above 207.5 and retests the 220 call wall confluence — or whether the pullback extends into the 200 dual-OI cluster . Gamma Exposure Pattern: 0DTE NDX+VIXThis example is from May 14, 2026.
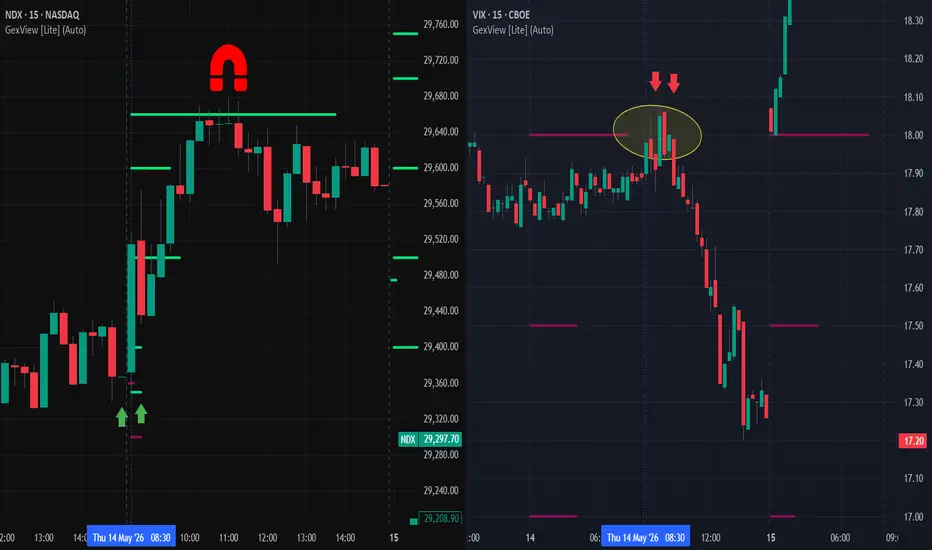
My setup is based on Gamma Exposure (GEX):
1. Left Chart
Ticker: Nasdaq 100 Index ( NASDAQ:NDX )
Gamma Exposure: 0DTE (expiration: May 14, 2026)
Time Trigger: Regular Trading Hours (RTH) opening
Target: The largest 0DTE GEX level at 29,660, which tends to act as a magnet price level.
2. Right Chart
Ticker: Volatility Index ( CBOE:VIX )
Gamma Exposure: Nearest expiration (May 19, 2026)
Pattern: A false breakout in CBOE:VIX above the largest GEX level (18), while at the same time NASDAQ:NDX begins moving toward its intraday target.
I see this pattern occur very frequently. I focus on identifying the largest 0DTE GEX level in a major asset such as CBOE:SPX , AMEX:SPY , NASDAQ:NDX , or NASDAQ:QQQ , and then look for confirmation from the opposite move in TVC:VIX .
As Linda Raschke said:
“All you need is one pattern to make a living.”
SPX – Bullish Rally Above HVL, 7500 Call Wall in Focus🔶 SPX – Bullish Rally Above HVL, 7500 Call Wall in Focus 🔶
SPX is currently trading in a very strong bullish rally, with price moving firmly above the High Volatility Level (HVL).
For the May 15 expiration, HVL is now sitting far below current price, around the 7300 area, which means SPX remains well inside a positive GEX regime.
In this type of environment, price action often becomes more controlled, and upside momentum can continue as long as the structure remains supportive.
🔶 Current Options Structure 🔶
The main upside level now in focus is:
👉 7500 – highest call wall
Price is already getting close to this level, making it the next major options-driven reference point.
🔶 Speculative Call Flow 🔶
What really stands out today is the 7600 strike.
According to the indicator, 7600 currently shows the highest call volume of the day. That is especially interesting because the May 15 options chain expires in just two days. In other words, this looks like highly speculative short-dated upside call flow.
That does not mean SPX has to trade to 7600, but it clearly shows that aggressive upside positioning is building into expiration.
🔶 Key Structure to Watch 🔶
7300 area – HVL / regime pivot
7500 – highest call wall / nearest major upside reference
7600 – speculative call volume cluster
May 15 expiration – short-dated positioning window
For now, SPX remains in a strong positive gamma environment, with the market pressing toward the 7500 call wall.
The key question is whether momentum can carry through that level — or whether the call wall starts acting as a short-term magnet and resistance zone. SPX: New All-Time High — With a Little Help from GEXDid you see it coming?
If you feel nervous during every trading session—constantly second-guessing your decisions—you’re not alone. But instead of wasting time and money, consider focusing on what truly matters: Gamma Exposure.
Take a look at the chart. No annotations, no moving averages, no trend lines—just Historical Gamma Exposure levels. It’s as if we’ve laid all the cards on the table.
The first thing to notice is the classic V-shaped rebound. But why did it happen? Honestly, we don’t know—and more importantly, we don’t need to. What matters is what happened, not why.
And what happened was a complete shift in Gamma Exposure following the end of Q1 2026. Throughout most of February and March, the SPX traded almost entirely within a negative gamma environment (red bars). However, starting April 1, both 0DTE(thin lines) and All Expirations (thick lines) GEX levels flipped from red to green. In other words, the SPX transitioned from a negative to a positive gamma regime.
Looking more closely, you’ll notice that the red bars gradually shrink—and in some cases disappear entirely—while new green levels emerge. From a Position Analysis perspective, this signals that market makers have shifted into a positive gamma stance.
To conclude, I’ll share one final SPX chart focused solely on 0DTE Gamma Exposure levels. The image speaks for itself.
To me, it reflects Jesse Livermore’s “path of least resistance”—redefined for today’s digital, options-driven market.
Long 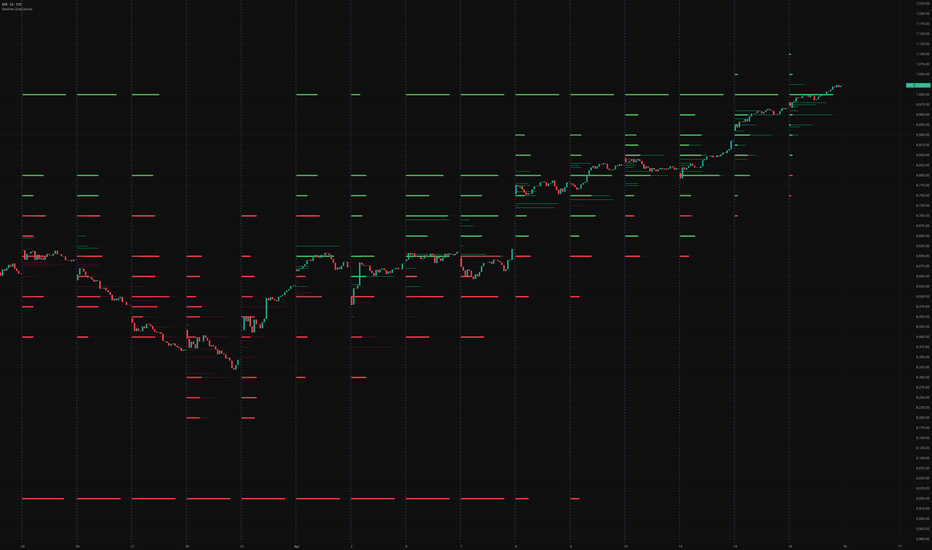
What drives SPY market when volatility crashes?Last week, the S&P 500 jumped 3% after a ceasefire announcement. It looked like everyone got confident again . Volatility (VIX) dropped below 20 — one of the biggest one-day drops ever.
But here's the catch.
That rally wasn't about good news. It was about vanna🧐.
What's vanna? It measures how falling volatility changes option deltas. When volatility crashes, dealers who were shorting stocks to hedge puts no longer need to. So they buy back those shorts — and prices go up.
That's exactly what happened. Dealers were holding lots of puts. Volatility dropped. They covered their shorts. Market ripped.
Oh, and negative gamma made it even stronger. In negative gamma, dealers buy even more as the market rises — like throwing fuel on a fire.
The bottom line? A vanna rally isn't a green light. It's a mechanical move. If volatility spikes again (bad news, geopolitics, weak data), those same dealers could reverse hard — and fast.
Quick question for you 👇
Are you already watching gamma and dealer positioning in your trading?
Or is this new to you?
If this is interesting and you want to go deeper — let me know👍.
I am actually building an extra app that brings gamma levels (FX, commodities, index, shares) right into existing trading workflow. More soon.
Trade with data, trade smart ! Education