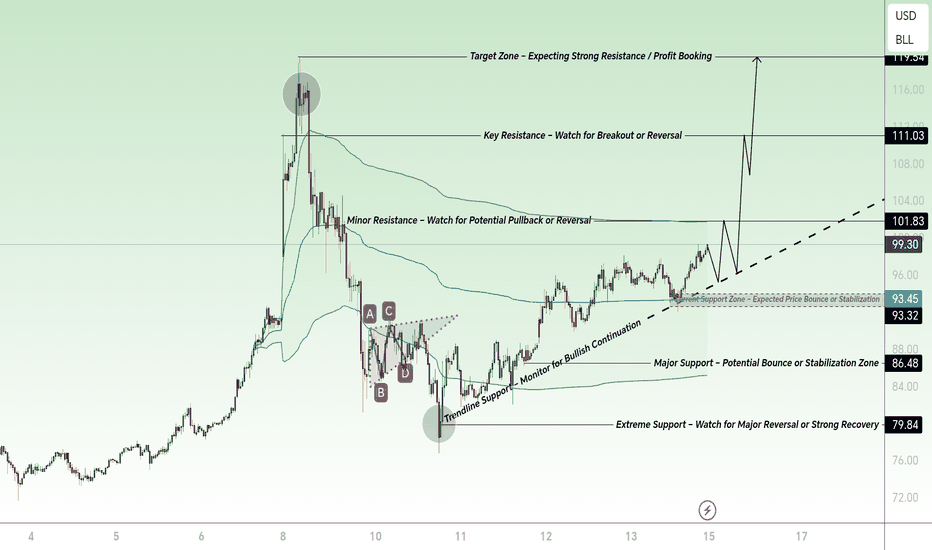
Oil analysis – Support & Resistance LevelsCurrent chart shows Silver testing the 93–94 support zone with potential bounce. Key resistance levels are at 99.30, 101.83, and 111.03, with the ultimate target near 115–116. Monitor trendline support for bullish continuation, and watch for price reaction at major zones for potential reversal or profit booking.
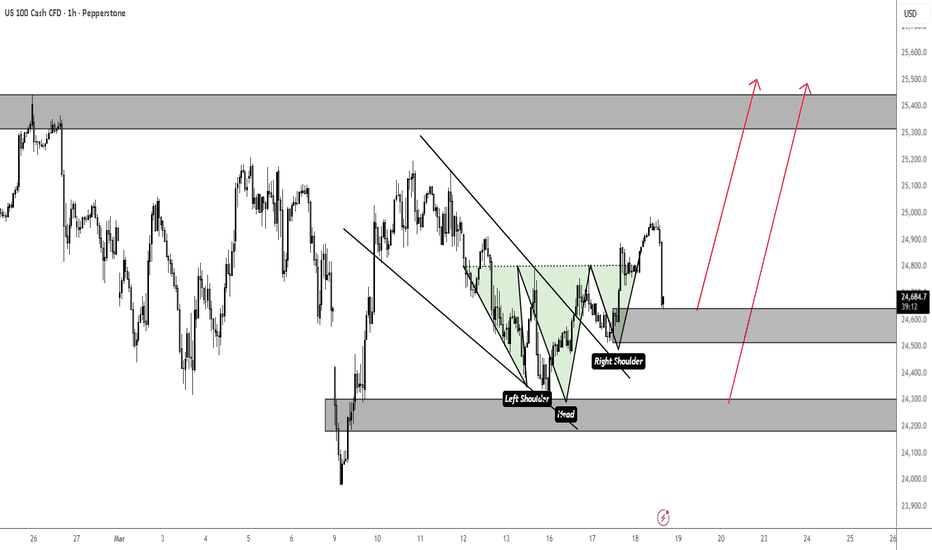
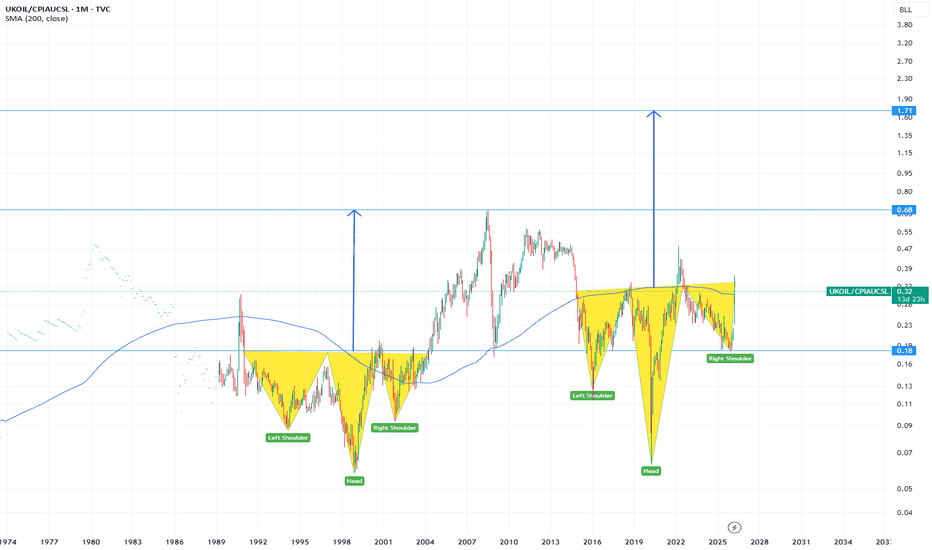
Head and Shoulders
ASTER ANALYSIS (1D) Aster seems like willing to go upwards with heavy momentum.
Recent price movements indicate that an accumulation zone has been broken recently. I don't think that's just another liquidty sweep. I believe that the price is in an A-B-C corrective wave.
If you look closer, you may recognise a head and shoulder formation also has been formed as well.
If the current situation can hold the price above $0.66 levels, price can easily go through $0.98 levels.
Thanks for reading.
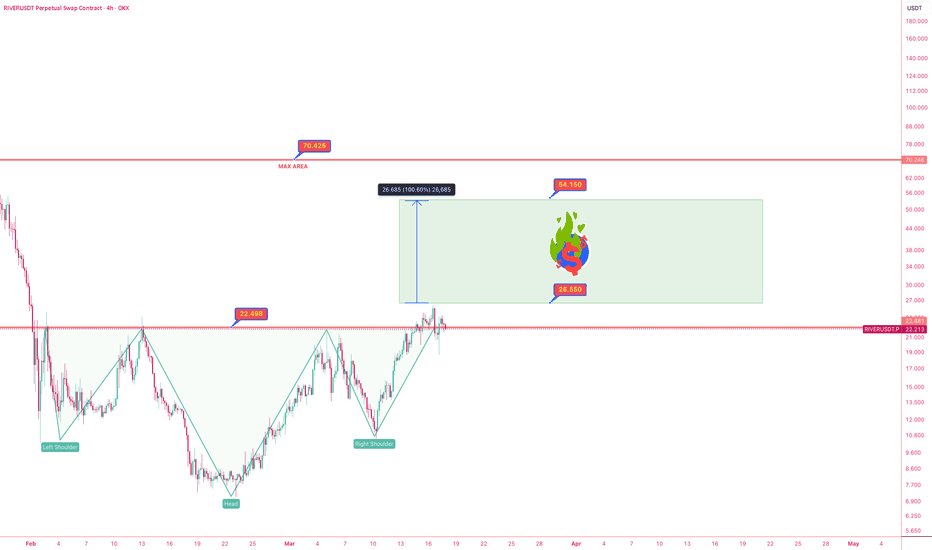
RIVER - INVERSE HEAD & SHOULDERS - %100 RISE UP!Already 1x potential just from structure, MIGHT CONSIDER ONLY SPOT 💰
No need to even leverage…
Smart money is accumulating, not over-risking.
👉 Inverse H&S confirmed
👉 Neckline holding
👉 Targets: 26 → 54 → Risky but 70 possible
This is a clean spot play.
What are you thinking about RIVER ?👇📊
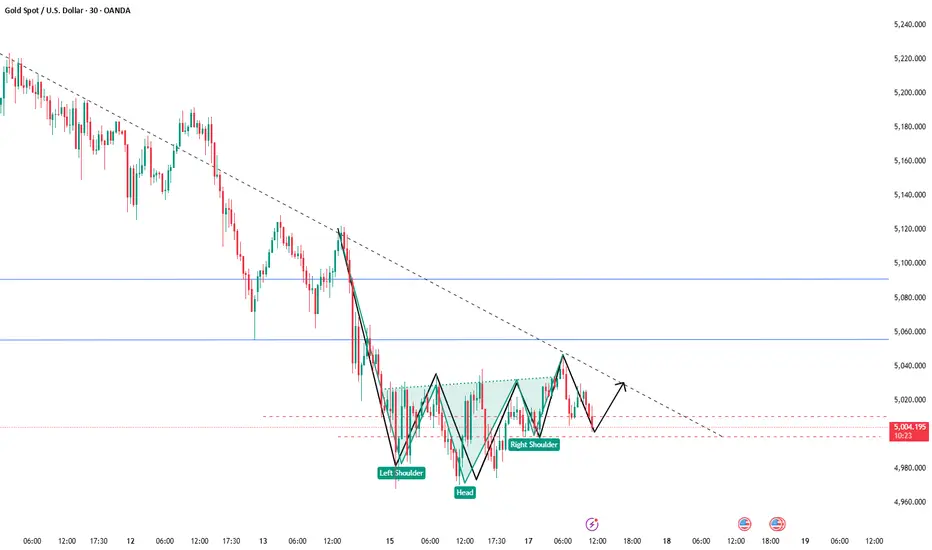
Buy Gold: Structural Support Suggests Continued Rise!Gold remains weak, but the downward momentum has slowed significantly compared to before, and it has managed to stay above 5000. This suggests that gold has shown clear signs of bottoming out after repeated fluctuations in the short term. From a short-term structural perspective, gold has gradually formed a clear inverted head and shoulders support pattern, and with the lows gradually moving higher, the short-term support has moved up to the vicinity of 5000. If gold can form a double bottom pattern centered around the 5005 area, it will be more conducive to driving gold prices higher. If gold can break through the 5030-5050 area in the short term, it will open up more upside potential!
In terms of short-term trading, given the solid support below and the clear intention to form a bottom, we might as well follow the market structure and continue to consider buying gold in the 5015-4995 range!
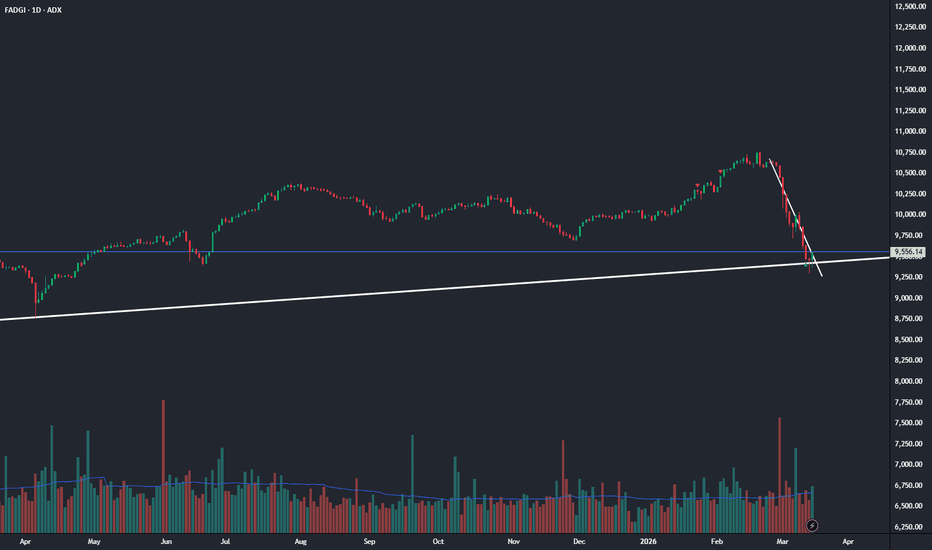
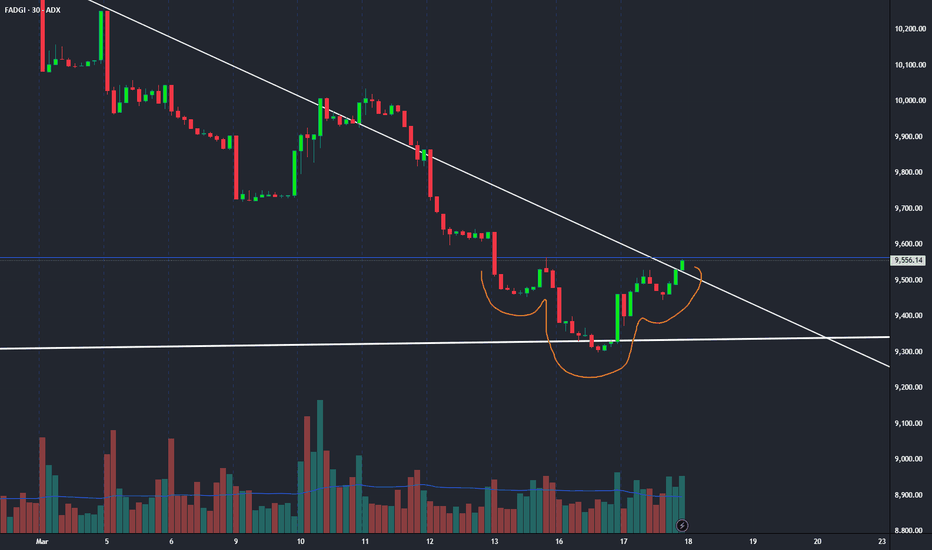
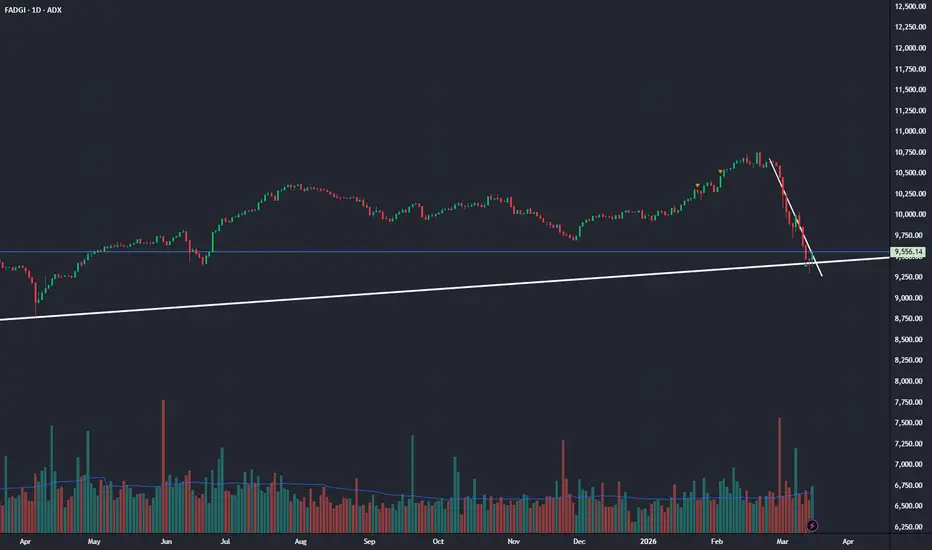
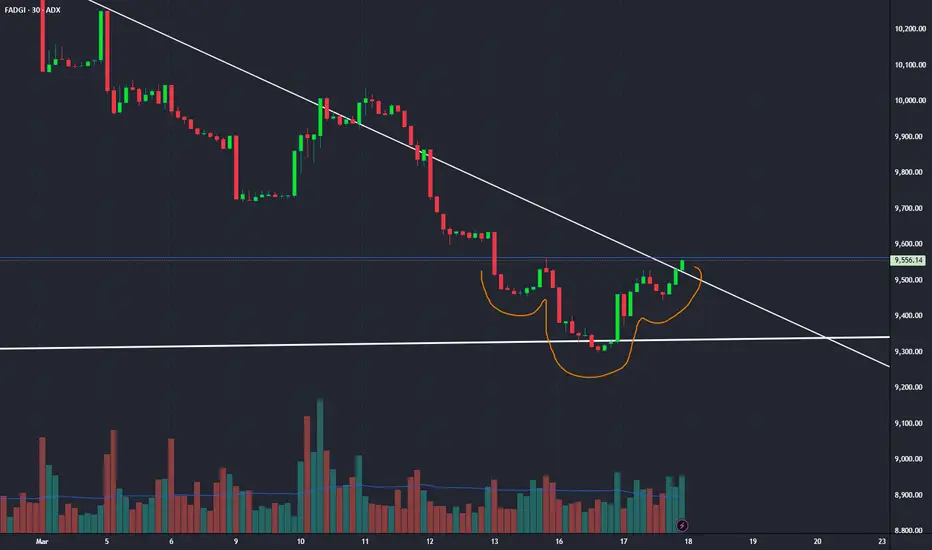
Breakout tomorrow?ADX formed a nice Inverted head and shoulders pattern on the 30 minutes timeframe, confirmed by volume. Many UAE stocks appear to be forming similar patterns. This could be the sign we have been waiting for, that we have reached the bottom of this correction. Will we breakout the neckline and begin our 'long' journey? I hope so!
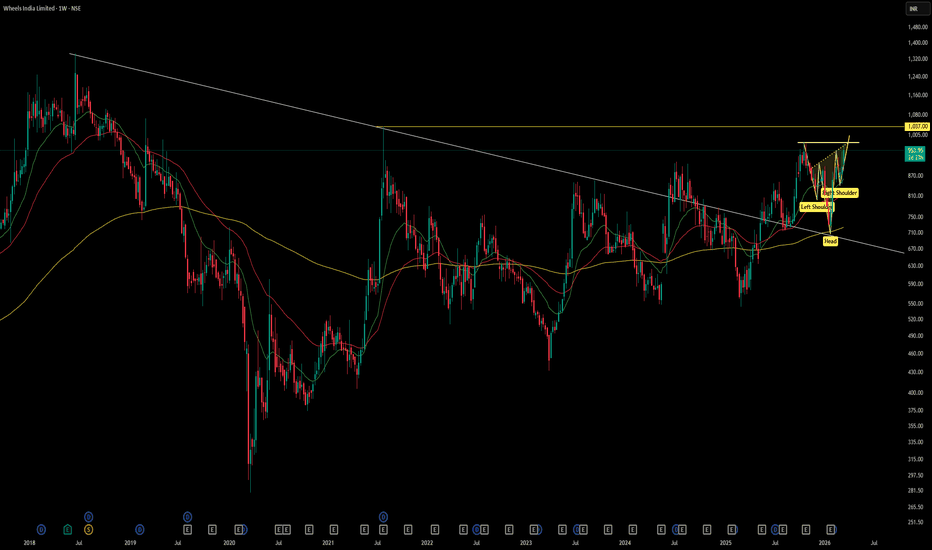
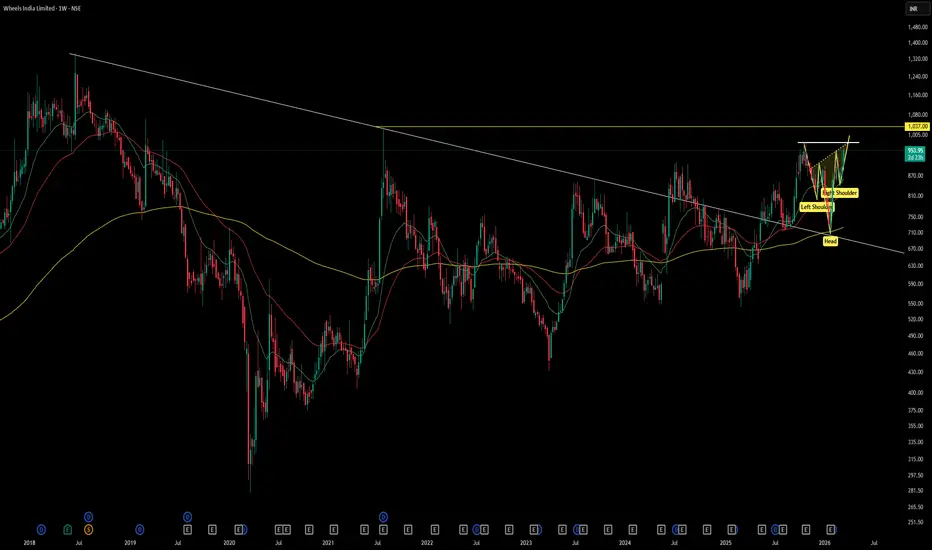
WHEELS INDIAWheels India Ltd. (NSE: WHEELS) is a mid‑cap company in the auto ancillary sector, specializing in steel wheels, castings, air suspension systems, and precision components for commercial vehicles, passenger cars, tractors, and industrial equipment. Incorporated in 1960, it is part of the TVS Group.
Promoter: TVS Group (Promoter Family) – 57.54% holding (Dec 2025)
FY22–FY26 Snapshot
Revenue Growth: CAGR ~8–9% over FY22–FY26, driven by auto demand recovery. → Good
Net Profit: FY26 PAT ~₹210 Cr, reflecting steady growth. → Good
Operating Margin: Maintained ~9–11%, moderate efficiency. → Neutral
Equity Capital: Stable, no major dilution. → Good
Dividend Policy: Yield ~1.6% (FY26), consistent payouts. → Good
Asset Building: Expansion of wheel and suspension manufacturing facilities. → Good
Sales: FY26 revenue crossed ₹4,800 Cr. → Good
Expense: Raw material and energy costs remain high. → Neutral
EPS: ~₹95.4 in FY26, reflecting consistent profitability. → Good
Institutional Interest & Ownership Trends
Largest Promoter: TVS Group – 57.54%
Largest FII: Collective foreign institutional investors – ~4.2%
Largest DII: Mutual funds (SBI, HDFC, ICICI) – ~12.1% combined
Retail & Others: ~26.2%
Strategic Moves & Innovations
Expansion into air suspension systems and precision components.
Focus on exports of wheels and castings to Europe and North America.
Investment in automation and advanced manufacturing technologies.
Strengthening OEM partnerships in commercial vehicles and tractors.
Cash Flow & Balance Sheet Strength
Operating cash flows supported by auto sector demand.
Debt levels moderate, manageable with steady profits.
Profit growth supports dividend payouts and reinvestment.
Risk Factors
Dependence on auto demand cycles.
Margin sensitivity to steel and raw material prices.
Competition from global wheel manufacturers.
Export risks due to global trade fluctuations.
Investor Takeaway
Wheels India Ltd. is a key auto ancillary player with strong promoter backing and healthy institutional interest. With most snapshot parameters rated Good, the company shows consistent EPS growth, robust asset building, and strong sales momentum. Investors should monitor raw material costs and auto demand cycles, but overall the outlook remains positive for long‑term holders.
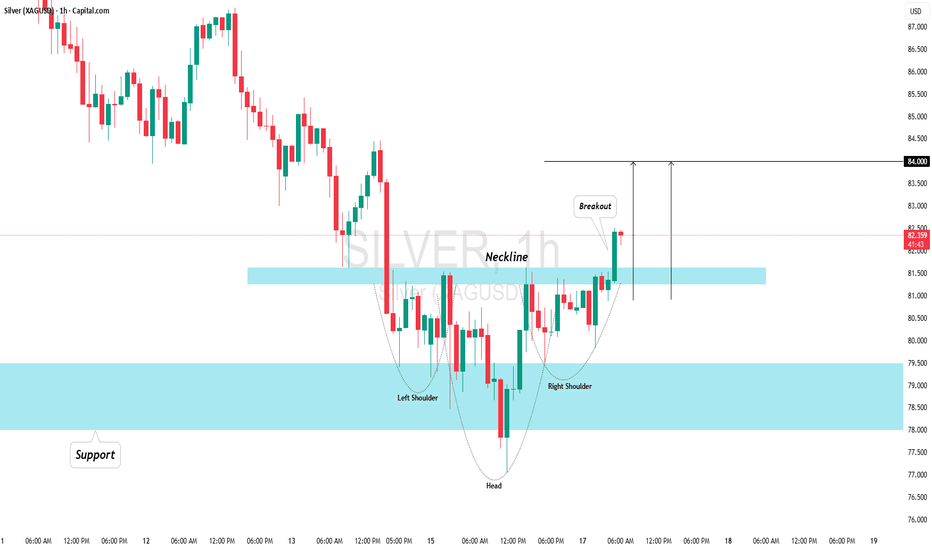
SILVER (XAG/USD): Intraday Bullish SignalIt shows that 📈SILVER has successfully completed a bullish accumulation phase at a significant intraday horizontal support level.
A bullish breakout from the horizontal neckline of an inverted head and shoulder pattern on the hourly chart suggests a clear indication of buyer strength.
Our target 84.00.
River Analysis (12H)We can all agree about one thing about River, it has finished it's five waved impulsive wave and another A-B-C pattern has been formed right after. We're currently in another five waved impulsive move. Right now, River on stage 3, which means there's still lots of room to go.
As the matter of fact, River also has a visible inverse head and shoulders pattern formed at the moment which is supporting the idea about a new five waved move.
Minimum Target is $66, see you at there!
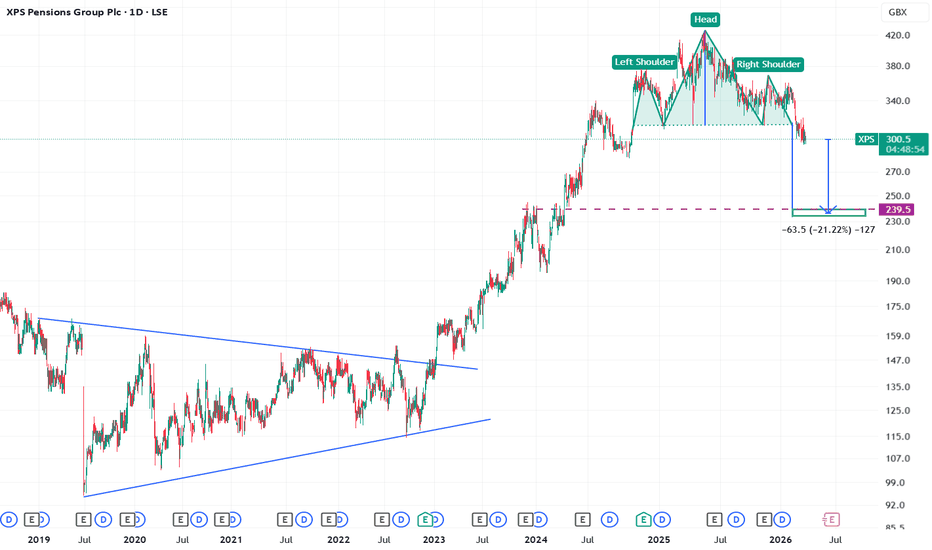
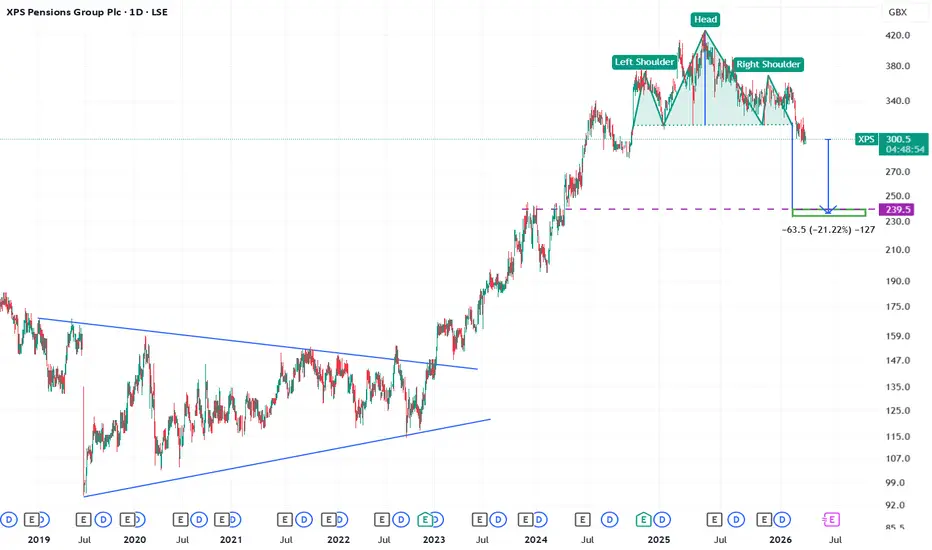
XPS to move lower - Head & Shoulders - bearish Bearish
Here are the main reasons XPS Pensions Group (LSE: XPS) could move lower, ranked most important first:
High valuation relative to earnings – The stock trades on a relatively high P/E multiple (around mid-20s) compared with many UK companies, so if growth expectations weaken the share price can fall.
Slower expected earnings growth – Forecast growth for the company is relatively modest compared with the wider market, which can reduce investor enthusiasm.
Profit decline despite revenue growth – In recent results, profit before tax fell even though revenue increased, suggesting margin pressure and operational costs rising.
Dependence on the UK pensions industry – The company’s revenues rely heavily on UK pension schemes; regulatory changes or reduced demand for consulting services could impact growth.
Insider selling – Company insiders have sold shares recently, which can sometimes reduce investor confidence.
Dividend sustainability concerns – The company’s dividend payout ratio has been reported at around 100%, which may raise questions about long-term sustainability.
General UK market sentiment – Smaller UK financial and consulting firms can fall when the broader UK market or financial sector weakens.
✅ Simple takeaway:
XPS could decline mainly because investors think the stock is relatively expensive compared with its growth prospects, especially if profits or sector demand slow.
Head & Shoulders triggered Bearish looks to move lower
Key Risks That Could Push JPMorgan (JPM) Lower
1️⃣ Rising expenses and investment spending
JPM expects ~$105B in expenses for 2026, above previous estimates.
Higher spending on AI, branches, marketing, and compensation could pressure margins.
2️⃣ Economic slowdown / credit cycle risk
If the economy weakens, banks face:
higher loan defaults
lower lending demand
reduced investment banking activity.
3️⃣ Interest-rate cycle turning
JPM benefited from high interest rates boosting net interest income.
If rates fall or yield curves compress, bank profitability can decline.
4️⃣ Profit-taking after strong multi-year rally
JPM has rallied strongly over recent years and is still near historical highs.
Large institutional holders (over 70% institutional ownership) may rebalance or lock in gains.
5️⃣ Market volatility hitting trading & dealmaking
Investment banking and trading revenues depend heavily on market activity.
Slower IPO or M&A markets could reduce revenue growth.
6️⃣ Global macro risks
Geopolitical shocks, inflation, or financial market stress could hurt financial stocks broadly.
Even JPM leadership has warned of possible economic turbulence.
✅ In simple terms:
The biggest downside risks for JPM are rising costs, a potential economic slowdown affecting loans and deal activity, and sensitivity to interest-rate changes.
H & S set up - looks to move lower Bearish
H&S already triggered
1️⃣ Overextended price after strong rally
Airtel has had a long multi-year uptrend.
If momentum slows, profit-taking from institutions could trigger a correction.
2️⃣ High valuation relative to telecom peers
Airtel trades at premium multiples because of strong growth expectations.
If growth or ARPU expansion slows, the valuation could compress.
3️⃣ Heavy capital spending for 5G and spectrum
Airtel continues large investments in network infrastructure.
High CapEx can pressure free cash flow and short-term earnings sentiment.
4️⃣ Competitive pressure from Reliance Jio
Jio remains aggressive in pricing and subscriber growth.
Any renewed price competition could squeeze margins.
5️⃣ Regulatory and telecom policy risks in India
Telecom sector faces regulatory oversight (spectrum pricing, AGR issues).
Policy changes can quickly impact telecom stock valuations.
6️⃣ Foreign investor flows and market conditions
Airtel is heavily owned by global funds.
If FIIs pull money from Indian equities, large-cap stocks like Airtel often decline.
✅ In simple terms:
The biggest downside risks for BHARTIARTL are profit-taking after a strong run, premium valuation risk, and ongoing telecom sector competition and capital spending.
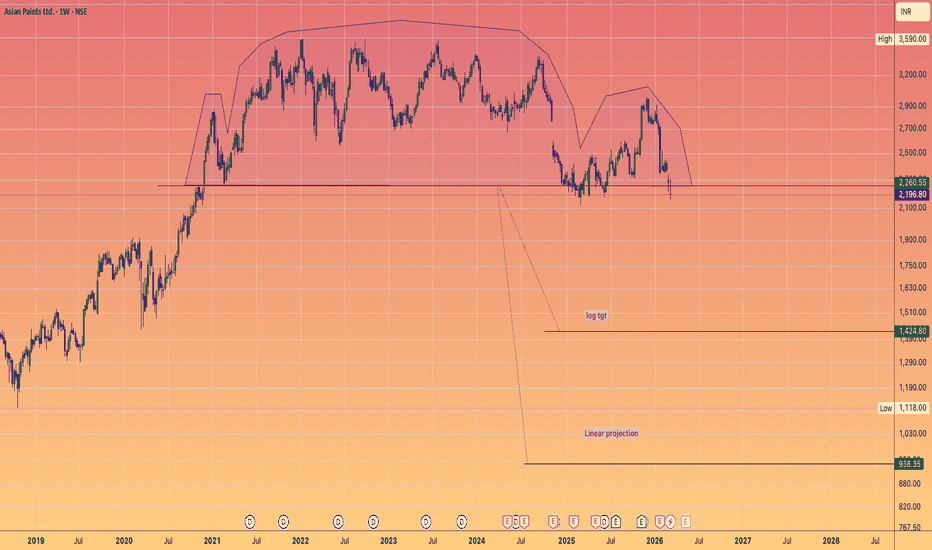
Asian Paints: Breakdown toward ₹938🎨🎨🎨
The Technical Setup: A 5-Year Head & Shoulders Top
The Neckline Snap: The crucial support zone at ₹2,700–₹2,800—which held the stock up for years—has been decisively broken.
The Breakdown: We are currently seeing a "retest and reject" move. The price is sliding down the right shoulder with increasing momentum.
The Targets: * Log Target: ₹1,424 (A massive mean-reversion move).
Linear Projection: ₹938 (The ultimate "worst-case" capitulation zone).
Why the "Paints" Narrative is Fading (Bearish Drivers):
The "Grasim" Effect: The entry of the Aditya Birla Group (Grasim) into the paint sector has permanently altered the industry's competitive moat.
Asian Paints is no longer a monopoly; it's in a price war.
Margin Compression: Rising crude oil prices (a key raw material) combined with the inability to hike prices due to new competition is creating a "margin pincer" effect.
Real Estate Slowdown: With interest rates remaining "higher for longer" in 2026, the secondary home renovation market—Asian Paints' biggest cash cow—is seeing a significant volume drop.
The Strategy:
Immediate Resistance: ₹2,260 (The recent breakdown point).
Bearish Bias: Stay short as long as the stock trades below the 200-day EMA.
The "Value" Play: Only look for long-term accumulation if the stock stabilizes near the ₹1,400 log target.
#AsianPaint #Nifty50 #StockMarketIndia #Bearish #TechnicalAnalysis #HeadAndShoulders #Investing #MarketCrash #WealthProtection #TradingView
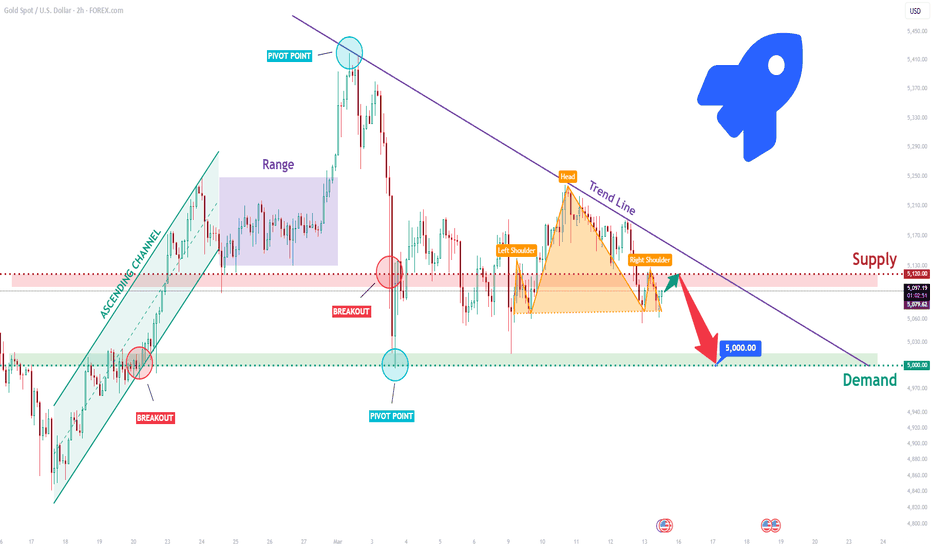
XAUUSD Short: Forms Head and Shoulders - Bears Target $5,000Hello traders! Here’s my technical outlook based on the current XAUUSD (2H) chart structure. Gold previously moved inside an ascending channel, where buyers maintained control and the market consistently formed higher highs and higher lows. During this bullish phase, price respected the rising support line until momentum weakened and the market transitioned into a sideways range, signaling temporary balance between buyers and sellers.
Currently, price is trading under a descending trend line and has formed a Head and Shoulders pattern near the 5,120 supply zone, signaling increasing selling pressure.
My primary scenario remains bearish as price remains below 5,120 resistance, the bearish bias remains valid. A rejection from this area could push gold toward the 5,000 demand zone, which is the main downside target. If price breaks above 5,120, the bearish scenario would weaken. Manage your risk.
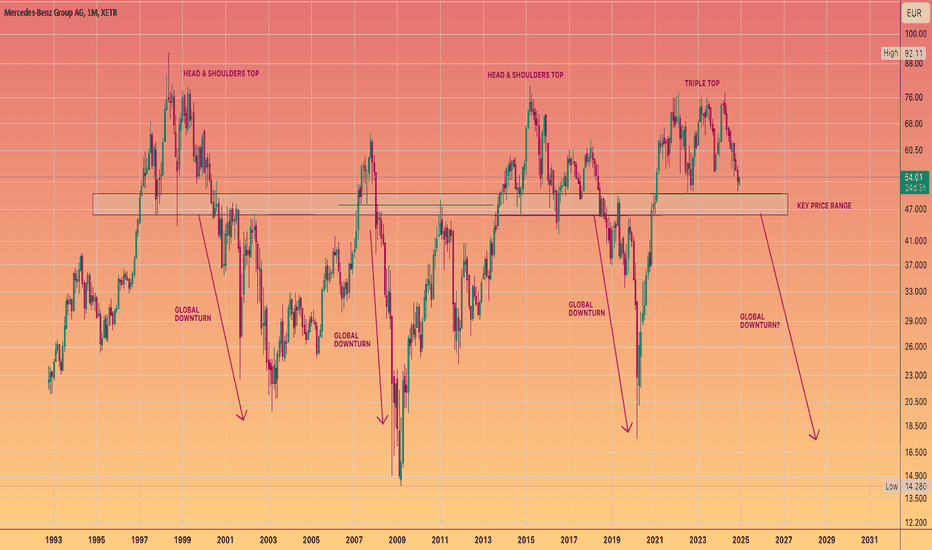
The Coming EU Recession into 2028, Mercedes BENZ $MBG Triple TopThe principal pillar of the European economy is Germany, recognized as its wealthiest nation.
A parallel can be drawn to the adage regarding America: when it experiences a minor setback, the global economy often faces significant repercussions.
It is often asserted that the essence of "Deutschland" is deeply rooted in its automotive industry, leading to its moniker as "Autoland." German automobiles have consistently been esteemed as the finest globally.
In fact, the most thriving economic engine in Europe has been heavily dependent on the automotive sector, and the initiatives aimed at addressing climate change have been likened to the act of vanquishing a vampire—driving a stake through its heart.
Volkswagen, the biggest car maker in Europe, is warning that it might have to cut thousands of jobs and close some factories in Germany. This is happening because they are having tough talks with unions about rising costs.
The push for climate-friendly cars has really affected how many people want to buy new vehicles, and they are also facing strong competition in the electric car market. The news about job cuts and possible factory shutdowns is causing a big stir around the world.
Other car companies like Mercedes Benz, BMW, and Ford are also making cuts and letting employees go. Volkswagen is planning to lay off tens of thousands of workers and is even thinking about closing some factories, which is a big deal. Bosch, the largest auto parts supplier in the world and a major employer in Germany, is also cutting hours and pay for around 10,000 workers. Even Meyer Werft, a shipbuilding company that has been around since the 1800s, recently needed a huge bailout of $423 million to stay out of bankruptcy.
The economic strategies implemented by Brussels have significantly weakened the overall economy of the European Union. Germany has remained committed to the traditional Mercantile economic model, maintaining elevated tax rates to curb inflation while producing goods for export to generate profits.
In 2023, the automotive sector is projected to represent as much as 17% of Germany's exports. This sector has created over 750,000 jobs. However, German manufacturing has struggled to achieve a full recovery since the COVID-19 pandemic in 2020, currently reaching only about 90% of its pre-pandemic output.
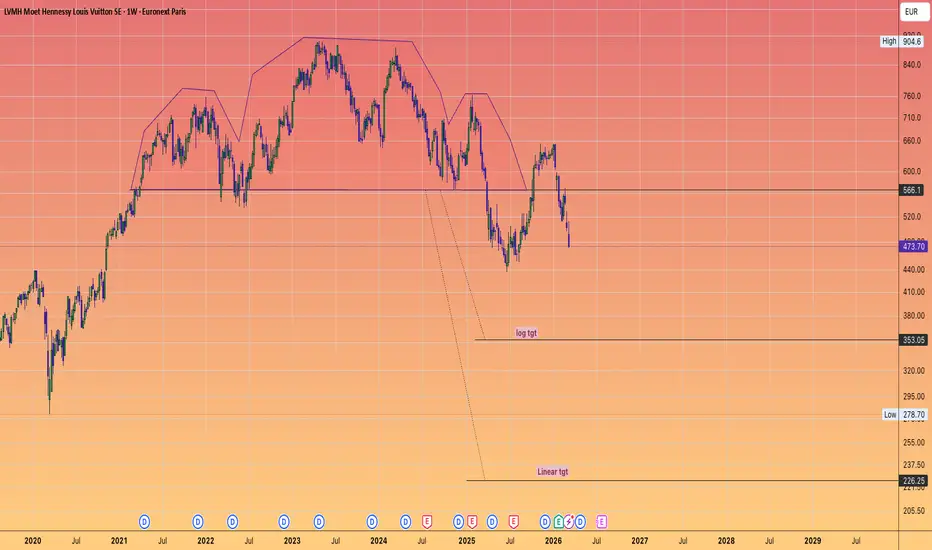
$LVMH: The End of the Luxury Super-Cycle?🥂🛑
Are the rich starting to feel the pinch?
The "SaaSpocalypse" discussed in IT has a luxury equivalent: Ubiquity Fatigue.
The "Aspirational" Collapse: The middle-to-high earners (the "HENRYs" — High Earners, Not Rich Yet) have been decimated by inflation and interest rates.
They were the volume drivers for entry-level Louis Vuitton and Dior. That engine is now cold.
The "Quiet Luxury" Pivot: The ultra-wealthy are moving away from loud, logo-heavy brands (which LVMH dominates) toward "Hyper-Exclusivity" and unbranded quality.
LVMH is now fighting a battle against "Luxury Fatigue."
The China Reset: For a decade, China was the 18% annual growth engine.
Today, it’s a "coming of age" market where local brands and value-consciousness are replacing the "status-at-any-cost" mindset.
What this means for the Global Economy:
LVMH is the "Global Consumer Confidence" ticker. If this breaks down, it signals a broader wealth contraction.
When the people who own everything start selling the brands that represent everything, the "Wealth Effect" that has propped up markets for years starts to invert.
#LVMH #LuxuryMarket #BernardArnault #MarketTop #GlobalEconomy #WealthGap #BearishAnalysis
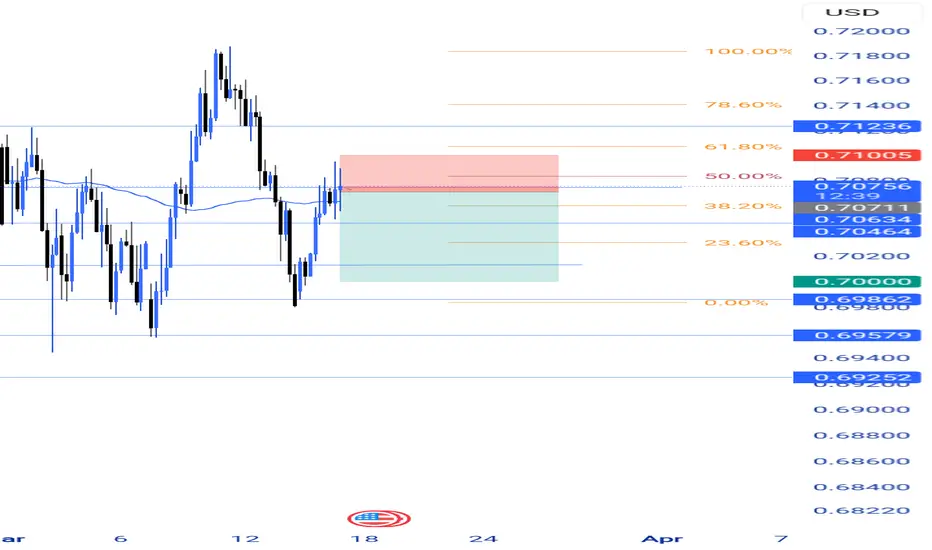
NZD/USD about to COLLAPSE - MAJOR EVENT COMINGLook at this multi decade head and shoulders pattern. If this thing breaks the 2020 Covid lows it is going to rapidly sell off to .5000.
This is a beautiful setup. Major confluence of long term historical support levels are just below .5000. I would buy it up once it gets there and potentially take it back up to .55