Head and Shoulders
EURUSD (12/05/26) long sentiment Hello everyone,
I thought I'd give an update on my EURUSD annotations and share with you all my thoughts on recent price action.
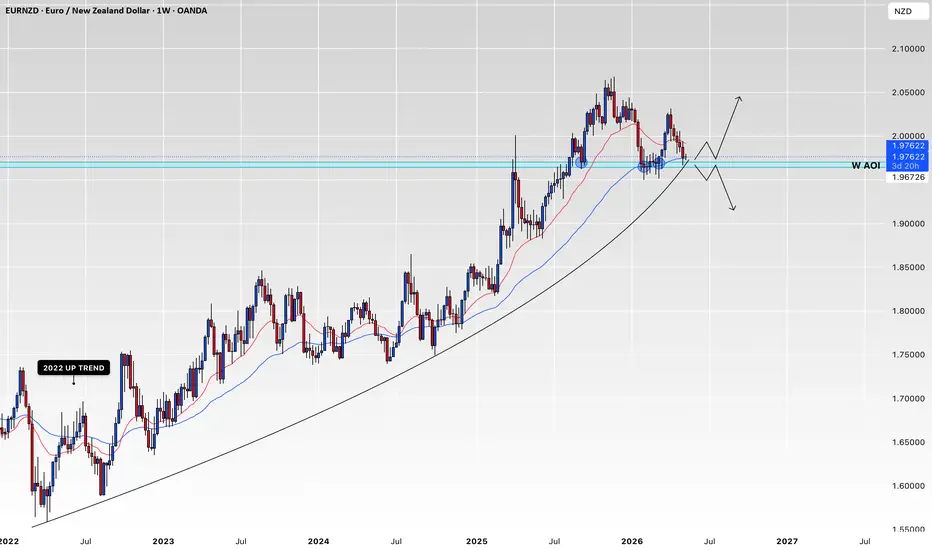
As we can see from my previous annotations I am expecting EURUSD long. Another piece of price action confirms this now, you can see this marked out on the chart. There is a head and shoulders structure that has been created on the 200 and 800 EMA.
Seeing this I don't believe price will come lower, however the long bias I hold will become invalidated if price close
US Oil is Primed for HigherTechnical Developments on US Oil:
* Inverse Head and Shoulders
* Upward Channel still intact.
Fundamentally based on a bet of a lasting stalemate between Iran and US. Strait of Hormuz staying closed for the rest of the month will start to push prices higher and compliancy dissipates.
Long AMEX:USO which benefits from the current backwardation environment in futures pricing.
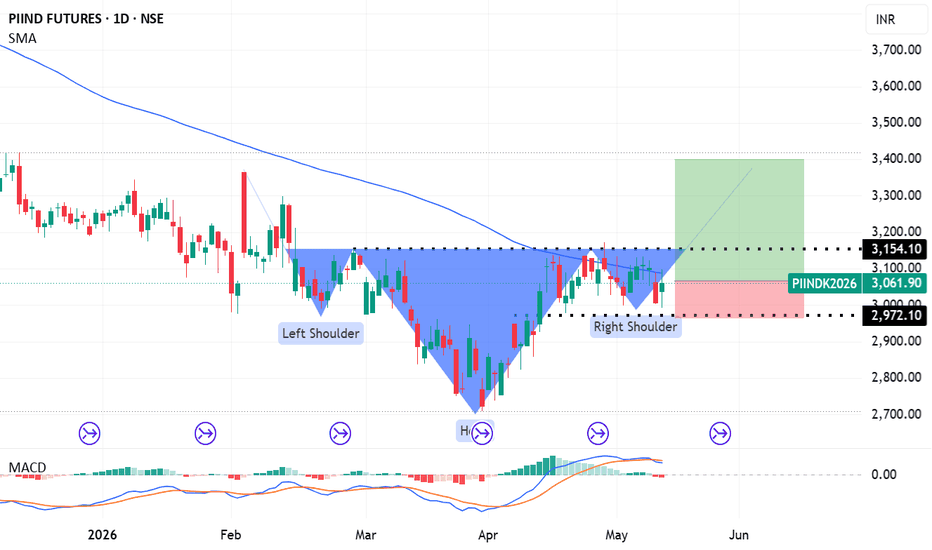
PIIND futures buy n sleep till may fut.13 May 2026, PI Industries (PIIND) futures have shown signs of a head and shoulder bullish reversal.
Pattern Status:
Technical analysis for May 2026 indicates that PIIND has broken above a short-term resistance level, with some views indicating a potential Inverted Head and Shoulders (IVHS) pattern in the making, aimed at shifting the trend from a previous downturn to an upward movement.
Target & Stoploss:
Recent technical views suggest that if the stock sustains its bullish momentum, it cou
USDCAD TP 1.380On the 4-hour chart, USDCAD has formed an Inverted Head and Shoulders pattern. Attention should currently be focused on the support level near 1.3690; a retest followed by stabilization would present an opportunity to consider further buying. Overhead resistance is noted near 1.3800, with a subsequent resistance level located near 1.3870 following a breakout.
Nasdaq Head and Shoulders with EVENING STAR IT'S OVER📋 NQ TRADE PLAN — TUE MAY 12, 2026
Current: 29,290 (London KZ, post-overnight bear thrust)
24h Range: 29,227 ↔ 29,479 (252pt — wide)
Bias going in: BEARISH structural, bull bounces tradeable
🗺️ KEY LEVELS
Zone Price Type
Strong resistance 29,500 Round number
Resistance 29,479-80 Yesterday RTH BSL (4× rejected)
Resistance 29,455 ETH bounce high
Pivot 29,400-410 OB / failed RTH pivot
Major flip 29,377 Yesterday RTH SSL → now resistance
Mid 29,300 Round / current chop center
Local low 29,271-79 Pr
USDCHF has formed a Head and Shoulders Bottom patternOn the 4-hour chart, USD/CHF has formed a potential Head and Shoulders Bottom pattern. Attention is currently focused on the resistance level near 0.7810; a breakout above this level would signal further upside, with the next resistance found near 0.7850.
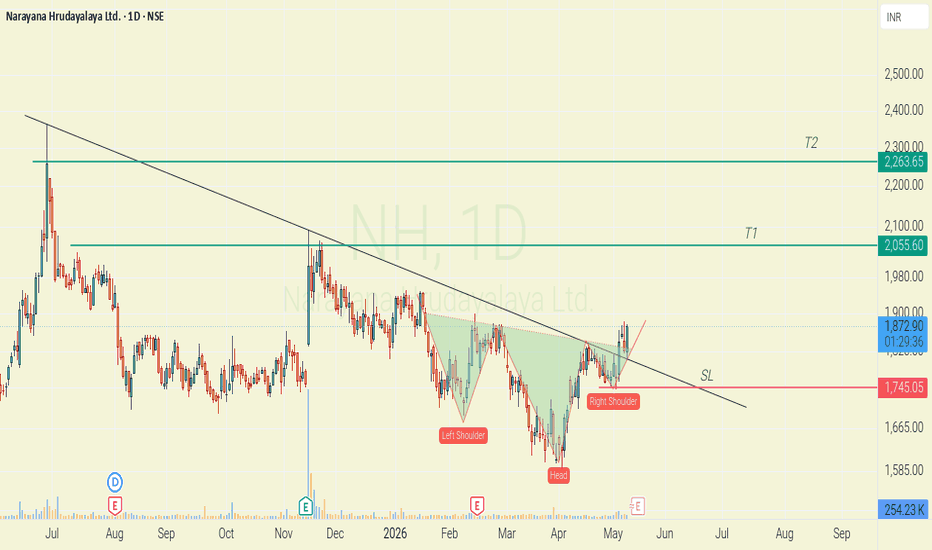
Reversal in Narayana Inv Head & ShoulderWe can see a textbook inv head and shoulder pattern forming in Narayana Hrudayalaya.
First Targets are the recent resistance as marked on the chart.
Sometimes if the stock is not in reversal it can go in side range bound. So SL usually is below right shoulder.
Healthcare index has shown breakout probability of this setup increases.
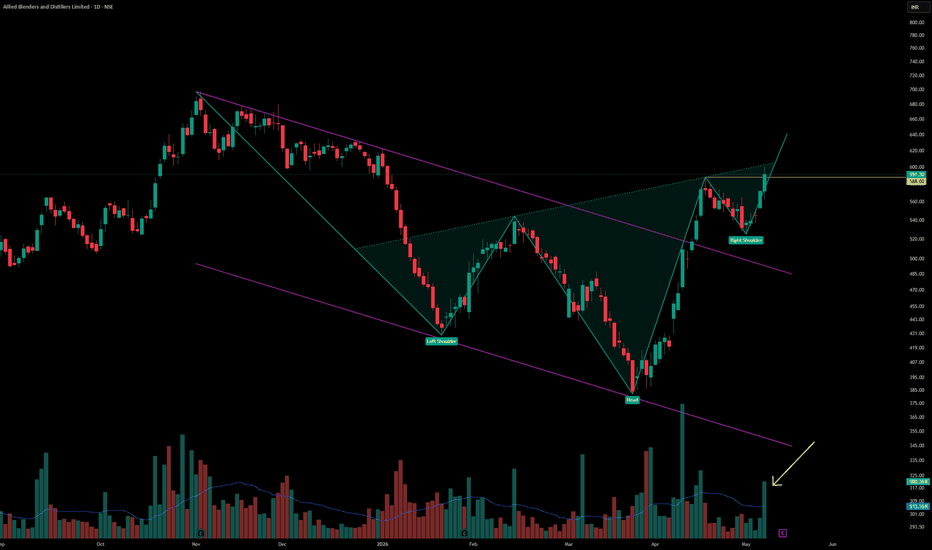
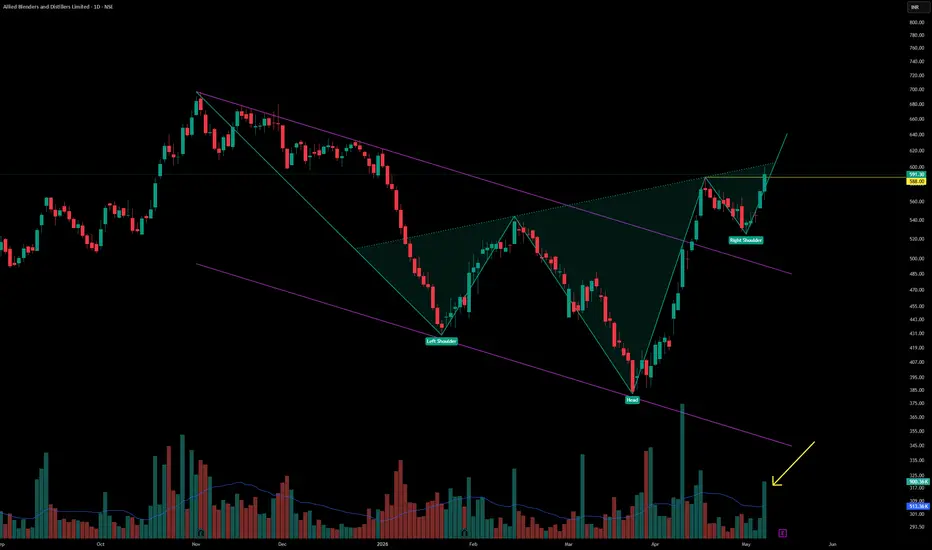
ABDLAllied Blenders & Distillers Ltd. (CMP ₹594, NSE: ABDL)
Prepared by Sucrit Patil | The SmartWay Research Desk | 9 May 2026
A Mumbai‑based Indian‑made foreign liquor (IMFL) company, incorporated in 1988. ABDL is India’s third‑largest spirits company, best known for its flagship brand Officer’s Choice whisky, one of the world’s largest selling whiskies. The company also markets premium brands such as Sterling Reserve, ICONiQ White, Kyron Brandy, Jolly Roger Rum, and Zoya Gin.
Promoter Holding (M
EURUSD: Inverse Head & Shoulders Signals Growth Toward 1.1810Hello everyone, here is my breakdown of the current EURUSD setup.
Market Analysis
EURUSD previously traded within a downward channel, confirming bearish momentum. After reaching the lower boundary of the structure, price formed a reversal and broke above the channel resistance, signaling the beginning of a bullish recovery.
Currently, EURUSD is holding above the 1.1720 support zone while trading near the 1.1810 resistance area. Price also formed an inverse head and shoulders pattern near sup
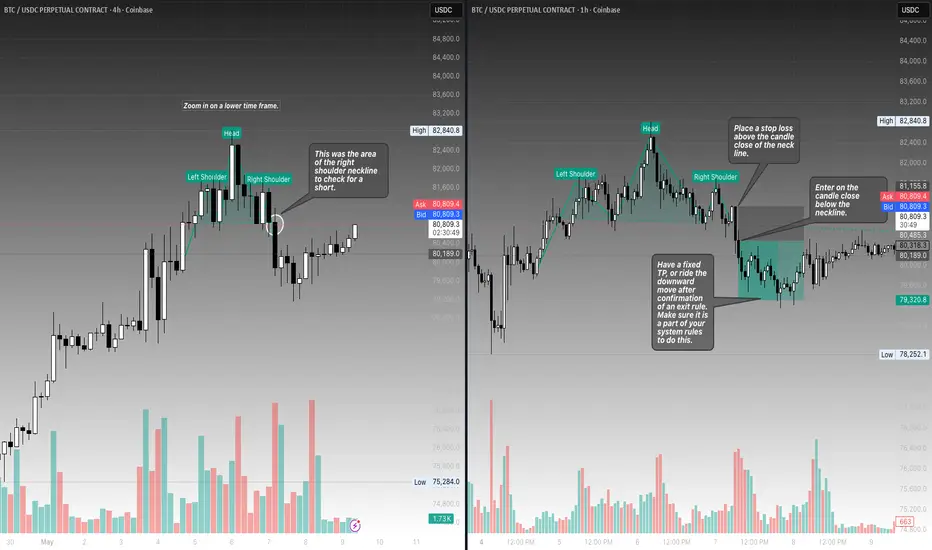
Recognizing Head and Shoulders Structure on the 4H TimeframeIn hindsight, it is easy to spot chart patterns. However, these setups can still be traded effectively if you recognize them in real time while monitoring your pairs. Another approach is to build a system around head and shoulders patterns and set price alerts to help capture these moves.
In this example, I identified a head and shoulders pattern on the 4H timeframe, then dropped to a lower timeframe to execute the trade based on predefined system rules.
Example system rules:
1. Wait for a ca
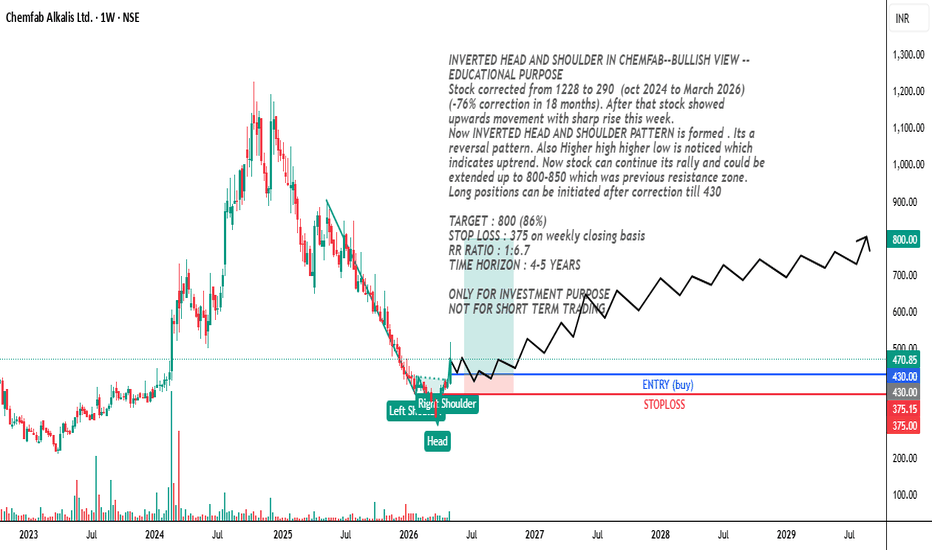
INV. HEAD AND SHOULDER IN CHEMFAB--EDUCATIONAL PURPOSEStock is corrected from 1228 to 290 (oct 2024 to March 2026) (-76% correction in 18 months). After that stock showed upwards movement with sharp rise this week.
Now INVERTED HEAD AND SHOULDER PATTERN is formed . Its a reversal pattern. Also Higher high higher low is noticed which indicates uptrend. Now stock can continue its rally and could be extended up to 800-850 which was previous resistance zone. Long positions can be initiated after correction till 430
TARGET : 800 (86%)
STOP LOSS : 375
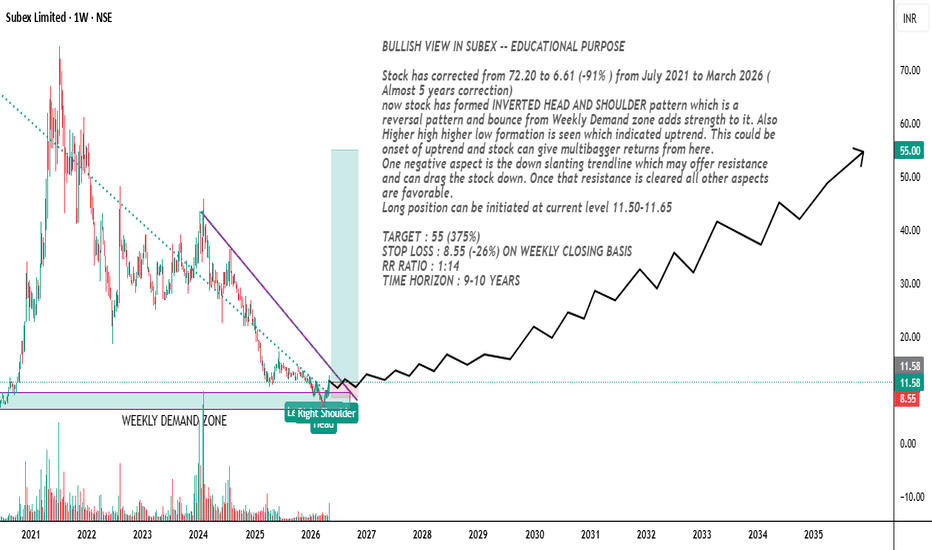
BULLISH VIEW IN SUBEX -- EDUCATIONAL PURPOSEStock has corrected from 72.20 to 6.61 (-91% ) from July 2021 to March 2026 ( Almost 5 years correction)
now stock has formed INVERTED HEAD AND SHOULDER pattern which is a reversal pattern and bounce from Weekly Demand zone adds strength to it. Also Higher high higher low formation is seen which indicated uptrend. This could be onset of uptrend and stock can give multibagger returns from here.
One negative aspect is the down slanting trendline which may offer resistance and can drag the stock d
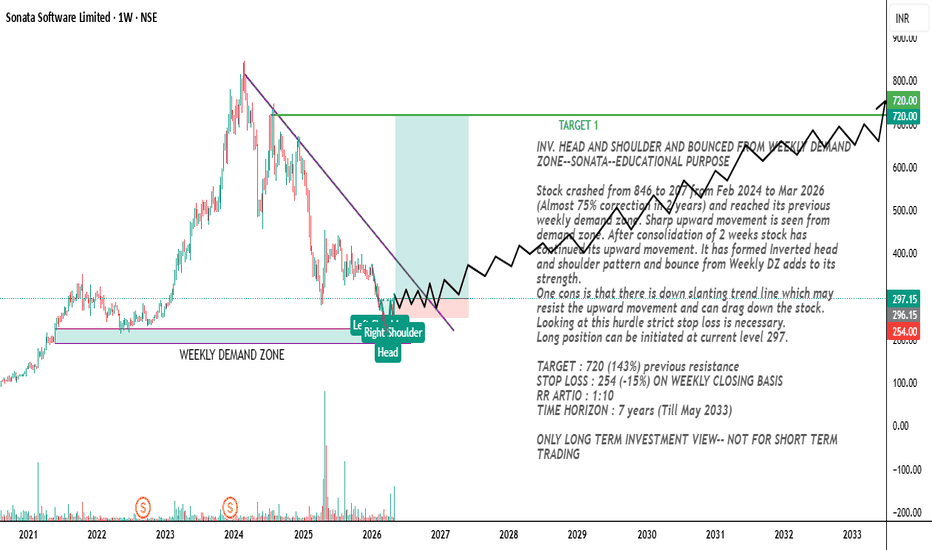
INV. HEAD AND SHOULDER--SONATA--EDUCATIONAL PURPOSE
Stock crashed from 846 to 207 from Feb 2024 to Mar 2026 (Almost 75% correction in 2 years) and reached its previous weekly demand zone. Sharp upward movement is seen from demand zone. After consolidation of 2 weeks stock has continued its upward movement. It has formed INVERTED HEAD AND SHOULDER pattern and bounce from Weekly DZ adds to its strength.
One cons is that there is down slanting trend line which may resist the upward movement and can drag down the stock. Looking at this hurdle strict
EURUSD: Rejection from Resistance Targets Lower Support LevelsHello everyone, here is my breakdown of the current EURUSD setup.
Market Analysis
EURUSD previously traded inside a downward channel, confirming bearish momentum. After breaking lower, price formed a range near support and later reversed through an inverse head and shoulders pattern, triggering a short-term recovery.
Currently, price is trading below the 1.1750 resistance zone inside a new descending channel, while holding above the 1.1630 support zone. Recent rejection from resistance confi
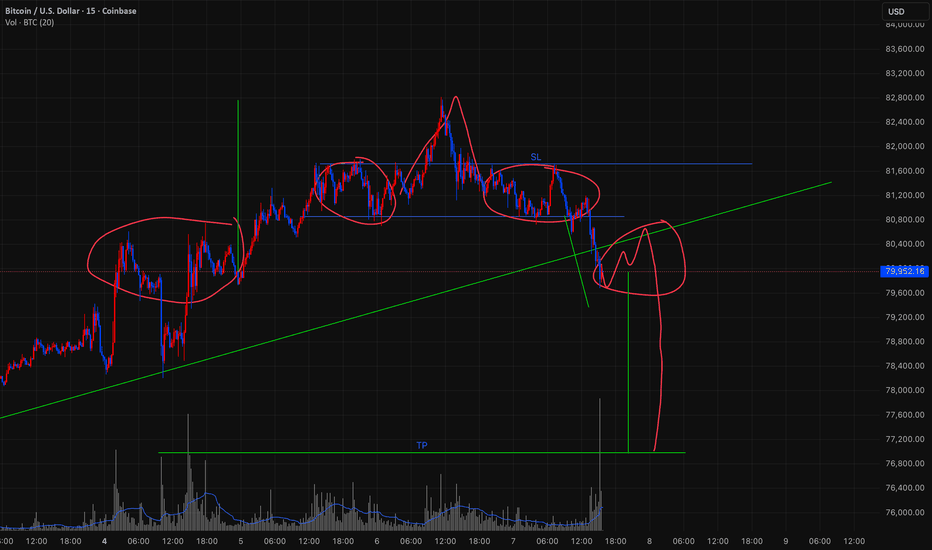
Possible H&S bitcoin fractalCOINBASE:BTCUSD You can see it made a head and shoulders to get us to where we are now about but it looks like da bullz are not giving up easy and so if its gona go lower it could retest 80.7k to make the right shoulder and then go down to 77k which is about where the lower band of the bull market support band is currently at. Me thinky 81.7k should be SL incase we get mega regarded buying and shoom up to 83k. Enter short now and double down if it prints that 80.7k and get out if it goes up to
HYPE - Medium Term SHORTHype is falling out of a rising wedge, and has developed a head and shoulders at the top of its advance.
There is clear bearish divergence on the daily RSI.
I personally shorted in this current area.
Take profit 1: $32.50-30.00
Take profit 2: $27.00-$24.23
Take profit 3: $21.50-$18.50
Please always use a stop/loss, and of course this isn't financial advice : )
Thank you!
EURUSD Long: Bullish Structure in Play - Buyers Target 1.1830Hello traders! Here’s my technical outlook based on the current EURUSD (4H) chart structure. EURUSD previously traded within a range before breaking below the demand zone. After forming a bottom at a pivot point, price reversed and developed an inverse head and shoulders pattern, signaling a shift toward bullish momentum.
Currently, EURUSD is trading above the 1.1740 demand zone, which now acts as support, while approaching the 1.1830 supply zone. Price is also moving within an ascending channe