S&P 500 Daily Chart Analysis For Week of Sep 11, 2026Technical Analysis and Outlook:
In last week's trading session, the S&P 500 index (Spooz) dropped sharply to test the crucial Mean Support level at 7,611. It marked this support level by completing an In-Force Retracement movement and establishing a renewed Mean Support at 7,590.
Looking at the potential upside, the Spooz index shows the possibility of rising to the Mean Resistance at 7,695, then extending to the Mean Resistance at 7,750, the Key Resistance at 7,800, and taking another shot at
Investing
EUR/USD Daily Chart Analysis For Week of Sep 11, 2026Technical Analysis and Outlook:
In last week's trading session, the Eurodollar bounced back strongly to the Mean Resistance level of 1.165, then sharply retreated to retest the well-established, previously tested Mean Support level of 1.157. There is also a possibility of a further decline to the Mean Support at 1.152.
On the upside, the euro is indicating a potential retest of the robust Mean Resistance at 1.165, with the possibility of breaking out to the Mean Resistance at 1.168. The critic
Bitcoin(BTC/USD) Daily Chart Analysis For Week of Sep 11, 2026Technical Analysis and Outlook:
Bitcoin recently experienced a significant upward movement in the last trading session, successfully retesting the Mean Resistance level at $79,500. It has also established a solid support level at $76,300. Following this, the price identified an Intermediate Inner Coin Dip target at $75,400 and another at $72,200.
On the upside, the price movement indicates a potential intermediate rebound that may lead to another attempt to retest the Mean Resistance at $79,50
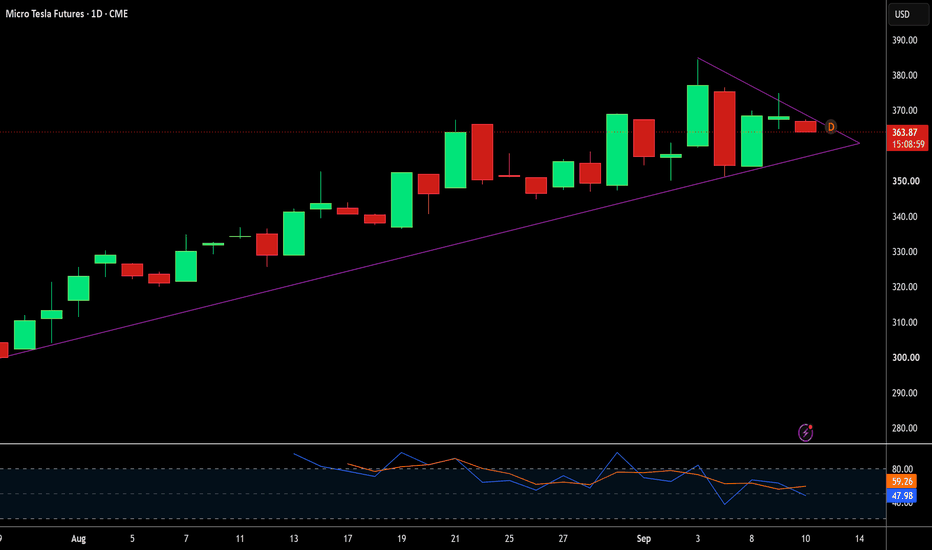
Can Micro Futures Tame Tesla's (TSLA) Volatile AI Future?Wall Street closely monitors Tesla as equity markets navigate shifting interest rate expectations. Micro futures contracts on Tesla now offer traders fractional equity exposure with reduced capital demands. Derivative markets price in substantial price swings following recent vehicle delivery figures and earnings reports. Investors utilize these micro contracts to hedge high-beta tech exposure during volatile trading sessions.
Geopolitical Dynamics and Global Expansion
Regulatory approval acr
Split the entry and the stop moves with it
Most people run one clock over everything they own. One method, one holding period, one way of placing a stop, applied to a two-week idea and a two-year idea alike.
That's how you end up right about a company and stopped out of it anyway.
Take the slow version, a position built around a rising long-term average rather than around a weekly trigger. Price finally arrives in the area you'd been waiting for. Three things are now different from a swing entry, and only one of them is obvious.
Fir
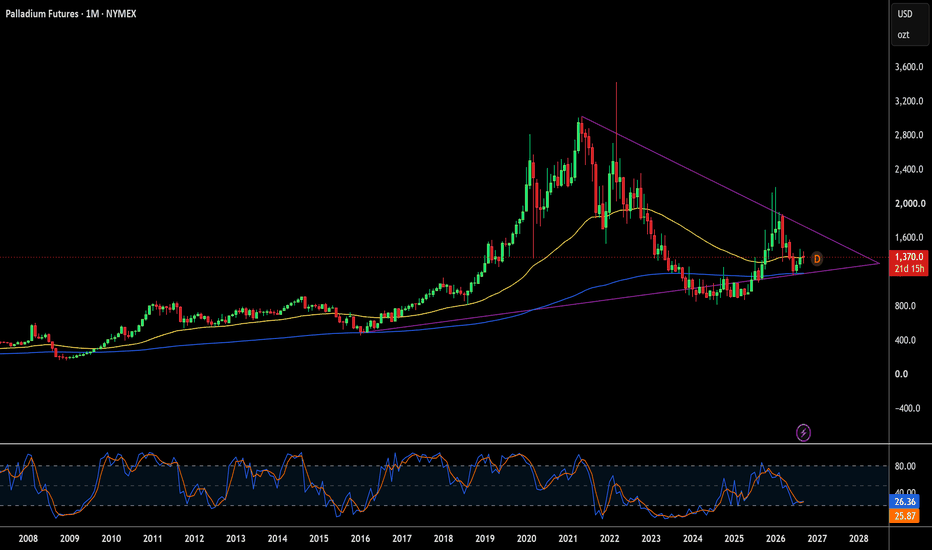
Can Palladium (PA) Futures Break the $1,400 Barrier?Palladium futures recently rallied from June lows near $1,177 to test the key $1,400 resistance level. The metal still trades far below January's peak above $1,900. Geopolitical friction drives this price volatility. Russia's Nornickel commands roughly 40% of global primary palladium output. Western sanctions risk continuously threatens to disrupt these vital export routes. Meanwhile, South African mines face severe power grid instability, aging infrastructure, and rising labor costs. Together,
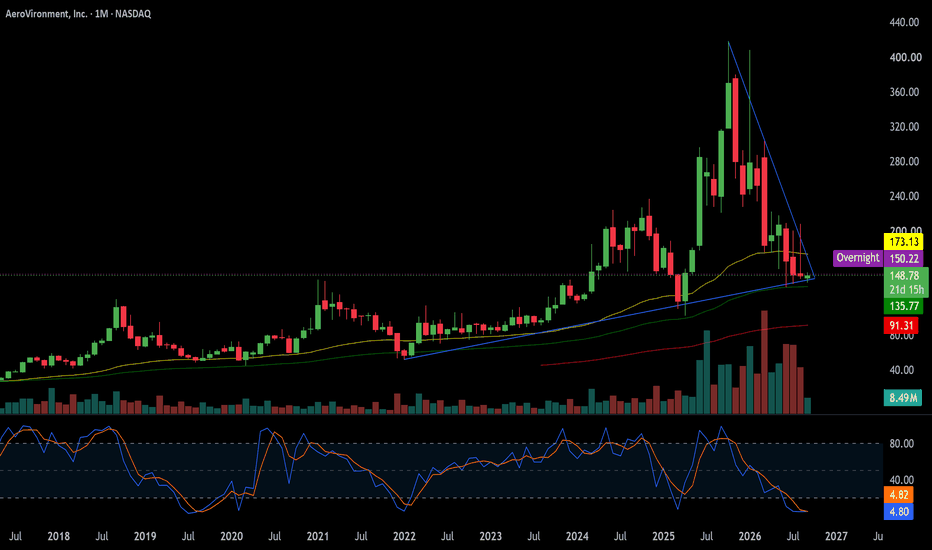
Can AeroVironment Redefine Warfare Economics?AeroVironment approaches its fiscal first quarter 2027 earnings report, due September 9, with massive operational momentum across global defense markets. Fourth quarter fiscal 2026 revenue soared 133.3% year over year to $641.62 million, and adjusted diluted earnings reached $1.84 per share, easily beating Wall Street consensus forecasts. Management targets long-term annual revenues between $3.5 billion and $4.0 billion by FY30. However, rapid scaling created a temporary negative net margin, wit
Trading's Toughest Battle Happens in Your MindMost traders spend years learning technical analysis, studying chart patterns, tracking market news, and searching for the perfect strategy. However, many eventually discover that having a good strategy is only one part of becoming successful. The real challenge often begins when money is at risk and emotions start influencing decisions.
Trading is not just a test of market knowledge. It is also a test of patience, discipline, self-awareness, and emotional control. A trader may know exactly wha
CAT: Excavator digs for bottom. Found it?NYSE:CAT
It seems Caterpillar is getting ready to build not just data centers, but also new all-time highs in our brokerage accounts.
On the industrial horizon, one of the cleanest reversal setups of the year is taking shape. CAT shares have completed a large-scale correction from the all-time high of $1,073.46 and are approaching the most important point of the cycle. The chart is forming a classic potential double bottom pattern right at the 200-day moving average, the primary long-term r
Apple Pulls Back From Resistance — Can Bulls Defend the Uptrend?Market Structure
Apple remains within a broader bullish trend despite the recent pullback from its latest swing high. The series of higher highs and higher lows is still intact, but short-term momentum has weakened after failing to sustain prices above the recent peak. Price is now retracing toward a key support area where buyers will need to step in to preserve the broader uptrend.
Market Sentiment - Moderately Bullish
Overall sentiment remains cautiously bullish. Although recent profit-t
S&P 500 Daily Chart Analysis For Week of Sep 4, 2026Technical Analysis and Outlook:
In the prior week's trading session, the S&P500 index rose progressively higher after retesting the crucial Mean Support level at 7,643 and re-marking the support level to a new Mean Support level of 7,611.
In the upside scenario, the index pattern indicates a retest of In-Force Rebound prices to the Mean Resistance level at 7,767, extending to do-over the completed Outer Index Rally at 7,815, driving through the Key Resistance level marked at 7,800.
Neverthele
EUR/USD Daily Chart Analysis For Week of Sep 4, 2026Technical Analysis and Outlook:
In the previous week's trading session, Eurodollar rebounded strongly from the Mean Support level at 1.157. It is now aiming to reach the important Mean Resistance level at 1.165. There is a possibility that the rebound could extend in the upcoming week's trading session, potentially retesting the Mean Resistance at 1.168 and the critical target, marked as the completed Inner Currency Rally, at 1.171.
On the downside showing, there is a possibility of hitting an
Bitcoin(BTC/USD) Daily Chart Analysis For Week of Sep 4, 2026Technical Analysis and Outlook:
Bitcoin has demonstrated a robust upward movement to retest the Inner Coin Rally at $81,300 and, after hitting the vital Key Resistance of $82,200, has retreated swiftly, aiming to address the resilient Mean Support at $76,300 and retreat to additional Mean Support at $74,600 and $72,200.
On the upside, price action suggests a potential intermediate rebound that may lead to another retest of the Inner Coin Rally at $81,300. This could allow for another attempt t
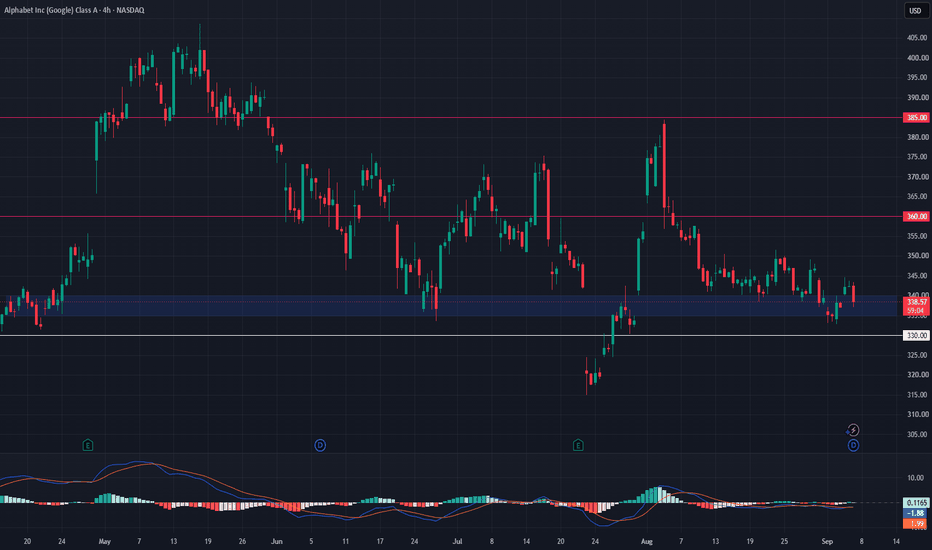
Alphabet (GOOGL) Bullish Setup: Breakout Potential Toward $385Alphabet NASDAQ:GOOGL is holding a multi-week consolidation base and has bounced from key support near $338.
The bullish outlook is supported by strength in digital advertising, Google Cloud, and Gemini AI adoption. As long as support holds, GOOGL could continue higher toward $360 and potentially $385.
Trading Levels
Entry: $335–$340
TP1: $360
TP2: $385
Stop Loss: $330
Support: $330–$335
The bullish setup remains valid while price holds above $330.
Can Japan Tame the Dollar (USD/JPY) Without Crashing Markets?Macroeconomics and Yield Differentials
Unusually high interest rate differentials drive the USD/JPY currency pair. The Federal Reserve maintains elevated interest rates to combat sticky inflation. Meanwhile, the Bank of Japan cautiously raises policy rates from multi-decade lows. The Japanese policy rate now stands at 1 percent, the highest since 1995. Higher US Treasury yields continue to attract global institutional capital. Consequently, the US dollar retains a significant structural yield a
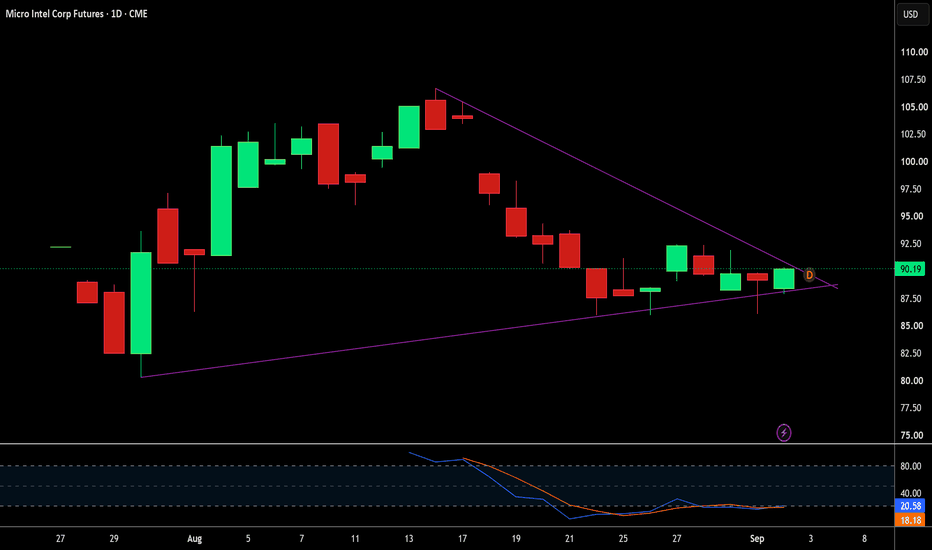
Can Intel (INTC) Outpace TSMC With Silicon Photonics?Geopolitics and Strategic Manufacturing
Intel is executing a massive domestic expansion in advanced packaging. The company's Fab 9 facility in New Mexico offers unmatched multi-tenant manufacturing. This onshore infrastructure reduces reliance on foreign semiconductor foundries.
Global defense agencies require secure domestic hardware supply chains. Intel now manufactures custom hybrid processors for defense and space applications. These specialized chips integrate diverse node designs onto a
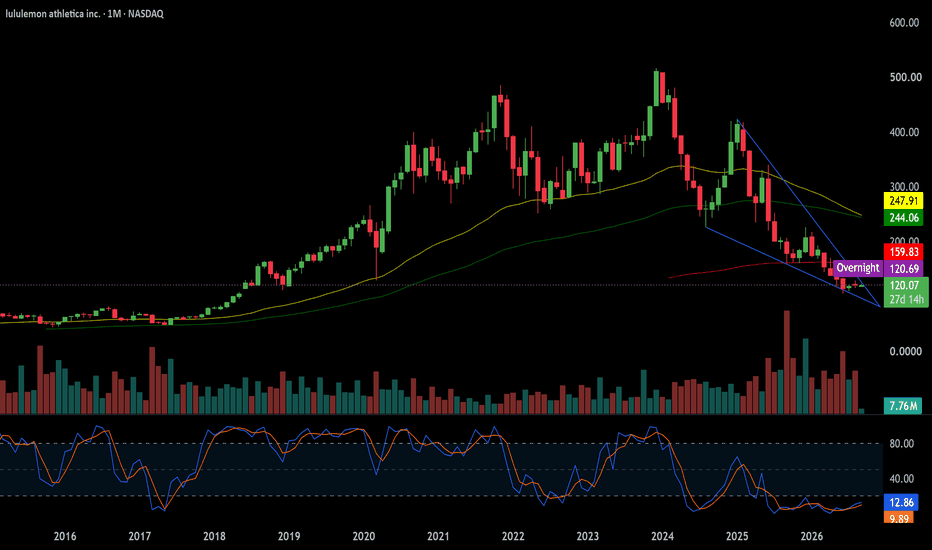
Can Tech Patents Rescue Lululemon Stock?Lululemon reports second-quarter results on Thursday, September 3, 2026. Wall Street expects adjusted earnings around $1.79 per share, down 42% from last year. Revenue guidance sits between $2.45 billion and $2.475 billion. The real market risk centers on full-year guidance. Incoming chief executive Heidi O'Neill takes charge one week after the release. Investors fear interim leadership will slash annual targets to give O'Neill a clean slate.
Patent Science and High-Tech Innovation
Lululemon
Will the Rupee Crush 94 or Bow to $96 Oil?The Indian Rupee approaches a critical juncture against the US Dollar in September 2026. Spot rates hover near 94.95. Market forces pull the currency in opposite directions. The Reserve Bank of India drives structural appreciation. Global energy shocks threaten sudden depreciation. Which force will prevail? This article breaks down the complex drivers shaping the exchange rate.
Geopolitics and Geostrategy
Tensions escalate rapidly in the Middle East. US Central Command recently struck Iranian
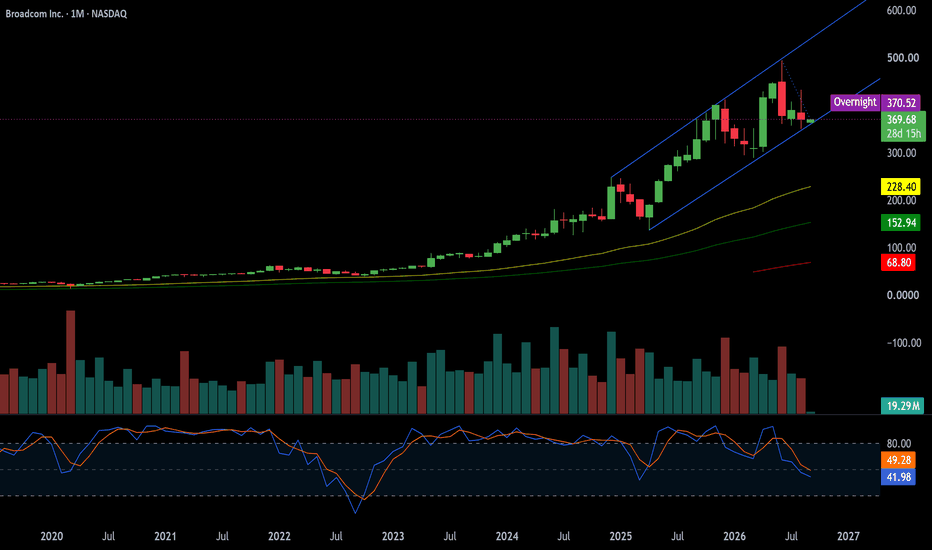
Broadcom: Can Patents Power a $100B AI Bet?Broadcom (NASDAQ: AVGO) reports fiscal Q3 2026 earnings on Wednesday, September 2, after the market closes. Wall Street expects one of the most extreme growth prints in large-cap history. Consensus calls for roughly $29.43 billion in revenue, matching management’s own guidance for 84% year-over-year growth against $15.95 billion a year ago. Analysts model non-GAAP EPS near $3.24, roughly double last year’s $1.69.
The AI number matters most. Hock Tan guided AI semiconductor revenue to $16.0 bill
The strongest six-month trend has no momentum leftMost screens measure one thing and call it a signal. Run two and the interesting answers are where they disagree.
Take a six-month trend reading and a one-month momentum reading across the US sectors this morning.
Semiconductors are up 40.5% over six months. Strongest structure of any sector, by a distance. Over the last month they've done −0.2%. Nothing.
So the best-looking trend on the board belongs to the thing that has stopped moving. Trend alone says buy it. Momentum alone says nothing
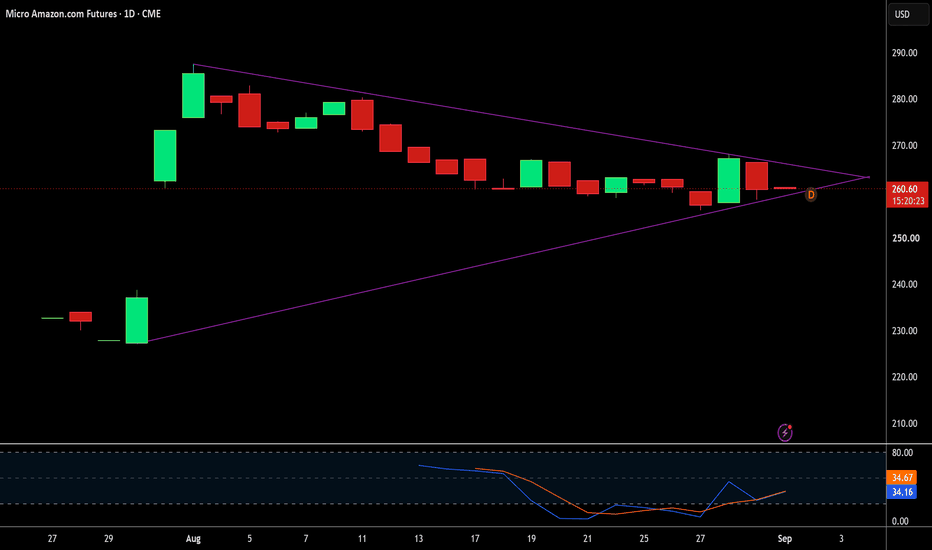
Are Amazon Micro Futures the Ultimate Retail Hedge?Single-stock micro futures now offer retail investors fractional derivative exposure to Amazon. Trading on regulated exchanges like the CME provides leverage with lower capital requirements. However, mounting regulatory challenges threaten short-term market stability. The Federal Trade Commission and 22 states recently sued Amazon over advertising auction practices. Regulators allege the company extracted over 20 billion dollars in undisclosed surcharges from merchants. Investors must navigate t
SPY: The After-Window Opened on an Oil Shock...On 21 August I published the CME September curve at 34.6% hike against 65.4% hold and flagged Warsh Friday as the reaction function reveal.
He gave it.
About twenty points of hike moved in the hour he spoke, and the curve kept going. Monday's pull reads September 66.1% hike against 33.9% hold, October 74.4% hike, December 89.0% hike, and ease 0.0% at all three. September was 57.0% on Friday and 41.4% a week ago, though it also read 67.0% on 31 July, so the front end has round-tripped a month
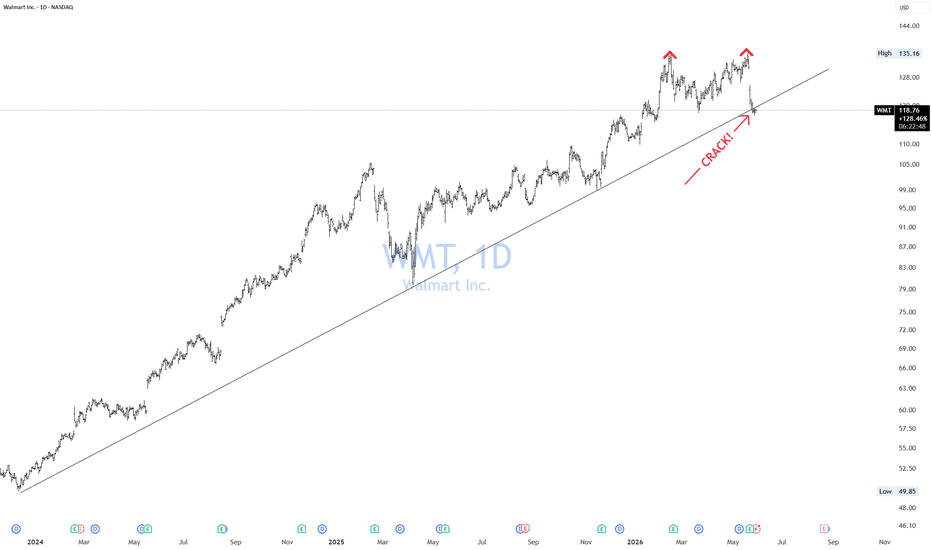
WMT CRACK!WMT is cracking the 2-year trendline off the 2022 low — down ~12% from the 135 high, now testing ~119 support.
The fundamental tell: revenue growth looks fine on paper (~5%/yr) but that's nominal. Net of ~3% inflation, real growth is barely ~1.5%/yr. Paying a premium multiple for a retailer with stalling real demand.
WMT is up 170% since 2024; why exactly? Like the rest of the market, it makes no sense to pay up for less and less value.
Let’s push it to 7,000 and share so I can help others a