BTC Testing the Range High — Breakout or Bull Trap?Good morning, friends!
Bitcoin — as expected 🙂
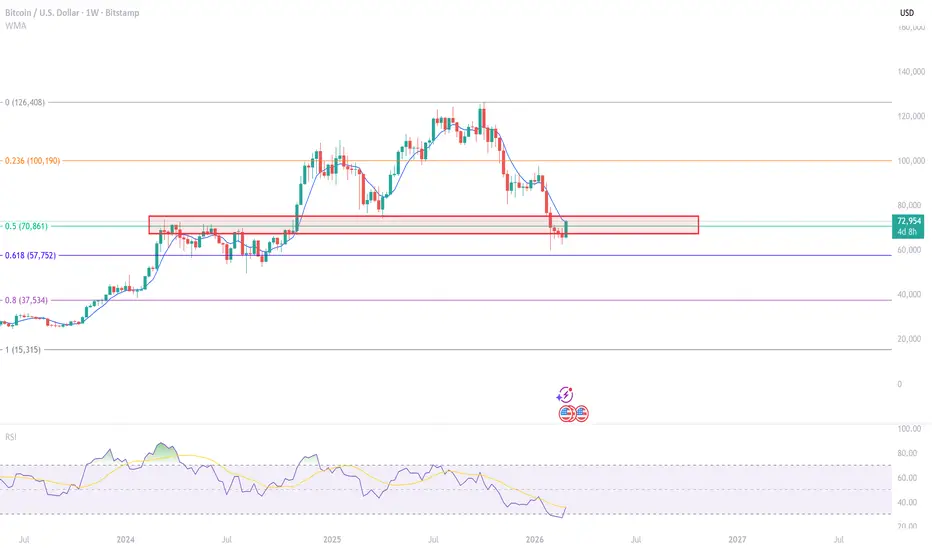
I previously mentioned that the chart looked strong and that we would likely test 70,000.
For the signals indicating a breakout, check yesterday’s market review — everything was explained there in detail.
At the same time, we need to watch price behavior at current levels carefully, as “the upper boundary of the local trading range is around 72,000 — this is where aggressive selling may begin (similar to how buyers step in near 60,000).”
Holding above the current levels for 8–12 hours (ideally with a retest of 70,300–71,000 during this period) would confirm the breakout and open the path toward 78,000–80,000.
However, never forget about the bearish scenario — this is crypto after all.
If price fails to hold above 72,000 and the breakout turns out to be false, we could see a move back into the range — toward the middle or even the lower boundary.
In that case, the market maker essentially sold you the breakout at 71,000–74,000 and will continue re-accumulating in the 60,000–70,000 range.
Peace to everyone! 🙏  Long
Long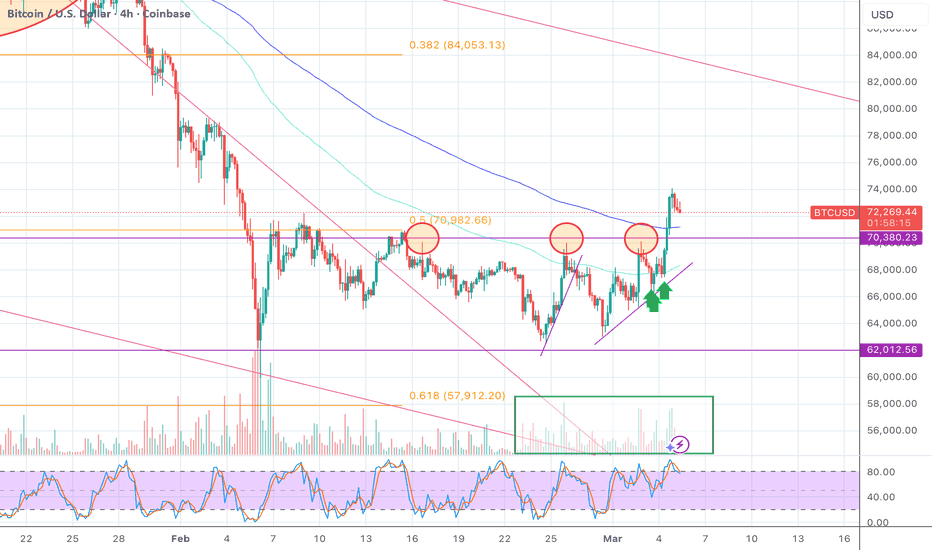
 Short
Short
B&G Foods | BGS | Long at $4.45B&G Foods NYSE:BGS , owner of over 50 food brands including Green Giant, Ortega, Cream of Wheat, Mrs. Dash, and Crisco, has dropped nearly 92% in price since its high in 2021. Currently trading at $4.43 and with a book value of $6.43, NYSE:BGS may have some running room in the next 1-2 years for a forward P/E of 10x (currently negative, so there is anticipated growth, though small). This is another company that would greatly benefit from lowered interest rates due to its high debt-to-equity (4x).
So, while debt and consumer spending declines may pose a threat to NYSE:BGS , I believe it is currently undervalued. If the stock drops due to poor earnings (which could drop to under $2.00), I will be entering another position unless fundamental / outlook truly change.
Thus, at $4.45, NYSE:BGS is in a personal buy zone.
Targets into 2027:
$5.25
$6.25
 Long
Long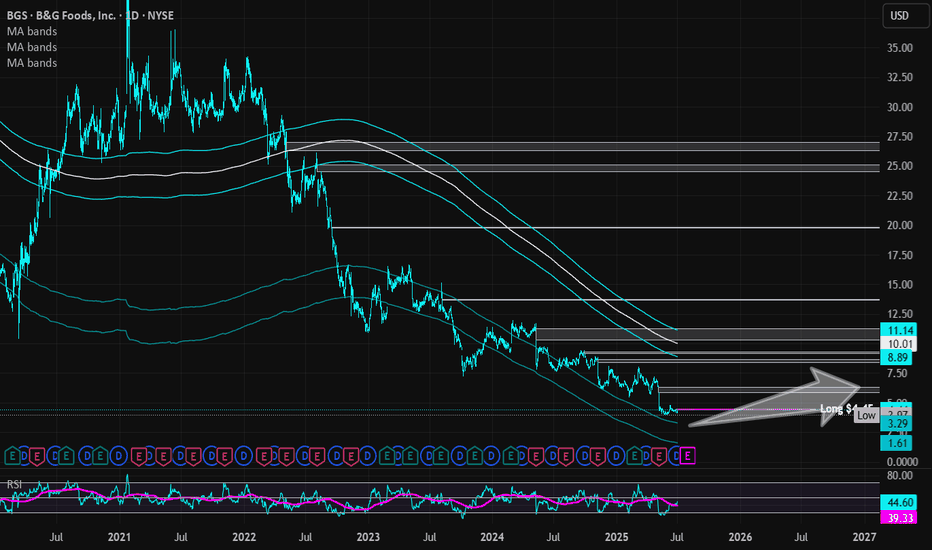
Is Apple Rolling Over?Apple has done little for a long time, and some traders may think the tech giant is rolling over.
The first pattern on today’s chart is the weekly close of $278.78 on December 5. AAPL tried to cross above that level the following week but failed. It was revisited early last month without breaking. That may suggest resistance is in place.
Second, the 50-day simple moving average (SMA) is falling and prices have struggled to remain above it. The stock is also slipping below its 100-day SMA. Those points may reflect weakening momentum over the intermediate term.
Third, prices dropped below their 21-day exponential moving average last week and have stayed there since. That may reflect short-term bearishness.
Fourth, converging lines form a potential triangle. Could prices start moving after this period of tightening?
Next, AAPL’s last two earnings reports beat expectations. The stock briefly rallied both times, but with little follow-through. That may reflect limited enthusiasm toward the name.
Finally, AAPL is a highly active underlier in the options market. Its daily average volume of 1.1 million contracts ranks third in the S&P 500, according to TradeStation data. That could help traders take positions with calls and puts.
TradeStation has, for decades, advanced the trading industry, providing access to stocks, options and futures. If you're born to trade, we could be for you. See our Overview for more.
Past performance, whether actual or indicated by historical tests of strategies, is no guarantee of future performance or success. There is a possibility that you may sustain a loss equal to or greater than your entire investment regardless of which asset class you trade (equities, options or futures); therefore, you should not invest or risk money that you cannot afford to lose. Online trading is not suitable for all investors. View the document titled Characteristics and Risks of Standardized Options at www.TradeStation.com . Before trading any asset class, customers must read the relevant risk disclosure statements on www.TradeStation.com . System access and trade placement and execution may be delayed or fail due to market volatility and volume, quote delays, system and software errors, Internet traffic, outages and other factors.
Securities and futures trading is offered to self-directed customers by TradeStation Securities, Inc., a broker-dealer registered with the Securities and Exchange Commission and a futures commission merchant licensed with the Commodity Futures Trading Commission). TradeStation Securities is a member of the Financial Industry Regulatory Authority, the National Futures Association, and a number of exchanges.
Options trading is not suitable for all investors. Your TradeStation Securities’ account application to trade options will be considered and approved or disapproved based on all relevant factors, including your trading experience. See www.TradeStation.com . Visit www.TradeStation.com for full details on the costs and fees associated with options.
Margin trading involves risks, and it is important that you fully understand those risks before trading on margin. The Margin Disclosure Statement outlines many of those risks, including that you can lose more funds than you deposit in your margin account; your brokerage firm can force the sale of securities in your account; your brokerage firm can sell your securities without contacting you; and you are not entitled to an extension of time on a margin call. Review the Margin Disclosure Statement at www.TradeStation.com .
TradeStation Securities, Inc. and TradeStation Technologies, Inc. are each wholly owned subsidiaries of TradeStation Group, Inc., both operating, and providing products and services, under the TradeStation brand and trademark. When applying for, or purchasing, accounts, subscriptions, products and services, it is important that you know which company you will be dealing with. Visit www.TradeStation.com for further important information explaining what this means.  Long
Long
 Short
Short
Nike May Be StaggeringNike has been staggering for months, and some traders may see downside risk.
The first pattern on today’s chart is the series of higher lows since late December. The footwear company closed below that line yesterday, which could be interpreted as a bear-flag breakdown.
Second, the series of lower highs since late 2025 (marked with yellow arrows) may reflect a longer-term downtrend.
Third, the 50-day simple moving average (SMA) had a “death cross” below the 200-day SMA in November. That could also reflect long-term weakness.
Fourth, the 8-day exponential moving average (EMA) is below the 21-day EMA. Does that signal short-term bearishness?
Next, some traders may expect prices to revisit their seven-year low at $52.28.
Finally, NKE is an active underlier in the options market. (It averages about 90,000 contracts per session, according to TradeStation data.) That could help traders take positions with calls and puts.
TradeStation has, for decades, advanced the trading industry, providing access to stocks, options and futures. If you're born to trade, we could be for you. See our Overview for more.
Past performance, whether actual or indicated by historical tests of strategies, is no guarantee of future performance or success. There is a possibility that you may sustain a loss equal to or greater than your entire investment regardless of which asset class you trade (equities, options or futures); therefore, you should not invest or risk money that you cannot afford to lose. Online trading is not suitable for all investors. View the document titled Characteristics and Risks of Standardized Options at www.TradeStation.com . Before trading any asset class, customers must read the relevant risk disclosure statements on www.TradeStation.com . System access and trade placement and execution may be delayed or fail due to market volatility and volume, quote delays, system and software errors, Internet traffic, outages and other factors.
Securities and futures trading is offered to self-directed customers by TradeStation Securities, Inc., a broker-dealer registered with the Securities and Exchange Commission and a futures commission merchant licensed with the Commodity Futures Trading Commission). TradeStation Securities is a member of the Financial Industry Regulatory Authority, the National Futures Association, and a number of exchanges.
Options trading is not suitable for all investors. Your TradeStation Securities’ account application to trade options will be considered and approved or disapproved based on all relevant factors, including your trading experience. See www.TradeStation.com . Visit www.TradeStation.com for full details on the costs and fees associated with options.
Margin trading involves risks, and it is important that you fully understand those risks before trading on margin. The Margin Disclosure Statement outlines many of those risks, including that you can lose more funds than you deposit in your margin account; your brokerage firm can force the sale of securities in your account; your brokerage firm can sell your securities without contacting you; and you are not entitled to an extension of time on a margin call. Review the Margin Disclosure Statement at www.TradeStation.com .
TradeStation Securities, Inc. and TradeStation Technologies, Inc. are each wholly owned subsidiaries of TradeStation Group, Inc., both operating, and providing products and services, under the TradeStation brand and trademark. When applying for, or purchasing, accounts, subscriptions, products and services, it is important that you know which company you will be dealing with. Visit www.TradeStation.com for further important information explaining what this means. XAUUSD (H4) — Kelly’s Gold Map Elliott 5-wave structure is setting up the next surge, but the clean entry is at liquidity
On the H4 timeframe, price action is aligning well with a bullish 5-wave Elliott impulse. The market has already delivered a strong expansion leg (wave (3)), and the current move is best read as a wave (4) corrective phase.
The key point: wave (4) is often not a reversal. It’s typically the reset leg — a pullback that rebalances, taps liquidity, and clears weak hands before the market attempts wave (5).
What the broader structure is saying
The market remains in an advancing structure; the pullbacks so far look more like “pauses” than a trend break.
EMA200 sits well below around 4,976, keeping the medium-term bias firmly in trend-following mode (favoring buys) rather than trying to fade strength.
This decline is better treated as a “meeting point” where price can return into a liquidity pocket and rebuild demand before pushing higher again.
Liquidity zone in focus (Buying price range)
The area to watch sits around 5,193 → 5,091. It’s wide enough for the market to sweep and absorb orders before choosing direction.
This zone is technically attractive for a wave (4) completion because:
it’s a natural area where buyers often step in defensively
it offers room for a liquidity sweep before a clean reversal signal forms
if the trend is still healthy, price often reacts inside this pocket without needing a deeper breakdown
Primary scenario: complete (4), then launch (5)
If price trades into 5,193 – 5,091 and shows any clear “holding” behavior (one signal is enough), such as:
strong lower-wick rejection inside the zone
a sweep below and a reclaim back above ~5,193
a break of the minor bearish structure (taking out the last lower high) and closing back with strength
→ then the probability increases that wave (4) is finishing and wave (5) is starting.
Targets based on the Elliott structure
If wave (5) develops as expected, the market can rotate toward:
the prior peak area and a re-test of ATH ~5,595
and if trend-following acceleration kicks in, an extended objective can point toward ~6,180
In wave (5) environments, price often moves faster and offers fewer “perfect pullbacks,” which is why this corrective window matters most.
Invalidation (risk discipline)
Elliott only works as long as the structure holds. If:
price closes decisively below 5,091 (especially if it breaks cleanly and fails to reclaim)
→ the wave (4) pullback-to-launch thesis weakens materially. The higher-quality decision at that point is to step aside and wait for a fresh structure to form.
Kelly’s Gold Map takeaway
Gold remains biased to the upside on the medium-term trend, but the real edge is not chasing the run — it’s waiting for price to return into liquidity.
The best plan is patience: allow the market to test 5,193 – 5,091, wait for confirmation, then participate in wave (5) — rather than forcing entries in a sensitive zone.  Long
Long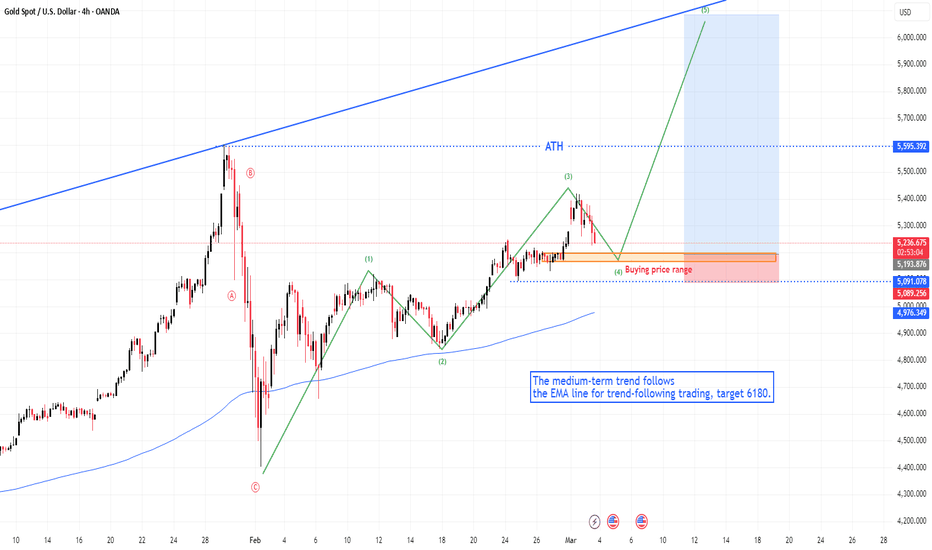
 Short
Short
Verisk Analytics | VRSK | Long at $168.38 Technical Analysis
The stock price for Verisk Analytics NASDAQ:VRSK entered my "crash" simple moving average zone (green lines). The "major crash" zone (gray lines) extends between $137 - $150 and there is a high possibility the price may dip that low in the near-term (especially to close the last price gap since the pandemic near $149). Long-term, given the potential earnings and revenue growth, it looks undervalued at its current price - especially if it enters the "major" crash zone.
Earnings-Per-Share and Revenue Growth Between 2025 & 2028
Projected Earnings-Per-Share Growth : +37.8% (from $6.94 in 2025 to $9.56 in 2028)
Projected Revenue Growth : +22.1% (from $3.1 billion in 2025 to $3.8 billion in 2028)
Health
Debt-to-Equity: 13 (extremely high)
Altman's Z-Score/Bankruptcy Risk: 6.6 (excellent / low risk)
Quick Ratio/Ability to pay current bills: 1.2 (okay, ideally between 1.5 and 3)
Insiders
Mix of selling and buying: openinsider.com
Action
Data from NASDAQ:VRSK is primarily used by the property and casualty insurance industry for underwriting, claims, and compliance. It is also utilized by financial services, energy companies, and government entities (like NOAA and NASA) for predictive modeling, catastrophe risk assessment, and specialized data analytics. It's a company that is readily adopting AI. So, while there is likely near-term weakness and the price may enter the "major crash" zone, NASDAQ:VRSK is in a personal buy zone at $168.38. If the price drops to close the final open gap since the pandemic at $149, I will likely be adding another position.
Targets in 2028
$190.00 (+12.8%)
$210.00 (+24.7%)
 Long
Long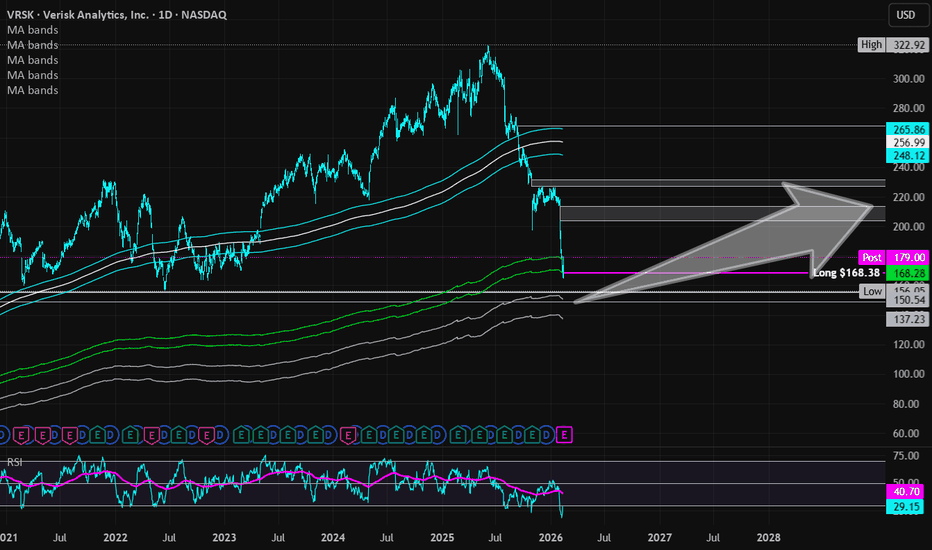
PLTR - Long Bias on Daily ChartOn the PLTR daily stock chart, I am seeing a few things that make me inclined to long it for a swing trade.
1. RSI Divergence - Daily RSI has been rising since the early Feb lows, with price trending sideways to lower over the same time frame.
2. Increased Volume Potentially Indicating Local Bottom - Daily Trading Volume spiked for 3 days in early Feb to the highest daily volume since early Nov. Price volatility spurs emotion, emotion spurs action in traders. Action appears on the chart as volume. Increased volume is a good indicator of local top or bottom, which we just saw, and RSI has now bottomed, signaling a potential spot to long.
3. Market Sentiment - Fears that AI will obsolete sectors of the market have hit in the past few weeks as the overall market has pulled back. Software being one of those sectors, you have seen sensationalist headlines in financial media regarding software stocks. Sentiment is low, typically also signaling a good buying opportunity.
4. Price below long term Moving Average - Price is now ~16% below the 200 day MA. Given the bottoming of RSI and pullback in the market, a relief rally is to be expected at some point as the Supreme Court tariff ruling is digested by the market, and AI fears are abated. Perhaps NVDA's strong earnings is the guiding light needed for a bounce. I feel confident in a rally in PLTR back towards the 200 day moving average at $160 and would expect a run to at least $150.  Long
Long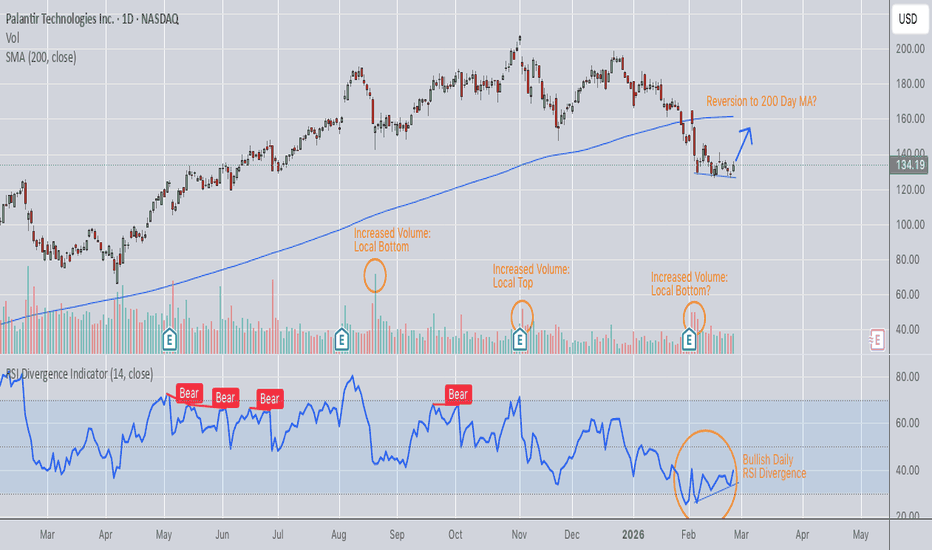
Long 
 Long
Long
Dovish BOJ Nominations Push USD/JPY Higher as Yen Extends WeeklyIt’s been a tough week for the Japanese Yen, with the currency losing strength against the dollar for a second week in a row. On Friday afternoon, USD/JPY was on track to rise 0.63% on the week following a 1.53% gain from the week prior.
Earlier this week, Japan’s Prime Minister, Sanae Takaichi, nominated Ayano Sato and Toichiro Asada to the Bank of Japan’s policy board. These two nominees are both dovish in their policy outlooks. Sato and Asada will replace outgoing board members Asahi Noguchi and Junko Nakagawa. Noguchi’s term ends in late March and Nakagawa’s ends in June. Noguchi was a policy dove—previously voting against rate hikes—so a dovish replacement didn’t surprise the market too much there.
However, Nakagawa was more of a hawk, so the swap here will tilt the board into a more dovish setting. Ayano Sato has advocated for a weak yen in the past, claiming it is good for the economy. The Prime Minister’s picks are reminiscent of Abenomics-era board packing.
Still, their ascension to the board isn’t guaranteed just yet. Takaichi’s coalition holds a majority in the lower house, but it will require some political chess moves to pass the nominations in the upper house where Takaichi’s party is in the minority. For now, however, the nominations seem to be weighing on the yen.
Meanwhile, the macro argument for more hikes remains strong, given above-target inflation and wages that remain relatively elevated. It’s the political moves that are casting uncertainty over future rate hikes. For now, traders are waiting for the March Bank of Japan meeting for additional clarity.
USD/JPY continued to gain ground this week, pushing above its 9-, 21-, and 35-day exponential moving averages (EMAs). Some resistance was found at the 61.8% Fibonacci retracement level from the January high/low range.
The challenge for USD/JPY bulls now is breaking above trendline resistance that is anchored off the January swing high levels. A break higher could allow the technical momentum to continue and set up a test of the February swing high level that coincides with the 76.4% Fib level.
If prices weaken from here, the previously mentioned EMAs or the 38.2% Fib level could offer a level of support. The upcoming labor cash earnings and household spending data for January, due out on March 7, will provide traders the next data point to inform the macro backdrop.