EURAUD: Pullback From Resistance 🇪🇺🇦🇺
EURAUD will likely retrace from a major daily resistance cluster.
I see a tiny head & shoulders pattern formation on an hourly time frame
with a breakout of its horizontal neckline as a confirmation.
Goal - 0.6197
❤️Please, support my work with like, thank you!❤️
I am part of Trade Nation's Influencer program and receive a monthly fee for using their TradingView charts in my analysis.
Multiple Time Frame Analysis
WinkLink | Q3 2026 - Day ChartThe First Comprehensive Oracle
of TRON’s Ecosystem
Build on BNB
----------------------------------
Multiple Time-Frame Analysis; Color Code | Strength favors the higher timeframe.
Yearly timeframe = black
Monthly timeframe = pink
weekly = grey
daily = red
4hr = orange
1hr = yellow
15min = blue
5min = green if they are shown. (Level visibility on intervals is set to timeframe the level was found on and below to keep chart view organized.)
** Candle Science explained **
A Range = two or more c
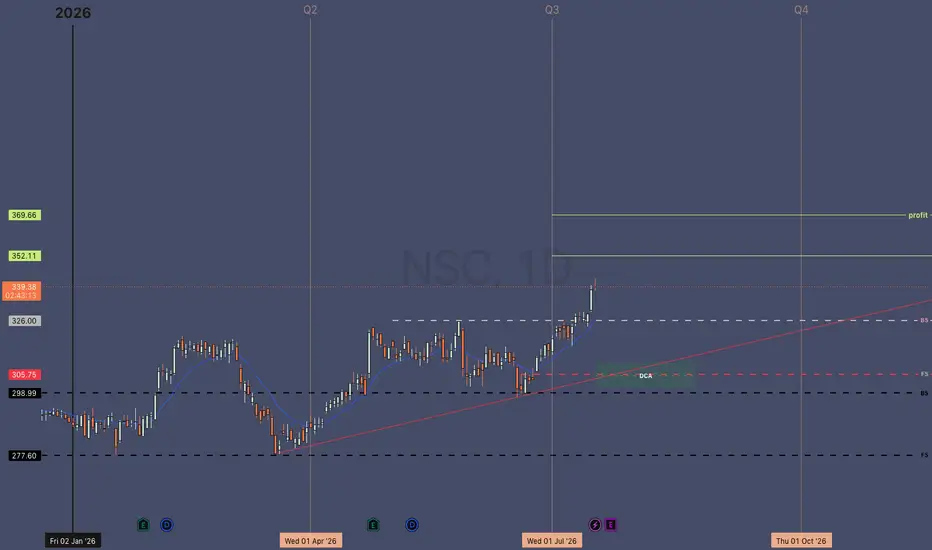
NSC | Q3 2026 - Day ChartNorfolk Southern Corporation ||
MARKET-BEATING SCORE 2/10
Dividend yield TTM
1.60%
----------------------------------
"a transportation company, which engages in the rail transportation of raw materials, intermediate products, and finished goods. The company also transports overseas freight "
----------------------------------
Multiple Time-Frame Analysis; Color Code | Strength favors the higher timeframe.
Yearly timeframe = black
Monthly timeframe = pink
weekly = grey
daily = red
4hr = orang
SPX 500 Index || Q3 2026 - Day ChartS&P 500 Index
----------------------------------
entering a bear market? Looks like it.
-----------------------------------
Multiple Time-Frame Analysis; Color Code | Strength favors the higher timeframe.
Yearly timeframe = black
Monthly timeframe = pink
weekly = grey
daily = red
4hr = orange
1hr = yellow
15min = blue
5min = green if they are shown. (Level visibility on intervals is set to timeframe the level was found on and below to keep chart view organized.)
** Candle Science explained *
GBPCAD SHORTMarket structure bearish on HTFs 3
Entry at both Weekly and Daily AOi
Weekly Rejection at AOi
Previous Weekly Structure Point
Daily Rejection at AOi
Previous Daily Structure Point
Daily EMA retest
Around Psychological Level 1.87500
H4 Candlestick rejection
Rejection from Previous structure
REMEMBER : Trading is a Game Of Probability
: Manage Your Risk
: Be Patient
: Every Moment Is Unique
: Rinse, Wash, Repeat!
: Christ is King
TP: WHO KNOWS!
Entry 120%
NZDCHF SHORTsMarket structure bearish on HTFs DH
Entry at Daily AOi
Weekly rejection at AOi
Daily Rejection at AOi
Daily EMA retest
Previous Structure point Daily
Touching EMA H4
H4 Candlestick rejection
Rejection from Previous structure
TP: WHO KNOWS!
Entry 90%
REMEMBER : Trading is a Game Of Probability
: Manage Your Risk
: Be Patient
: Every Moment Is Unique
: Rinse, Wash, Repeat!
: Christ is King
USDJPY LONGMarket structure bullish on HTFs DH
Entry at both Weekly and Daily AOi
Weekly Rejection at AOi
Daily Rejection at AOi
Around Psychological Level 156.500
H4 Candlestick rejection
Rejection from Previous structure
TP: WHO KNOWS!
Entry 95%
REMEMBER : Trading is a Game Of Probability
: Manage Your Risk
: Be Patient
: Every Moment Is Unique
: Rinse, Wash, Repeat!
: Christ is King
EURUSD | Possible Retracement Into 15M POI | HTF ObjectiveFOREXCOM:EURUSD has recently produced a 15M choch, marking a shift in the current market structure.
Because of this shift, my immediate mindset has changed toward BUY opportunities. I am not interested in chasing the current bullish displacement.
My preferred scenario is for price to potentially retrace into the marked 15M POI, where I can look for bullish confirmation before considering a move toward the higher-timeframe POI above.
However, the 15M retracement is not compulsory. It is simpl
Top-Down Analysis — Same Price, Different ResolutionA daily chart and a five-minute chart are not showing two different markets. They are showing the same market at two different resolutions — and mistaking a change in detail for a change in price is one of the most expensive habits in trading.
The Satellite Photograph
Picture a photograph taken from a satellite. From that altitude, continents and coastlines are visible — the large-scale shape of the terrain. Move the camera closer and individual cities appear. Closer still, streets and build
XAU/USD 24 September 2026 Intraday AnalysisH4 Analysis:
-> Swing: Bullish.
-> Internal: Bearish.
Bias and analysis to remain the same as analysis dated 30 June 2026.
Price did not print bullish CHoCH to indicate bullish pullback phase initiation. Price instead printed a new low followed by a bullish CHoCH
Price is currently trading within and established internal range, however, I will continue to monitor price with respect to depth of pullback.
Intraday expectation:
Price to trade up to either premium of internal 50% EQ, or
NZDUSD: Oversold Market & Pullback 🇳🇿🇺🇸
NZDUSD turned oversold after the last bearish wave.
The price reached an important daily key level and violated a support line of a falling wedge pattern on an hourly time frame.
I expect a pullback to 0.5693
❤️Please, support my work with like, thank you!❤️
I am part of Trade Nation's Influencer program and receive a monthly fee for using their TradingView charts in my analysis.
EURUSD | Higher-Timeframe Pullback Within a Daily Bearish TrendThe previous FOREXCOM:EURUSD analysis played out exactly as anticipated.
Price respected the Higher-Timeframe Flip Zone, produced a clean bearish continuation, and successfully reached the projected downside liquidity objective. This reinforces the importance of allowing institutional zones to dictate execution rather than chasing price.
Following that decline, however, the market began to reveal new information.
Although price swept the recent weak low, it failed to produce a decisive 4H c
Daily Supply Reached | Pullback Objective CompleteFOREXCOM:EURUSD has now reached and reacted from the Daily Supply Zone identified in our previous analysis, completing the higher-timeframe pullback objective we were monitoring.
In the previous analysis, the market was trading with a bearish Daily structure, while the 4H timeframe had shifted bullish. Rather than immediately looking for sells simply because the Daily bias was bearish, the plan was to allow the 4H bullish structure to facilitate a deeper pullback into the Daily Supply Zone.
T
GBPJPY 120M: What Happens When Price Revisits These Zones?Market Context
On the GBPJPY 120-minute timeframe, both a Demand Zone and a Supply Zone are being observed as important areas of market structure.
The Demand Zone originated from a Rally-Base-Rally (RBR) structure, where a quality basing phase was followed by a strong bullish leg-out.
The Supply Zone developed through a Drop-Base-Drop (DBD) structure, where a period of consolidation was followed by a strong bearish leg-out.
Why Are These Zones Technically Significant?
Both zones
Silver | Has the Structure Chosen Its Path?⏱️ Reading Time: ~2 minutes
In our previous analysis, we had two possibilities on the table: Wave IV had completed and a new bullish move was beginning, or the larger correction was still unfolding.
Now, the price structure has moved one step further and given us clearer levels to monitor for both scenarios.
🟦 Scenario 1 — Bullish Path
If the recent decline was a Wave 2, the current move could be the beginning of a new impulse.
In this case, a break and sustained move above the bullish conf
Bitcoin 2H | An Impulse at the Crossroads⏱️ Reading Time: ~3 minutes
Hey everyone,
In this 2H Bitcoin update, I’m focusing on one main question:
Is the recent bullish structure still developing as an impulsive pattern, or has that impulse already been completed and the market entered a higher-degree correction?
🟦 Scenario 1 | Bullish Case
In the bullish scenario, as long as price does not enter the territory of Wave 1, the current structure can still be considered a potential Impulse.
One interesting feature of this count is the
🇺🇸 DXY | Short-Term Strength or the Start of a Larger Move? ⏱️ Reading time: about 3 minutes
In this update, we are taking another look at the DXY structure, this time with greater focus on the behavior we are seeing from the U.S. dollar in the short term.
At the moment, significant short-term strength is visible, and price is approaching several important levels marked on the chart.
But from an Elliott Wave perspective, simply seeing price move higher is not enough for us.
The key question is:
Is this advance the beginning of a new bullish structur
BSX - Holding on for dear life... But for how long?I don't believe in "support" as one line that refuses to give. Especially not on high time frames like the monthly and daily. Instead, I see multiple efforts at a single level holding as an area that's intentionally building liquidity (i.e. tons of buyers & sellers) - to either be:
A) broken and have fuel for a continuation downward
or
B) to be tapped into and reclaimed as fuel for a reversal upward.
I see this $42.60 level as just that.
And depending on how we react when the break does com
Gold: Listening to the Structure Behind the Next Move⏱️ Reading Time: ~2 minutes
Bullish and Bearish Scenarios | Elliott Wave Principle
At the current stage, two primary structures remain under consideration. The key point is that price structure must determine which scenario gains greater validity, rather than direction alone.
🟦 Bullish Case
The market may be completing a corrective structure in the form of a Classic Zigzag, with the recent advance representing part of Wave C.
An important observation is that Wave C has so far retraced only