EURAUD Falling WedgeWatch for this falling wedge. If the support below holds in the next few trading days and decisively breaks above the falling trend line, re-tests and shows bullish conviction, then it can be a good buy setup. Price is not letting go of the support below and getting compressed inside the wedge.
Pitchforks
Falling Wedge Breakout Opens the Door to ATH Retest — Major HTF XRP / USD — 1W
XRP continues to show a constructive higher-timeframe structure following its breakout from a multi-month falling wedge.
The first part of this thesis is relatively straightforward: price has broken above the wedge's descending resistance and is now attempting to hold the breakout area. If that breakout remains valid, the next major technical objective is a retest of the prior all-time-high region near $3.27.
The larger structure is where the chart becomes particularly interest
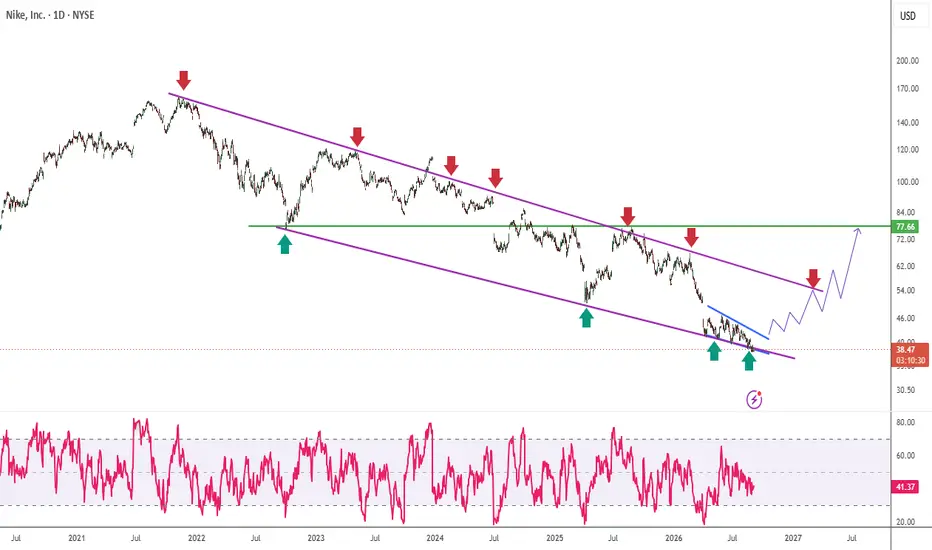
Nike (NKE) Offering Opportunity for the UpsideNYSE:NKE
🚨 Bullish Reversal Setup Building — But LH–LL Structure Still Matters
The chart is showing multiple bullish reversal confluences, but the larger trend has not yet completely shifted.
🟢 Bullish Signals
1️⃣ Daily Falling Wedge
Price is attempting to develop a Falling Wedge pattern on the daily timeframe. If price remains inside the structure and eventually breaks to the upside, it could signal that bulls are beginning to regain control.
2️⃣ Weekly Descending Channel
A broader desce
Elliott wave analysis of ES1! (US500)I still anticipate a final move towards 8000 to tag the median line and complete the impulse from October 2022 low.
Wave 4 of (5) can finish anywhere above 7438.50. Any move below 1 June high of 7632.25 would turn wave (5) into a diagonal.
Count valid above 7438.50, below 8241.25.
S&P 500 Back Below Resistance: Is a Deeper Correction Starting?After Warsh’s remarks pushed the U.S. Dollar Index(DXY) and the U.S. 10-Year Treasury Yield higher, the S&P 500 ( FOREXCOM:SPX500 ) moved back below the key $7,720 trading level.
The index is now trading below the Resistance Zone, while macro and geopolitical risks continue to build.
Can the S&P 500 reclaim $7,722, or is a deeper correction toward the Support Zone beginning?
Macro Outlook
Warsh’s hawkish remarks strengthened the U.S. dollar and pushed Treasury yields higher, creating additi
With Gold's Rise and Fall, Where Could This "Wedge" Take Us?Here we can see OANDA:XAUUSD has been in a decline since the end of January of this year and price action has formed what looks to be a Falling Wedge. August 19th began the Breakout of this pattern but price is currently in downfall again, lets break it down!
It's no surprise that the heavy, opposing influence Gold and the USD have against each other but with the national debt concerns, US Treasury interventions and what seems to be global de-dollarization trends, this has led to OANDA:XAUUS
Gold. will continue surging after breakout? 20/August/26Xauusd's major downtrend line for many months finally broken after US Dept of Treasury said it will increase at least double! the size to buyback = QE! What will happen to Gold and Equity market soon? by next Fed next rate decision on Mid of Sept?
BTC vs. SPX: The Reset Before the Next Cycle?**BTC vs. SPX: The Reset Before the Next Cycle?**
One of the more interesting charts in the market right now isn't BTC/USD.
It's **BTC/SPX**.
When Bitcoin is divided by the S&P 500, a repeating structure becomes much easier to see:
**Expansion → Falling Wedge / Reset → Breakout → Expansion**
And it has happened multiple times during this relative-strength advance.
Look at the sequence on the chart.
Each major push higher in BTC/SPX has been followed by a controlled downward-sloping consol
HDFC Life – Dual Pattern Setup. HDFC LIFE – DUAL PATTERN SETUP
This stock is currently showing two different patterns on the same timeframe — one bearish and one bullish. The direction will be confirmed only after the respective breakout/breakdown.
1. Bearish Pattern – Descending Triangle
Confirmation: Support breakdown
Downside Target: ₹470–₹452
Approx. downside potential: 80+ points
2. Bullish Pattern – Falling Wedge
Confirmation: Breakout above the pattern resistance
Upside Target: ₹660–₹670
Approx. upside potential
Elliott wave analysis for NAS100.I wanted to focus on the corrective structures that have occurred after the October 2022 bottom.
Liberation Day gave us a zigzag, truncated C wave and sharp reversal to the upside.
5 months of price action from October 2025-March 2026 gave us a regular flat, ending diagonal C wave, and sharp reversal upward.
June-July 2026 could be interpreted as another regular flat, but I am suspicious of two flats in a row. With the law of alternation, two flats would need to be interpreted as a 1/2, 1/2 r
AAPL Nears a Rising Wedge Breakdown – 260 Comes Into FocusAAPL has rallied significantly, but as price moved higher, the range began to tighten inside a Rising Wedge. This suggests the uptrend is still present, but buying pressure is no longer as strong as it was before. Price is now back near the lower boundary of the pattern, making this an important decision area.
What I want to see here is not just a small pullback, but a real breakdown. If AAPL closes clearly below wedge support and then retests the broken area without reclaiming it, that would s
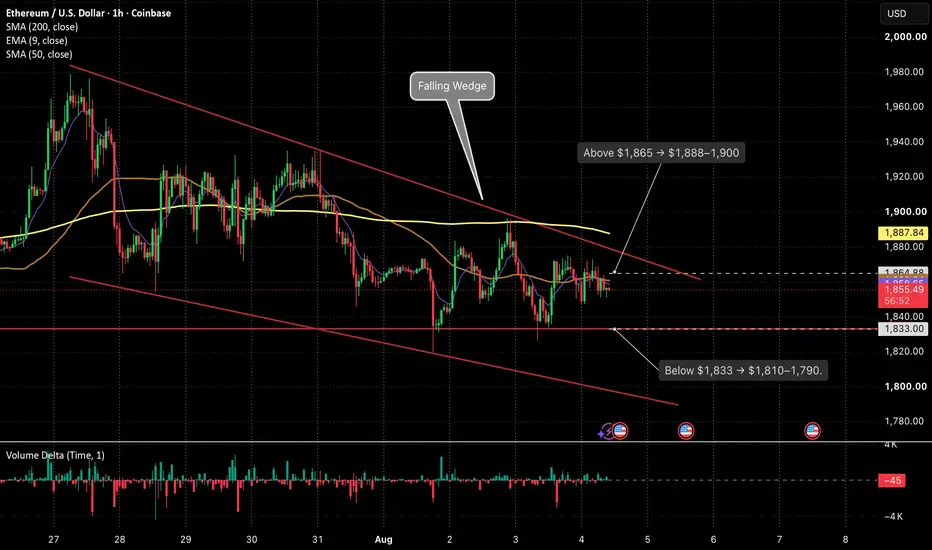
Can Ethereum escape the $1,800–1,900 range today?Can Ethereum escape the $1,800–1,900 range today?
▫️ ETH trades near $1,854, below the EMA 9 at $1,859 and SMA 200 at $1,888. Volume and momentum remain weak.
▫️ Lower oil prices have temporarily eased inflation concerns, but U.S.–Iran negotiations remain unconfirmed. Traders are waiting for action rather than diplomatic promises.
▫️ Prediction-market traders see a 98% probability of ETH remaining above $1,800 by noon ET, but only a 3% probability of it exceeding $1,900. Expectations remain
WTI: How to read a Falling WedgeWTI: How to read a Falling Wedge
A falling wedge is a pattern where price moves lower, but the range becomes tighter over time.
It usually shows that sellers are still in control, but their pressure may be weakening. Each new low is lower than the previous one, yet price starts compressing instead of accelerating lower.
On this WTI 4H chart, oil is still trading inside a falling wedge after a sharp decline from the previous highs. Price is now testing the lower side of the pattern, which mak
CHF/JPY Comprehensive Analysis: Major Structure Shift 📉 CHF/JPY Comprehensive Breakdown: Structural Shift & Long-Term Roadmap
Executive Market Context
The CHF/JPY (Daily) chart reflects a decisive technical shift following the breakdown from its long-term ascending channel. The violent daily displacement confirms a transition from a multi-month bullish run into a deeper corrective cycle.
___________________________
Technical Confluence & Catalysts
Market Structure Shift (MSS): The daily candle closed decisively below macro channel support, invali
SPCX should go higherI recently visited The Kennedy Space Center Visitor Complex and had a chat with an astronaut about the Perseverance and Curiosity rovers. At some point, he mentioned he'd recently talked to Elon about SpaceX and was told Elon wanted to land his rockets in the ocean to help generate coral reefs. Interesting! I also realized how frequently SpaceX was on display throughout the complex. I couldn't stop thinking any investment in SPCX will have a decent ROI in the future.
That said, the stock took a
Elliott wave analysis for NAS100.28187.2 held as support on 17 July, consistent with a diagonal (red ellipse). However, price action from that bounce does not appear impulsive, but rather a double three (W is zigzag, Y is regular flat).
Given this development, I see two possible scenarios:
1) 28187.2 holds as support and price goes for a (c) wave towards 30000, or
2) 28187.2 breaks on volume and confirms that the red ellipse is
a leading rather than an ending diagonal, suggesting price to go lower quickly, with targets includi
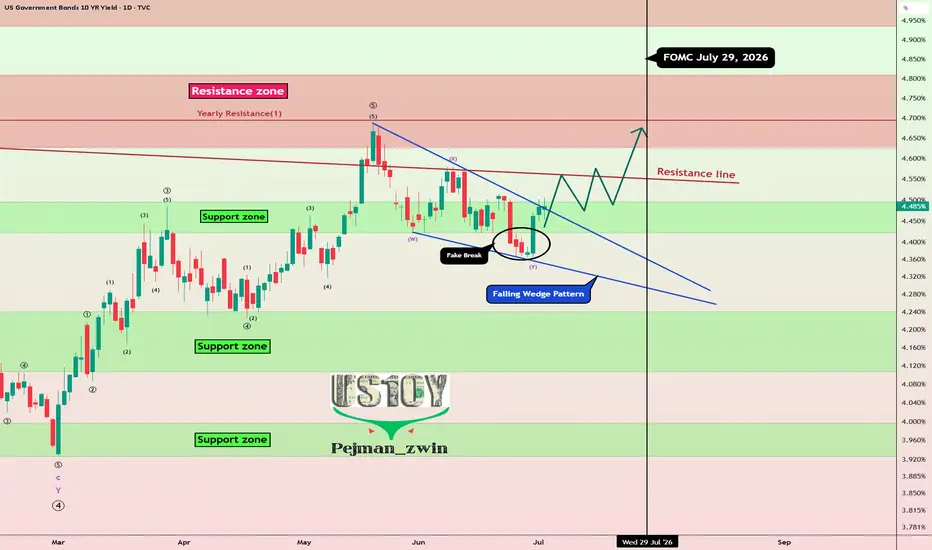
US10Y Fake Break:Is a New Bond Yield Rally About to Shake MarketToday, I want to analyze the U.S. 10-Year Government Bond Yield ( TVC:US10 ), as it is one of the key financial market indices that can show us the broader market direction for various assets like Gold ( OANDA:XAUUSD ), Silver ( OANDA:XAGUSD ), U.S. stock indices (including the S&P 500 ( FOREXCOM:SPX500 )), and especially Bitcoin ( BINANCE:BTCUSDT ) in the crypto market. Stay with me.
On the daily timeframe, the U.S. 10-Year Government Bond Yield is currently moving near a support zone (4.