Long
Long
H2 Rebound Into POC Before Lower Liquidity
Fundamental Analysis
Gold is caught between two opposing forces. August U.S. CPI rose 0.4% MoM and 3.4% YoY, lifting expectations for a Fed rate hike next week to around 85%–87%. At the same time, renewed Middle East tensions continue to support safe-haven demand, keeping volatility elevated.
Technical Analysis
On H2, Gold remains inside a broader bearish structure after the recent CHoCH and BOS.
Price is now near 4,349, above the lower liquidity area. A corrective rebound could first develop toward the 4,420–4,450 POC zone, where previous structure and Volume Profile resistance overlap.
If sellers defend this area, the next bearish wave could target the 4,280–4,310 SSL.
Important Key Levels
4,601 — Major POI
4,510 — OB / Resistance
4,420–4,450 — POC / Sell Zone
4,280–4,310 — SSL / Main Liquidity
Trading Scenario
Sell priority remains on a rebound into 4,420–4,450 followed by bearish H2 confirmation.
Target: 4,280–4,310 SSL.
Invalidation: H2 acceptance above the POC zone and continued bullish structure.
Overall View
The H2 bias remains bearish, but price is already near lower levels. The cleaner setup is to wait for a corrective rebound into the POC before looking for the next move toward SSL.
Will Gold retest 4,440 before sweeping the liquidity below 4,300?  Short
Short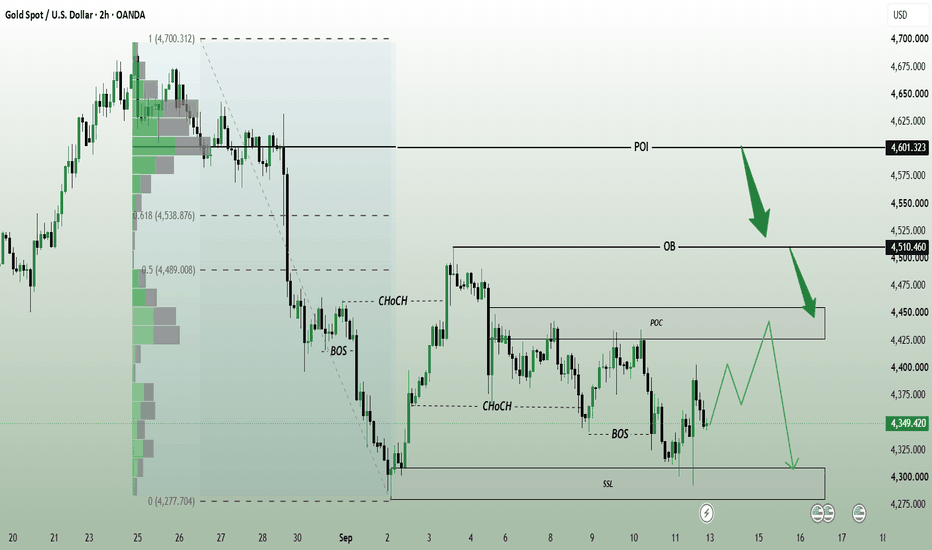
 Long
Long
DXY | When Structure Reveals the Dollar’s Next Path⏱️ Estimated Reading Time: About 2 Minutes
In this update, our focus is on the current DXY structure on the daily chart, where the market is still revealing the pattern following the recent decline.
From the higher-degree perspective, we continue to monitor two scenarios.
🟢 Bullish Scenario
If the current structure completes as a corrective pattern and the market then develops a valid motive structure, the probability of further DXY strength will increase.
A break of the marked levels could provide additional confirmation for the bullish scenario and potentially open the path toward higher levels.
⚫ Bearish Scenario
On the other hand, if the current movement fails to maintain a corrective character and the market develops another valid bearish structure, the probability of a deeper correction will increase.
In that case, DXY could continue developing a more complex corrective structure, such as a Double Zigzag or another higher-degree combination.
🔎 What Matters Right Now?
We do not want to label the structure before the market reveals it.
For now, the key is price action around the marked levels and the internal structure of the next move.
If the next upside move develops as a motive structure, the bullish scenario gains strength. If price turns lower again and builds a valid bearish structure, the deeper corrective scenario remains on the table.
So for now, we have one main question:
What pattern is DXY actually building?
The market will provide the answer through structure.
Structure First. Scenario Second.
Patterns whisper. I listen.
— Mr. Nobody 🎧📊
Chart Note: The chart is set to “Lock Price to Bar.” For a closer look at the current structure, simply zoom in on the most recent price action and the marked levels.
Dollar Index
Jun 7
DXY Structural Analysis: Navigating the Diagonal
U.S. Dollar Currency Index
Jun 5
The DXY Time Paradox: Monday Engineering & Elliott Wave Dissecti
The Elephant Jungle 9/15/26 Page 4SO RED, WHAT’S THE PLAY?
As of right now, I am watching for confirmations to take a long from this 15m Order Block. If the confirmations are not there, I am not forcing anything. I will simply wait and see if the Bears can sweep the Range Low and give me another opportunity.
As for shorts, I am watching the 15m Order Block above, but if I do not get the confirmations I want from there, I am looking at the 1H Order Block higher up.
Either way, I am not chasing price.
Today looks like it could get interesting, but it also looks like the type of day where a lot of traders could get chopped up trying to predict every little move.
That is why today, confirmation is a MAJOR KEY.
DJ Khaled voice.
The market does not owe me a trade just because I opened TradingView. If price reaches my level and gives me my confirmation, I will take my shot. If it does not, I will sit back and let the Bulls and Bears beat the hell out of each other without me.
Sometimes the best trade is the one you had the discipline not to take.
That is my battle plan for today, but I want to hear yours. What are you seeing in the market? Are you riding with the Bulls, running with the Bears, or sitting on the sidelines waiting for one of them to show their hand?
Drop your thoughts in the comments.
And like always, trade safe, use good risk management, wait for your levels, and most importantly, wait for your confirmations.
The Jungle will always give you another opportunity.
Your job is to make sure you are still around when it does.
Until next time... Long 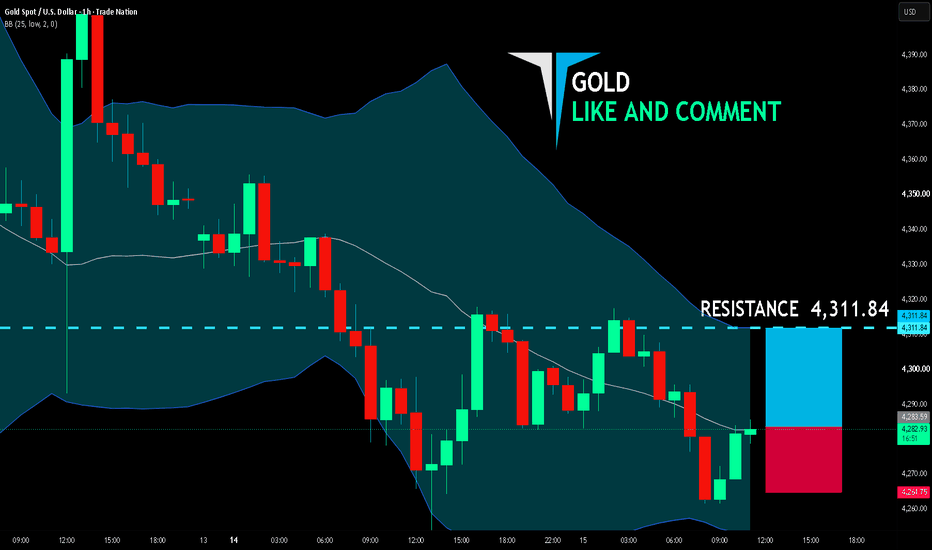
XAUUSD — Bearish Wave Toward 4,160
Gold is still moving inside a clear bearish channel after failing to break above the descending trendline. From Kelly’s view, the current chart suggests that XAUUSD remains under downside pressure, and the latest recovery may only be a short correction before another bearish Elliott Wave leg continues.
The key idea is simple: gold is trading below the FVG sell zone, and if buyers cannot reclaim this resistance, sellers may continue pushing price toward the lower support and final target area.
⟡ Market structure
Gold is currently trading around 4,283, still inside the descending channel. The short-term recovery is being capped below the 4,288–4,300 FVG sell zone, which is now the key resistance area.
The market is still forming lower highs, and price action remains weak below the trendline. If gold rejects from the sell zone again, the first downside area to watch is the strong support near 4,255–4,265.
A clean break below this support may open the next bearish move toward 4,225–4,235. If sellers keep control, the final Elliott Wave target remains around 4,155–4,165.
➤ Key levels
◌ Current price area: 4,283
◌ FVG sell zone: 4,288–4,300
◌ Short-term resistance: 4,300–4,320
◌ Strong support: 4,255–4,265
◌ Buy reaction zone: 4,225–4,235
◌ Main bearish target: 4,155–4,165
◌ Bearish invalidation: above 4,320
⌁ Elliott Wave view
The chart shows a possible bearish Elliott Wave continuation.
Wave (1) started after gold rejected from the upper channel area.
Wave (2) created a short corrective rebound into the FVG sell zone.
If price fails below 4,300, wave (3) may continue lower toward 4,225–4,235.
Wave (4) may create a small recovery from the lower reaction zone.
Wave (5) may complete the bearish structure near 4,155–4,165.
This is why Kelly is not chasing buys at the current price. The cleaner plan is to wait for price to reject the FVG sell zone or break below strong support with clear bearish momentum.
▸ Trading scenario
Preferred bearish scenario
Entry: Sell around 4,288–4,300 if price gives bearish rejection
Stop Loss: Above 4,320
Take Profit 1: 4,255–4,265
Take Profit 2: 4,225–4,235
Take Profit 3: 4,155–4,165
Alternative entry
If gold breaks below 4,255 and retests this level weakly, sellers may look for continuation toward 4,225–4,235 and then 4,155–4,165.
◌ Invalidation
The bearish view becomes weaker if gold breaks above 4,320 and holds above the descending trendline. In that case, the current bearish wave structure may be delayed, and price could attempt a stronger recovery first.
⌁ Kelly’s view
Kelly’s main view remains bearish while gold stays below the 4,288–4,300 FVG sell zone. The structure still favors selling rallies rather than chasing short-term rebounds.
If sellers defend the sell zone, gold may continue toward 4,255–4,265, then 4,225–4,235. The larger bearish target remains near 4,155–4,165 if wave (5) extends.
Do you think gold will reject from the FVG sell zone first, or break strong support directly? Short 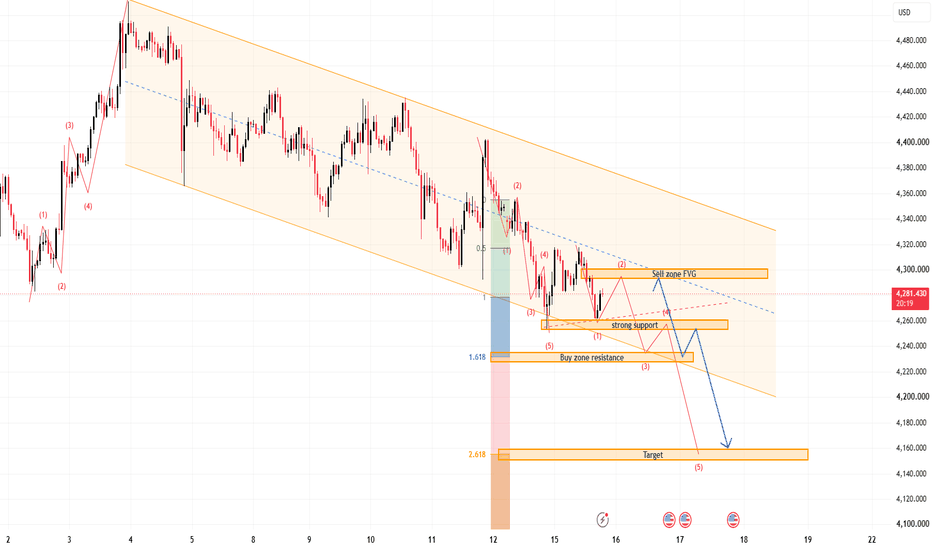
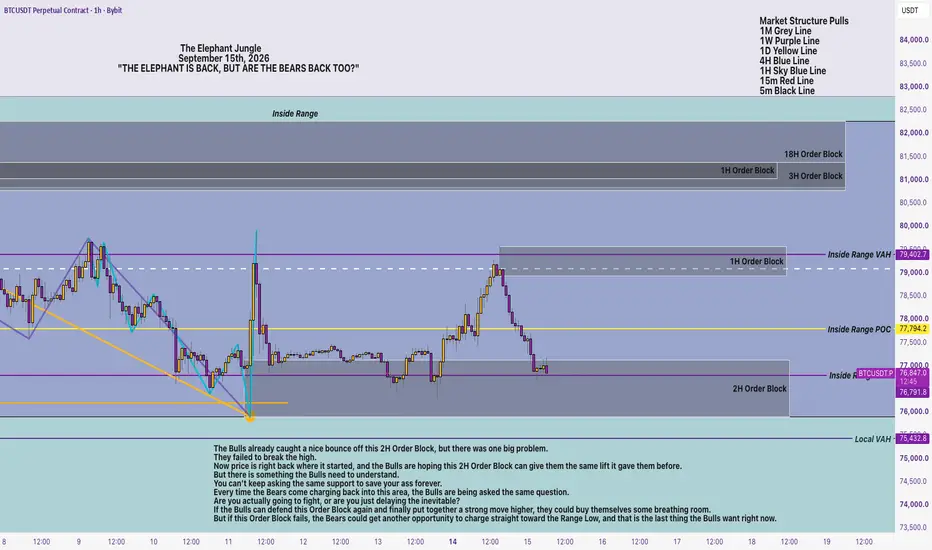
The Elephant Jungle 9/15/26 Page 2As of right now, the Bulls are relying heavily on the Inside Range VAL for support, and this level might be more important than it looks.
The Bulls are basically standing on the edge of the ring right now. If they lose this support, they are going to give the Bears another opportunity to attack the Range Low.
And that is where things could get ugly.
If the Bears swipe the Range Low, the Bulls could still have one more line of defense around the Local VAH. That area could give the Bulls another opportunity to step in, defend themselves, and possibly turn the breakdown into another trap.
But if the Bulls lose that too?
Oh boy.
Now the Bears might have an open lane to start dragging price back toward 67K.
And the Bulls better hope these Bears do not build too much speed and momentum on the way down, because if they do, we might have to call Doc Brown and fire up the DeLorean.
These Bears might hit 88 miles per hour and send Bitcoin traveling all the way back in time to 55 like Marty McFly.
But before we start screaming “Great Scott!” and preparing for 55K, remember what we talked about on the Daily.
The Bears still have work to do.
They need to break support, take out the Range Low, and prove they can actually hold price below these levels. Until that happens, the Bulls are still alive, and another Bear trap could be waiting right around the corner.
The Bears might have the DeLorean fueled up, but somebody still has to hit 88 miles per hour. BTC Failed Under 78,028 And Is Working Toward 76,237.BTC Failed Under 78,028 And Is Working Toward 76,237.
Bitcoin never reclaimed 78,028 after the weekend sweep of 79,852 and has spent two sessions drifting lower, down 1.50% to 77,004 with 76,237 the next level beneath it and 76,030 - Friday's sweep low - under that. The line that capped it all last week is now firmly overhead, and the failure to reclaim it is what turned the weekend high into a sweep rather than a break. The two timeframes disagree sharply: the hourly carries a long-reversal state on elevated volume while the 4H sits at a short read with conviction near the bottom of its scale. Neutral.
Resistance: 78,028 - the line overhead
Key resistance: 79,318 - the level rejected four times
Current price: 77,004
Support: 76,237 - the next level down
Key support: 76,030 - the sweep low
Structural floor: 74,182 - deeper floor
Two paths from here:
It works down to 76,237 and retests 76,030. Continuing under 78,028 puts the recent low in play, and a close beneath 76,030 would finally break the range that has held since last week, opening the space toward 74,182 with nothing named in between.
It reclaims 78,028 and the drift ends. Getting back above the line would make these two sessions a pullback inside the range rather than the start of the next leg, though 79,318 still caps everything above it.
Both ends of this range have been swept in the last four sessions and price is grinding back toward the low end. 78,028 above, 76,030 below - and the low is the one being approached.
Built with SYNTHESIS v3.3 | SOM / ACE / IMP / SYNTHESIS
Study, not financial advice. SPY Swept 756.22 And Closed Back On 759.13.SPY Swept 756.22 And Closed Back On 759.13.
SPY traded down to 756.22 on Monday, through Thursday's low, and closed at 759.59 - back on the 759.13 range low it has been arguing with for four sessions. That is a sweep of the lows followed by a recovery into the level, not a breakdown, and price is unchanged this morning at 759.61. The 4H reads impulse continuation lower with volatility in the 95th percentile of its range, the hourly is flagging a swept low alongside a trend-resumption state, and a fresh high-conviction downside print landed on the hourly with congestion warnings attached to it. Conviction and structure point the same way while price refuses to leave the level. Neutral.
Resistance: 762.57 - the shelf lost Monday
Key resistance: 765.52 - the level capping the range
Current price: 759.61
Support: 759.13 - the range low being defended
Key support: 756.22 - Monday's low
Structural floor: 753.22 - deeper support
Two paths from here:
It closes below 759.13 and the sweep becomes a break. Monday's low at 756.22 is the first target under it and 753.22 the next real level, and a close beneath the range low after four sessions of defending it would be the cleanest structural signal this chart has given in two weeks.
It holds 759.13 and works back at 762.57. Defending the low again puts the lost shelf back in play, and only a reclaim of 765.52 would repair anything above that. Four defenses of a level is a shelf; five starts to look like a base.
The low was swept and bought back the same session, which is the opposite of what the conviction surface is describing - and that disagreement is the whole read. 759.13 settles it either way.
Built with SYNTHESIS v3.3 | SOM / ACE / IMP / SYNTHESIS
Study, not financial advice. NVDA Lost 211.00 To 208.93 And Closed Back Above It.NVDA Lost 211.00 To 208.93 And Closed Back Above It.
NVDA followed Monday's gap with another 3.36% down day, breaking the 211.00 shelf to 208.93 before recovering to close near 212.35 - back above the level it lost and short of the 207.59 structural target underneath. Price sits at 212.53 this morning, still beneath 213.43 and 214.58, the two levels it gapped through to start the week. Hourly volume is in the 4th percentile of its range with an NR7 compression flag active, while the 4H carries a long-leaning surface on elevated volume - a split, on a chart that has broken four named levels in two sessions. Neutral.
Resistance: 213.43 - first overhead, lost Monday
Key resistance: 214.58 - the gap level that failed
Current price: 212.53
Support: 211.00 - the shelf that held on a closing basis
Key support: 208.93 - Monday's low
Structural floor: 207.59 - the next structural level
Two paths from here:
It loses 208.93 and 207.59 finally gets tested. Taking out Monday's low would complete the move the gap started and put the structural level directly in play, with 204.82 and 202.11 beneath it. Four broken levels in two sessions is momentum, and momentum does not usually stop at a shelf it already lost once.
It holds 211.00 and repairs toward 214.58. Two consecutive sessions of closing back above a broken level is how a base starts, and reclaiming 213.43 then 214.58 would put 217.73 back on the board. Nothing is repaired until 214.58 is back.
Compression at bottom-decile volume right after a violent break usually resolves quickly. 208.93 below and 213.43 above are the two levels that end the argument.
Built with SYNTHESIS v3.3 | SOM / ACE / IMP / SYNTHESIS
Study, not financial advice. The Elephant Jungle 9/15/26 Page 1About 29 days ago, the Bulls made a dramatic pump in the market that sent price flying up to around 82.2K. It was a strong move, but the Bulls just could not push far enough to swipe that 1M High.
And that is where things started getting interesting.
Since the Bulls could not take out the high, the Bears stepped in and took control, driving price down and taking out the low. But the Bulls were not ready to wave the white flag just yet. They only allowed the Bears to create a Swing Failure Pattern, then came charging right back for another attempt at taking out the high.
For a moment, it looked like the Bulls might actually pull it off.
Nope.
The Bulls could only push so far before the Bears said, “Give me that ball back.” The Bears took control again that same day and sent price right back down.
Since then, the market has spent the last few days trying to figure out who actually wants control. Price has been moving sideways, the Bulls have been fighting, the Bears have been fighting, and neither side has been able to land the knockout punch.
But today, things are starting to get interesting again.
It looks like the Bears might finally be ready to make another statement and attack that low one more time. If the Bears can take it out and get a solid body close below it, we might be able to kiss the Bulls goodbye for a while as price starts working its way back down toward 67.2K, or possibly even lower.
But hold up.
That is only one view of the market.
The Bulls still have a chance to defend this area and take control from here. Even if the Bears do take out the low, the Bulls could pull the same trick again and turn the breakdown into another SFP, trapping Bears who thought the breakdown was finally here.
So right now, this is not the place to marry a direction.
This is the place to watch the fight.
The Bears are standing at the Bulls’ front door, but they have not kicked it down yet. Until we get confirmation, both sides still have a path to victory.
And this Daily chart is only showing us the battlefield from the sky.
Now let’s drop down to the 4H Time Frame, because that is where we can get a much better look at what these Bulls and Bears are really up to. Risk-On or Risk-Off? A Trader’s Intermarket DashboardMarkets rarely move in isolation. A strong equity rally can look bullish on the surface, yet bonds, the dollar, commodities, volatility, or credit markets may already be warning that the underlying environment is changing.
This is where intermarket analysis becomes valuable.
Instead of asking only, “ Is the S&P 500 going up? ”, traders can ask a more important question:
“Are other markets confirming the move?”
A simple intermarket dashboard can help answer that question and provide a repeatable way to identify whether the broader environment is risk-on, risk-off, or transitioning between the two.
The Seven-Market Dashboard
A practical dashboard can be built around seven major components:
• Equities
• Government bonds and yields
• U.S. Dollar
• Gold
• Commodities
• Volatility
• Credit
Each market provides a different piece of information. The objective isn't to predict every move, but to determine whether the markets are broadly aligned.
1. Equities: The Risk Appetite Signal
Equities are usually the first market traders watch.
A rising stock market generally suggests improving risk appetite, but price alone isn't enough.
A healthier risk-on environment often includes:
Stocks ↑ + credit improving + volatility ↓
If equities are rising while volatility remains elevated and credit markets deteriorate, the rally deserves more caution.
The key is confirmation.
A stock index making new highs is more convincing when other risk-sensitive markets are behaving constructively at the same time
2. Bonds: Watch the Yield, Not Just the Price
Government bonds provide information about growth expectations, inflation, and monetary policy.
For equity traders, Treasury yields can be particularly important.
Falling yields may support growth stocks when they reflect easing financial conditions. But falling yields caused by aggressive growth concerns can tell a completely different story.
Likewise, rising yields can indicate stronger economic expectations or tighter financial conditions.
Therefore, the question isn't simply:
“Are yields rising or falling?”
It is:
“Why are yields moving?”
That distinction can prevent traders from interpreting the same price movement in the wrong context.
3. The Dollar: The Global Financial Conditions Gauge
The U.S. Dollar Index is one of the most useful components of an intermarket dashboard.
A stronger dollar can tighten financial conditions, particularly for economies and assets exposed to dollar-denominated funding.
A weaker dollar can, in certain environments, support commodities and risk assets.
But again, context matters.
A rising dollar alongside falling equities, weaker commodities, and widening credit spreads can represent a classic defensive environment.
A falling dollar alongside stronger equities and commodities is generally more consistent with risk appetite.
The dollar therefore acts as an important cross-market confirmation tool.
4. Gold: More Than a Safe Haven Asset
Gold is often described simply as a safe haven, but its intermarket relationships are more nuanced.
Gold responds to factors including:
• Real yields
• Dollar strength
• Inflation expectations
• Monetary policy
• Investor demand for defensive assets
One particularly useful relationship is between gold and real yields.
If gold rises while real yields fall, the move has a different macro interpretation than gold rising alongside sharply higher real yields.
Gold can therefore help traders distinguish between inflationary pressure, monetary expectations, and genuine defensive positioning.
5. Commodities: The Economic Pulse
Commodities provide another important piece of the puzzle.
Industrial commodities can offer clues about economic demand, while energy prices can influence inflation expectations and consumer purchasing power.
When equities, industrial commodities, and cyclical assets rise together, the market may be pricing stronger economic activity.
But if equities continue higher while economically sensitive commodities weaken significantly, the divergence deserves attention.
It doesn't automatically mean a market top is coming.
It means the trend deserves closer examination.
6. Volatility: The Market’s Stress Gauge
Volatility is one of the fastest ways to identify changes in risk appetite.
A falling volatility index alongside rising equities generally supports a risk-on interpretation.
The opposite combination, falling equities and sharply rising volatility, is a much clearer risk-off signal.
But perhaps the most interesting situation occurs when the two diverge.
If equities continue climbing while volatility stops falling or begins rising, traders should become more selective.
Volatility isn't necessarily a timing indicator by itself. Instead, it can act as an early warning system that market confidence is becoming less stable.
7. Credit: The Confirmation Layer
Credit markets can sometimes provide information that equities haven't fully priced in yet.
When credit spreads remain contained while equities rise, the broader risk environment is generally healthier.
When credit spreads begin widening substantially, however, the message becomes more defensive.
This is why credit can be considered the confirmation layer of the dashboard.
Stocks can remain optimistic for longer than fundamentals justify. Credit markets can sometimes reveal that investors are becoming more cautious underneath the surface.
Turning Seven Markets Into One Signal
The dashboard becomes more useful when traders stop analyzing each market independently.
A simple scoring model can make the process repeatable.
The exact signals shouldn't be treated as rigid rules. Their meaning depends on the macro regime.
The objective is to count confluence.
If five or six components are sending a similar message, the probability of a meaningful regime is stronger than when only one market is moving.
The Three Regimes
This creates three broad environments.
Risk-On
Typical characteristics include:
Equities ↑
Credit improving
Volatility ↓
Commodities ↑
USD stable to weaker
This environment generally favors cyclical and higher-beta assets, although individual setups still require technical confirmation.
Risk-Off
A defensive regime may look like:
Equities ↓
Credit deteriorating
Volatility ↑
USD ↑
Commodities ↓
This doesn't necessarily mean every asset will fall. Some defensive assets can outperform as capital rotates toward perceived safety.
Transition:
The most interesting regime is often neither risk-on nor risk-off.
It is the transition.
For example, equities may still be trending upward while credit begins weakening, volatility rises, and the dollar starts strengthening.
No single signal proves that the trend is ending.
But the number of conflicting signals is increasing.
That's precisely when traders should move from aggressive positioning to selective positioning.
The Most Powerful Signal Is Divergence
Intermarket analysis becomes particularly valuable when markets disagree.
Imagine the following scenario:
The S&P 500 reaches a new high, but credit spreads begin widening, volatility rises, commodities weaken, and the dollar strengthens.
The correct conclusion isn't automatically:
“Sell everything.”
Instead:
“The equity trend is losing intermarket confirmation.”
That distinction is important.
Intermarket analysis is not designed to predict the exact day of a reversal. It is designed to identify when the probability of the existing regime continuing may be changing.
A Repeatable Weekly Process
Traders don't need to monitor seven markets all day.
A simple weekly process can be enough.
Step 1 : Determine the primary equity trend.
Step 2 : Check Treasury yields and identify the macro driver behind the move.
Step 3 : Evaluate the dollar's direction.
Step 4 : Compare gold and commodities with the broader risk environment.
Step 5 : Check volatility for confirmation or stress.
Step 6 : Examine credit for hidden deterioration.
Step 7 : Classify the environment as risk-on, risk-off, or transition.
Step 8 : Only then evaluate individual trade setups.
This approach changes the question from:
“Should I buy this chart?”
to:
“Does this trade make sense within the current market regime?”
That is a much stronger question.
My Thought:
The biggest advantage of intermarket analysis isn't that it produces perfect forecasts.
It doesn't.
Its value is that it provides context.
A trader looking at a single chart sees price.
A trader looking across equities, bonds, currencies, commodities, volatility, and credit sees the relationships behind that price.
Markets constantly communicate with one another.
The goal isn't to listen to every signal.
It is to recognize when several markets start telling the same story and when they suddenly stop.
Price gives you the setup. Intermarket analysis tells you whether the environment is supporting it.
By @BrightRally_Research on @TradingView  Education
XAUUSD: Liquidity Rejection & Support Retest🔹 XAUUSD is showing a corrective bearish structure after facing rejection from the upper resistance area near 4,440–4,450. Price has moved below the rising trendline and is currently trading around 4,304, suggesting sellers have gained short-term control. The highlighted resistance and liquidity area around 4,440 remains a key zone, while the support region near 4,225 could become important if downside pressure continues. Recent price action reflects lower highs and lower lows, with the market remaining below the previous breakout structure.
🔸 A bullish scenario could develop if XAUUSD reclaims the 4,440 resistance and confirms acceptance above the liquidity area, potentially shifting the short-term market structure. Traders may wait for clear price confirmation before considering any trade. If the resistance zone continues to hold, bearish pressure could remain active and price could revisit the highlighted support area near 4,225. A decisive break below support could suggest further weakness and continuation of the correction.
Education:
This analysis is for educational purposes only and does not constitute financial or investment advice. Always conduct your own research before making trading decisions. Long 
 Long
Long
Gold Rebounds From Trend Line — 4,440 Resistance in FocusHello traders! Here’s my technical outlook based on the current XAUUSD (2H) chart structure. XAUUSD previously traded inside a range before breaking higher with a strong impulse and shifting bullish. Price then formed another range and moved toward the 4,680 Resistance Line, where sellers rejected the upside. Currently, XAUUSD is trading below the 4,440 Seller Zone while holding above the 4,310 Buyer Zone and ascending Trend Line. The recent bounce from support suggests buyers are attempting to regain control. As long as XAUUSD remains above the 4,310 Buyer Zone and respects the ascending Trend Line, the bullish scenario remains valid. A continuation higher could push price toward the 4,440 Seller Zone (TP1). However, a breakdown and close below the Buyer Zone would weaken the bullish outlook and increase the possibility of further downside. Please share this idea with your friends and click "Boost" 🚀 Long 
 Short
Short
Short 
XAU/USD 4H — GOLD AT A CRITICAL DECISION ZONE📊 Market Structure
Gold is showing short-term bearish pressure after rejection from the 4,365–4,449 supply/OB area.
Price has broken below the marked 4H CHoCH / 4,324.68 area and is now testing the 4,282–4,301 decision zone.
The chart marks 4,282.62 as the current 4H swing-low/S1 area.
The 9 EMA is around 4,329.19, keeping immediate momentum tilted bearish while price remains below it.
MACD is also below the zero line, with the histogram negative, supporting the current downside momentum.
🟢 Bullish Scenario — Buyers' Last Defense
The key area is 4,269–4,301, where the chart marks a bullish FVG / decision zone.
If buyers defend this area and price reclaims 4,324.68, the first important confirmation would be a move back above the EMA area around 4,329.
Potential upside path:
4,324.68 → 4,365.57 → 4,400+ → 4,449
A strong reclaim of 4,365.57 would significantly improve the bullish structure.
🔴 Bearish Scenario — Breakdown Risk
If 4,269–4,301 fails to hold and price continues below 4,282.62, the bearish scenario becomes stronger.
The next major downside area marked on the chart is:
🎯 4,245.19 — 1D Fib 0.618 / golden pocket
A deeper continuation could bring 4,213–4,237, the marked bullish FVG zone.
🎯 Trade Idea
Aggressive bullish reaction:
🟢 Watch 4,269–4,301 for a confirmed rejection/reclaim.
🎯 TP1: 4,324.68
🎯 TP2: 4,365.57
🎯 Higher target: 4,449
Bearish continuation:
🔴 Confirmation below 4,269–4,282
🎯 Target: 4,245.19
🎯 Extended: 4,213–4,237
⚠️ Do not chase shorts directly into the bullish FVG. Wait for either a confirmed bounce/reclaim or a clean breakdown and retest. Short