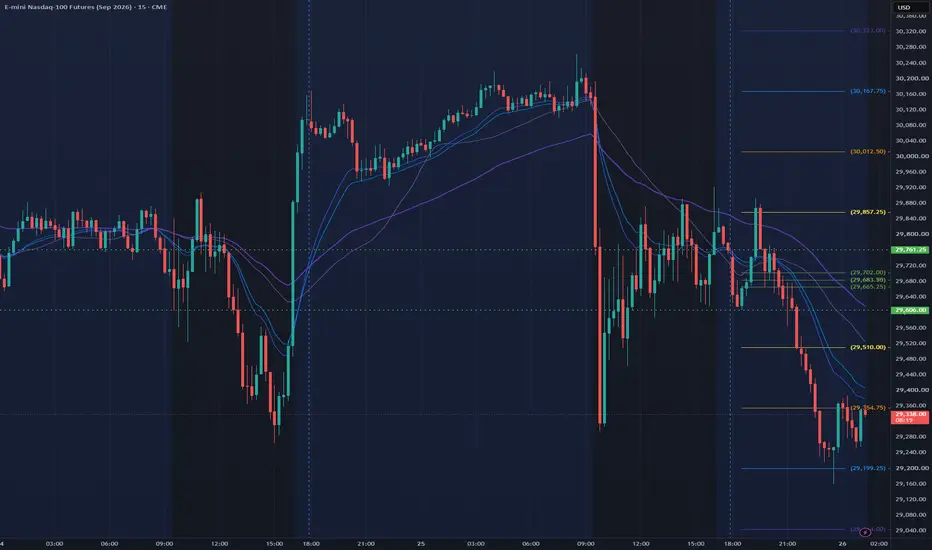
SPY tags the expected move high, then stalls —750.98 is the lineComing out of the long weekend, options had priced a wide day — an expected move band of 738.58 – 750.98. The gap-up ran straight into the EM high, rejected, and price is now sitting just underneath it.
Below 750.98, the band edge is doing its job — that was the boundary of what the market paid for going into today, and the first tag drew sellers. A reclaim and hold above puts the tape in "moving more than priced" territory, with PDH 751.31 right overhead as the next test. Below, Thursday's close at 744.78 is the middle of the range, with the EM low at 738.58 as the far edge.
FOMC Wednesday 2:00 PM ET — expect positioning to tighten into it and a wider band that day.
The expected move is a probability range, not a wall — price closes beyond it about one day in three. Levels are context. Trade your own plan.
Plotted with my SPY/SPX Expected Move script.
-Janice The Cardwell RSI Range-Shift Strategy● The Cardwell RSI Range-Shift Strategy: A Regime-Based Reinterpretation of the Relative Strength Index Using the 40/80 and 20/60 Range Rules
● Abstract
The Relative Strength Index (RSI), introduced by J. Welles Wilder in 1978, is among the most widely used momentum oscillators in technical analysis. Its conventional application relies on fixed overbought and oversold thresholds of 70 and 30. Andrew Cardwell, a technical analyst who studied momentum behavior extensively over several decades and who is frequently described in the trading literature as the leading authority on RSI interpretation after Wilder himself, proposed a substantial refinement of this framework. Cardwell observed that the oscillator's effective operating range is not fixed but shifts according to the prevailing market regime: in bull markets the RSI tends to oscillate between 40 and 80, while in bear markets it tends to oscillate between 20 and 60. This article examines the theoretical foundations of the Cardwell range-shift methodology, its practical decision rules, its integration with broader trend-identification concepts, and its limitations as an analytical, rather than purely mechanical, trading framework.
● 1. Introduction
Momentum oscillators occupy a central place in technical market analysis because they attempt to quantify the speed and magnitude of price change rather than price level alone. Wilder's original RSI formulation compresses price momentum into a bounded scale from 0 to 100 and designates readings above 70 as overbought and readings below 30 as oversold, implying an elevated probability of reversal at these extremes.
In practice, this static reading produces a well-documented weakness: during sustained directional trends, the RSI can remain at or near an extreme for long periods without the anticipated reversal occurring. A trader who shorts every instance of RSI above 70 in a strong uptrend, or who buys every instance of RSI below 30 in a strong downtrend, tends to accumulate losing trades precisely because the 70/30 framework was designed for range-bound, non-trending conditions rather than for markets exhibiting sustained directional momentum.
Cardwell's contribution was to recognize that this apparent flaw is, in fact, informative: the manner in which the RSI fails to behave according to the normal 30/70 range is itself a signal of the character of the prevailing trend. Rather than treating range violations as noise, Cardwell reclassified the entire operating band of the indicator according to market regime, producing the 40/80 and 20/60 range rules that form the basis of the strategy discussed here.
● 2. Theoretical Basis: Why the Range Shifts
The logic underlying Cardwell's adjustment rests on an asymmetry in trader psychology and in the statistical behavior of gains versus losses during directional markets. During a sustained uptrend, upward price movements are both more frequent and often larger in magnitude than the corrective declines that interrupt them; because RSI is calculated from the ratio of average gains to average losses over a lookback period, this asymmetry mechanically compresses the indicator's lower boundary upward and permits its upper boundary to extend further before an actual reversal occurs.
The symmetric logic applies in a bear market: sustained downward momentum, driven by distribution and the progressive withdrawal of buying interest, compresses the RSI's upper boundary downward, such that rallies within the downtrend struggle to lift the oscillator materially above 60, while oversold extremes can extend well beyond the traditional 30 threshold down toward 20.
Cardwell therefore proposed that the same forty-point span used in the normal range (the distance between 30 and 70) be preserved but repositioned according to regime: shifted upward by ten points to 40-80 in a bull market, and shifted downward by ten points to 20-60 in a bear market. This preserves the internal proportions of the oscillator while adapting its reference points to the trend environment in which it is being read.
● 3. The Core Range Rules
The complete set of range parameters used in the Cardwell method, as commonly presented in the technical analysis literature, is as follows.
In a normal, range-bound market, the overbought boundary sits at 70 and the oversold boundary sits at 30. In a bull market, or uptrend, these boundaries shift upward: the overbought boundary rises to 80 and the oversold boundary rises to 40. In a bear market, or downtrend, the boundaries shift downward: the overbought boundary falls to 60 and the oversold boundary falls to 20.
Within this framework, the levels of 40 and 60 assume particular diagnostic importance as "trend-confirmation" boundaries. In an established uptrend, RSI pullbacks are expected to find support at or above the 40 level; a sustained close below 40 is treated as a warning that the bullish regime may be deteriorating. In an established downtrend, RSI rallies are expected to encounter resistance at or below the 60 level; a sustained close above 60 is treated as a warning that the bearish regime may be ending. These interior boundaries are often more informative for early trend-change detection than the outer 80/20 extremes, because they are tested more frequently during normal trend pullbacks and rallies.
● 4. Range Rules as a Quadrant Framework
A useful way to visualize the range-shift concept is to compare the two regimes directly on a shared 0-100 axis. One arrangement places the 80/40 bull range above the 60/20 bear range; a second arrangement reverses the visual order to emphasize the transition from a bear regime, occupying the lower band, to a bull regime, occupying the upper band.
This quadrant structure clarifies the central diagnostic task facing the analyst: determining which of the two forty-point bands the RSI is currently respecting, and identifying the moment at which the oscillator migrates from one band to the other. When the RSI applies the 80/40 range while sitting in the upper zone between 60 and 100, this confirms a bull regime. When it applies the 60/20 range while sitting in the lower zone between 0 and 60, this confirms a bear regime. When the RSI is still working within the 60/20 range in the lower zone but has not yet broken out, the analyst should watch for a possible reversal out of the bear regime. Finally, when the RSI has moved into the upper zone and begun respecting the 80/40 range instead, this indicates that the regime has migrated from bear to bull. That migration, referred to in the literature as a "range shift," is treated as one of the earliest reliable indications that the underlying trend itself has changed.
● 5. Range Analysis in the Context of the Full RSI Scale
Cardwell's 40/80/20/60 framework is best understood as a refinement layered on top of the complete zero-to-one-hundred RSI scale, rather than a replacement for it. The fuller structure distinguishes extreme overbought and oversold territory from the initial overbought/oversold zones, and identifies the 50 level as the basis, or midpoint, that separates positive momentum readings from negative ones.
The full set of parameters can be summarized as: the value of RSI ranges from 0 to 100; the normal range is 70/30; the bull range is 80/40; the bear range is 60/20; the overbought/oversold extremes are set at 80/20; and the mid-point, or basis level, is 50.
Reading the scale from top to bottom, above 80 lies extreme overbought territory; between 70 and 80 lies the initial overbought zone; between 50 and 70 lies positive territory; between 30 and 50 lies negative territory; between 20 and 30 lies the initial oversold zone; and below 20 lies extreme oversold territory.
Within this structure, the 50 level operates as a coarse trend filter: RSI readings persistently above 50 are associated with net-positive momentum, while readings persistently below 50 are associated with net-negative momentum. The 70/30 boundaries define the conventional overbought/oversold zones appropriate to non-trending, range-bound conditions. The 80/20 boundaries mark more extreme conditions used across both regime interpretations. The Cardwell contribution operates as an intermediate layer, using the 40 and 60 levels specifically to determine which of the two regime-shifted ranges is currently governing price behavior.
● 6. Trend Identification and the Role of Short-, Intermediate-, and Long-Term Turns
A further component of the broader Cardwell-style approach to trend reading concerns the sequencing of turning points across multiple time horizons. In a developing positive trend, analysts commonly distinguish three successive stages. First, the short-term trend turns up, offering the earliest and most tentative signal of change. Second, the intermediate trend turns up, as the short-term move gains persistence and confirmation. Third, the intermediate-to-long-term trend turns up, marking the point at which the broader trend begins its upside acceleration.
The mirror sequence characterizes a developing negative trend: first the short-term trend turns down, then the intermediate trend turns down, and finally the intermediate-to-long-term trend turns down, marking the beginning of downside acceleration.
This sequencing framework is complementary to the RSI range-shift methodology rather than a substitute for it. Range shifts in the RSI are typically expected to appear in tandem with, or in some cases slightly ahead of, the intermediate-term price turn, giving the range-shift signal practical value as a corroborating, and occasionally leading, indicator of a developing change in the longer-term trend.
● 7. Practical Application and Decision Rules
The regime-based range rules translate into a small number of operational guidelines that recur consistently across the technical analysis literature on this method.
The first step is regime identification: establishing whether the market is currently in a bull or bear regime, commonly approximated using a longer-term moving average, such as price relative to its 200-period average, before selecting which RSI range to apply.
The second is treating the interior boundary as support or resistance: in a bull regime, RSI pullbacks toward 40 are treated as a potential buying opportunity, provided the 40 level holds; in a bear regime, RSI rallies toward 60 are treated as a potential selling or shorting opportunity, provided the 60 level holds.
The third is range-shift monitoring: watching the opposite boundary of the currently prevailing range for early warning signs. In a bull range, this means monitoring whether RSI can still rebound convincingly above 60 after a pullback; failure to do so suggests the uptrend is losing strength and a shift toward the bear range of 20 to 60 may be underway.
The fourth is confirmation over anticipation: because range shifts can occasionally resemble whipsaws, especially in choppy or transitional markets, the method is generally recommended as one input within a broader weight-of-the-evidence approach that also incorporates price structure, moving averages, candlestick confirmation, and divergence analysis, rather than as a standalone mechanical trading system.
The fifth concerns sideways conditions: when RSI oscillates persistently between roughly 40 and 60 without committing to either range, this is read as a sideways or transitional market, in which trend-following range rules are less reliable and increased caution is warranted.
● 8. Limitations and Critical Considerations
Several caveats accompany the practical use of this framework.
First, the Cardwell ranges are empirical observations drawn from recurring market behavior rather than fixed mathematical constants; individual securities may respect slightly different boundaries, and some practitioners apply a five-point cushion around the 60 and 40 levels to account for this variability.
Second, the method depends on an accurate prior classification of the market regime; because that classification itself typically relies on a lagging measure such as a moving average, there is an inherent element of hindsight in confirming which range "should" have applied at a given time, which complicates rigorous backtesting of the strategy in isolation.
Third, the approach is explicitly presented in the original source material as a component of disciplined trading practice rather than a guaranteed predictive system; Cardwell himself emphasized that range analysis is best combined with patience, a defined trading plan, and other corroborating evidence rather than applied as an automatic buy or sell trigger.
● 9. Conclusion
Andrew Cardwell's regime-based reinterpretation of the RSI represents a meaningful conceptual advance over the traditional static 70/30 framework. By recognizing that the oscillator's effective range migrates predictably with the character of the prevailing trend, and by formalizing this migration into the 40/80 bull range and 20/60 bear range, Cardwell provided technical analysts with a tool that is explicitly sensitive to trend context. The interior 40 and 60 boundaries, in particular, function as accessible early-warning levels for trend continuation or exhaustion, complementing the broader multi-horizon trend-turn sequencing that underlies classical technical trend analysis. As with any technical framework, the range-shift methodology is best deployed as one component of a broader analytical process rather than as an isolated, purely mechanical trading rule.
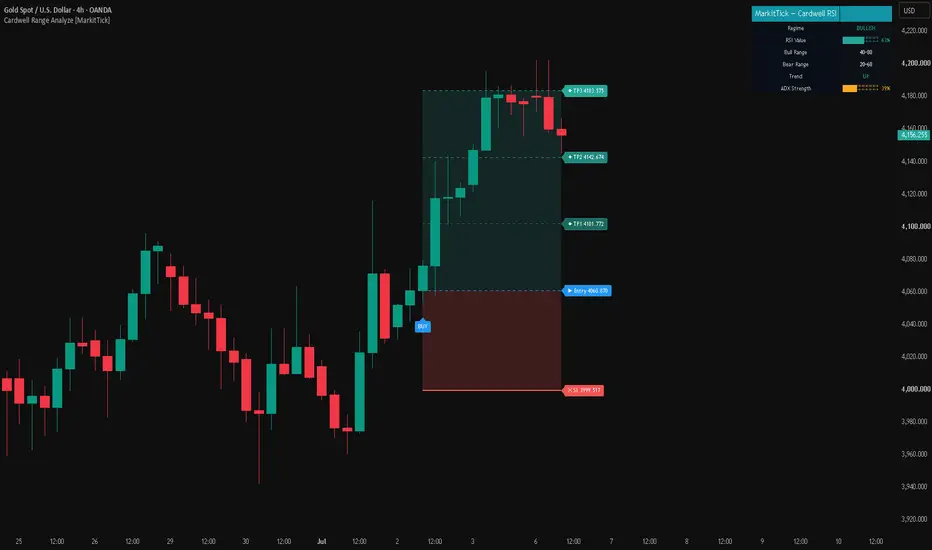
Cardwell Range Analyze applies the regime-based range rules discussed above, shifting the effective RSI bounds from the standard 30/70 to 40/80 in bull trends and 20/60 in bear trends. The 40 and 60 levels serve as the trend-confirmation boundaries described in Section 3, providing an early indication of a range shift before it is confirmed by price. As with the broader methodology, a failure to clear 60 in an uptrend, or a failure to hold above 40 in a downtrend, should be read as a warning sign within a wider weight-of-evidence approach rather than as an isolated signal.
● References
Cardwell, A. Using the RSI. Cardwell RSI EDGE, Inc.
Cardwell RSI EDGE, Inc. Official course materials and commentary.
GTLackey's RPM. "RSI Bull and Bear Ranges." gtlackey.com/rsi-bull-and-bear-ranges.
Hayden, J. RSI: The Complete Guide.
⚠️Disclaimer
This article is for educational purposes only and does not constitute financial, investment, or trading advice. All quantitative frameworks discussed are theoretical and carry inherent risks; past performance is never indicative of future results. You are solely responsible for your own investment decisions, risk management, and any financial losses incurred. No content herein guarantees profit or success in real-world market environments. Please consult with a qualified financial advisor before deploying any strategies.  Education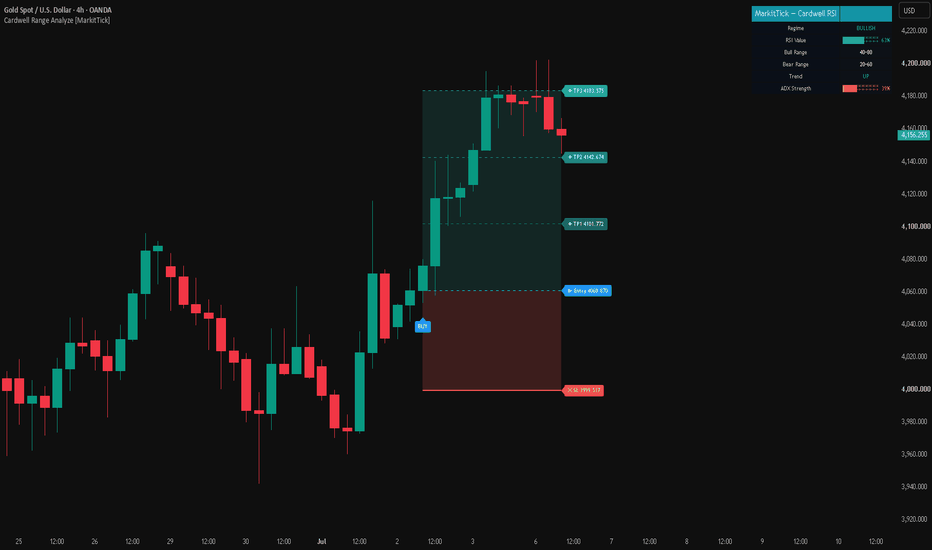
Silver – Another Rally Within The Longer Term Downtrend?Silver has experienced a reversal of its fortunes over the last 2 weeks, trading from 7-month lows hit on June 23rd at 55.589 all the way up to close on Friday, July 3rd at 62.369. Perhaps unsurprisingly this rally has coincided with the reopening of the Strait of Hormuz, which has seen oil plummet back below $70, easing inflation concerns which had weighed heavily on Silver during June. Not only that, but Thursday’s weaker US jobs numbers saw expectations for Federal Reserve interest rate hikes, possibly as early as the end of July, ease back, reducing the downside pressure on Silver and other precious metals that pay no interest or dividends.
Looking forward, the week ahead is light on events, other than the release of the Fed minutes from their June meeting, the first under new Chair Kevin Warsh, which are due on Wednesday at 1900 BST. This may mean price action, sentiment and the technical outlook could take on greater significance. The Monday open has seen prices drop 1.2% down to 61.609 at the time of writing (0700 BST), which may suggest a nervy few days ahead for Silver traders..
Technical Update: Is This Another Rally Within the Downtrend?
A recovery has developed from the June 23rd low at 55.589, driven by short‑term over‑extended downside conditions, but traders may now be assessing whether this is simply a limited rally, or the start of a positive sentiment shift capable of producing a more extended phase of strength.
Since that low at 55.589, daily candles have shown small real bodies and long upper/lower shadows, signalling consolidation rather than directional conviction. Unless key support or resistance levels are broken in the week ahead, this type of indecisive activity could persist.
So what are those potential support and resistance levels?
Potential Resistance Focus:
With a pattern of lower highs and lower lows in price still evident, it might be argued that a downtrend pattern remains in force. If this is the case, it may prove to be the declining Bollinger mid-average, currently at 63.212, that marks the first key resistance level. If potential is to turn toward further price strength, it could well be closes above 63.212 that are required to see it.
Closes above 63.212, if seen, could prompt traders to look for a more extended upside retracement of the January/March decline. This may result in further upside toward 68.283, which is the 38.2% Fibonacci retracement level, and potentially then 72.237, the higher 50% level.
Potential Support Focus:
If the Bollinger mid-average resistance at 63.212 continues to cap any future rally in Silver over upcoming sessions, risks may turn towards a fresh phase of price weakness. As the chart below shows, the first support level might prove to be 55.589, which is equal to the June 23rd low. Within the current backdrop, it might prove prudent to monitor how 55.589 is defended on a closing basis to assess if continued price weakness may emerge.
As the chart above illustrates, a break below 55.589 could see downside momentum increase, with the next support perhaps being marked by 48.619, which is the low trade posted on November 21st 2025, maybe even 45.533, the low posted on October 28th 2025.
The material provided here has not been prepared accordance with legal requirements designed to promote the independence of investment research and as such is considered to be a marketing communication. Whilst it is not subject to any prohibition on dealing ahead of the dissemination of investment research, we will not seek to take any advantage before providing it to our clients.
Pepperstone doesn’t represent that the material provided here is accurate, current or complete, and therefore shouldn’t be relied upon as such. The information, whether from a third party or not, isn’t to be considered as a recommendation; or an offer to buy or sell; or the solicitation of an offer to buy or sell any security, financial product or instrument; or to participate in any particular trading strategy. It does not take into account readers’ financial situation or investment objectives. We advise any readers of this content to seek their own advice. Without the approval of Pepperstone, reproduction or redistribution of this information isn’t permitted.
 Short
Short
AUDUSD: Volatility Remains Below AverageAUDUSD continues to trade within a broad consolidation phase on the 15-minute timeframe following the sharp decline observed during the second half of June. Although buyers have managed to lift prices modestly from recent lows, the recovery has been gradual and lacks the strong momentum typically associated with the beginning of a sustained bullish trend.
The ATR Expansion indicator currently remains below the zero line, indicating that market volatility is still below its recent historical average. This suggests that recent price movements have occurred in a relatively quiet trading environment despite the modest upward recovery.
Market Structure
The short-term market structure continues to reflect consolidation following the previous bearish move.
After the strong decline, AUDUSD established a relatively stable trading range where both buyers and sellers have repeatedly tested control without producing a decisive breakout. Recent price action shows slightly higher lows, but the overall range remains intact.
The absence of sustained directional momentum indicates that market participants are still waiting for stronger catalysts before committing to larger positions.
Reading the ATR Expansion
The ATR Expansion histogram currently remains in negative territory, with the latest reading below the zero baseline.
This indicates that the current Average True Range is lower than its 50-period historical average, meaning daily price fluctuations have become smaller compared to previous weeks.
Throughout the chart, several brief spikes above zero reflected temporary increases in volatility during stronger market movements. However, these periods were relatively short-lived and were followed by renewed contraction in volatility.
The latest negative reading suggests that the current recovery is occurring under relatively subdued market conditions rather than during a period of expanding participation.
What Traders Should Watch
The current market presents two possible scenarios.
Bullish Scenario
If AUDUSD breaks above the current consolidation range while ATR Expansion rises above the zero line, it would indicate that volatility is beginning to expand alongside the price advance.
Increasing volatility during a breakout often reflects greater market participation and may improve the probability of trend continuation.
Continued Consolidation
If ATR Expansion remains below zero while price continues oscillating within the current range, the market is likely to remain in a low-volatility environment.
In this scenario, price may continue producing relatively small fluctuations without establishing a sustained directional trend.
Trading Perspective
Although AUDUSD has shown signs of stabilization after its previous decline, the ATR Expansion indicator suggests that market activity remains relatively subdued.
The recent recovery has not yet been accompanied by expanding volatility, reducing confidence that a significant trend is currently developing.
For trend-following traders, it may be beneficial to monitor whether ATR Expansion begins moving above the zero line before anticipating stronger directional movement.
Conclusion
AUDUSD remains in a consolidation phase with volatility continuing to trade below its historical average.
The ATR Expansion indicator suggests that current market activity remains relatively quiet despite the recent recovery in price. Until volatility begins expanding again, the market may continue experiencing range-bound conditions rather than sustained directional movement.
Monitoring both price structure and changes in ATR Expansion can help traders identify whether the next breakout is supported by increasing market participation. Understanding ATR ExpansionIntroduction
Market volatility is constantly changing. Some trading sessions experience large price swings and strong directional movement, while others remain quiet with relatively small fluctuations.
Understanding these changes in volatility is an important part of technical analysis because volatility often influences trading opportunities, position sizing, and market behavior.
One of the most widely used measures of volatility is the Average True Range (ATR). While ATR shows the absolute level of market volatility, it does not immediately indicate whether current volatility is unusually high or unusually low compared to recent market conditions.
This is where ATR Expansion becomes useful.
Instead of displaying the ATR value alone, ATR Expansion compares the current ATR with its historical average, allowing traders to quickly determine whether volatility is expanding or contracting.
What is ATR Expansion?
ATR Expansion measures how much the current Average True Range differs from its recent average.
It answers a simple question:
Is market volatility currently higher or lower than normal?
The indicator expresses this relationship as a percentage, making it easier to compare different markets and timeframes.
Positive values indicate that current volatility is above its historical average.
Negative values indicate that volatility is below its recent average.
How ATR Expansion Works
The indicator first calculates the Average True Range (ATR) using the selected ATR period.
Next, it calculates a moving average of the ATR to establish a historical volatility baseline.
The calculation is:
ATR Expansion = ((Current ATR−ATR Baseline) / ATR Baseline) ×100
The result is displayed as a histogram centered around the zero line.
- Positive values indicate above-average volatility.
- Negative values indicate below-average volatility.
- Larger values indicate greater volatility expansion.
Why Measure Volatility Expansion?
Raw ATR values can sometimes be difficult to interpret.
For example, an ATR value of 0.45 may represent high volatility for one instrument but relatively low volatility for another.
ATR Expansion solves this problem by comparing the current ATR to its own historical average instead of using absolute values.
This relative approach makes it much easier to determine whether the market is becoming more active or quieter than usual.
Reading the Indicator
Above Zero
When ATR Expansion is above zero, current market volatility is higher than its historical average.
This often occurs during:
- Strong trends
- Breakouts
- High-impact news events
- Periods of increased trading activity
Higher volatility simply means price is moving more aggressively. It does not indicate whether the market is bullish or bearish.
Below Zero
When ATR Expansion is below zero, volatility is lower than normal.
These conditions often occur during:
- Sideways markets
- Consolidation
- Low trading activity
- Trend pauses
Periods of low volatility frequently precede larger market movements, although the eventual direction cannot be determined by ATR Expansion alone.
Expanding Histogram
A rising histogram indicates that volatility is increasing relative to recent market conditions.
This often reflects growing market participation and stronger price movement.
Contracting Histogram
A falling histogram indicates that volatility is decreasing.
This typically suggests that the market is becoming less active as price movement begins to slow.
Practical Applications
ATR Expansion can support several aspects of technical analysis.
Volatility Confirmation
When price begins moving strongly while ATR Expansion also rises, the move is supported by increasing market activity.
Breakout Analysis
Many significant breakouts are accompanied by expanding volatility.
An increasing ATR Expansion may provide additional confidence that a breakout is attracting greater market participation.
Consolidation Detection
A prolonged period of negative ATR Expansion often reflects quiet market conditions where volatility remains below average.
These periods may eventually lead to larger price movements as volatility returns.
Risk Management
Because ATR Expansion measures changing market activity, it can help traders understand whether market conditions are becoming more volatile or less volatile when planning position size and managing risk.
ATR Expansion vs ATR
Although both indicators use the Average True Range, they provide different information.
ATR measures the absolute size of recent price movement.
ATR Expansion measures how current ATR compares with its historical average.
For example:
- ATR answers: How volatile is the market?
- ATR Expansion answers: Is volatility increasing or decreasing compared to normal?
The two indicators complement each other rather than replace one another.
Limitations
ATR Expansion measures volatility only.
It does not provide information about market direction.
Periods of increasing volatility may accompany either bullish rallies or bearish declines.
Likewise, low volatility does not guarantee that a breakout will occur.
For this reason, ATR Expansion should be used together with trend analysis, price action, support and resistance, and overall market structure.
Conclusion
ATR Expansion provides a simple yet effective way to monitor changing market volatility.
By comparing the current Average True Range with its recent historical average, the indicator helps traders quickly identify whether market activity is expanding or contracting.
Rather than focusing on price direction, ATR Expansion offers valuable insight into the intensity of market movement, making it a useful companion to trend-following, breakout, and price action analysis across all markets and timeframes. $ONDS:Violent pullback inside a much bigger structural upptrendThe chart tells the story clearly: Ondas rallied hard off its 2025 base, spiking above $15 before snapping back sharply a -46.6% drawdown in just 22 bars/34 days, now sitting in the $7.25–$8 zone. That's a brutal correction on the surface, but it's landing right at the lower boundary of the ascending structure that's been building since the initial breakout the kind of higher-timeframe trendline test that often marks "shake the weak hands" territory rather than trend failure. The rising channel projects well into the mid-teens and beyond if the structure holds, which lines up with where Wall Street's price targets already sit.
Why the pullback looks more like noise than a broken thesis:
The drawdown has a clear, mechanical explanation not deteriorating fundamentals. Insider and legacy-holder selling (CEO Eric Brock's $31.9M sale, resale registrations tied to the Omnisys and World View acquisitions) created real supply overhang and spooked short-term traders. That's dilution pressure, not a demand problem.
Meanwhile, the actual business is accelerating:
→ $40M+ in new orders for autonomous defense systems in June alone, driven by surging demand for loitering munition systems across Europe and the U.S.
→ A new collaboration between Ondas's Sentrycs and Lockheed Martin — serious validation from a top-tier defense prime.
→ The Cyberhawk acquisition pushes Ondas into critical infrastructure intelligence (software, data, AI) — a new analyst initiated coverage with a Buy rating specifically citing this synergy.
→ World View (Ondas subsidiary) was selected as the stratospheric high-altitude balloon provider for U.S. Naval Forces.
→ New "Autonomy at First Contact" defense systems launched at Eurosatory 2026, Europe's premier defense expo.
→ Last quarter's numbers were staggering: revenue +605% YoY, +66% QoQ, with EPS blowing past estimates ($0.81 actual vs. -$0.05 expected).
→ Analyst consensus sits at Strong Buy, with price targets ranging $16–$25 — 2x to 3x+ from current levels.
The setup:a name with real revenue acceleration and defense-sector tailwinds (drone/autonomous systems demand isn't slowing down globally) getting knocked down by supply-side noise rather than a broken story. That's historically the type of dip that gets bought once the selling pressure exhausts itself watch for the insider/resale overhang to clear and volume to confirm support here before the next leg.
Risk to manage: further share sales under the Form 144 filing could keep a lid on rallies short-term, and next earnings (Aug 17) will be the real test of whether the growth trajectory holds.
*Not financial advice for educational/discussion purposes.*
Stay vigilant!  Long
Long
Can you rely on RELY?Why we like RELY
Trend has flipped up on the higher timeframe. Price is back above the 50-week and 200-week SMAs and holding above the Ichimoku cloud after a long base. Buyers have control of the weekly again.
Momentum confirms. Weekly MACD has crossed above zero and is expanding, and stochastic is rising up through the middle of its range with room before overbought. Not a tired move.
The setup: a multi-year downtrend line test. Price is pressing into descending resistance off the 2023 highs, which lines up with the prior high around 24 to 25. That confluence is the line in the sand. A weekly close through it is a multi-year trendline break, and those tend to run.
Group tailwind. Digital payments/fintech is curling up as a group, not just one name. IPAY is leading its bucket and several payments names are basing or breaking out at the same time. RELY is one of the stronger charts in that cohort, already above its cloud while others are still under theirs.
Trigger and levels. Breakout and hold above 24 to 25 is the entry. Alternatively, buy pullbacks that hold above the cloud (~18 to 19). First target is the 27.5 zone (2023 highs), open above that.
Invalidation. Losing the cloud and closing back under ~18 kills the thesis. That is the higher-timeframe uptrend failing.
The honest caveat. Right at the line, reward to the first resistance is thin, so the clean trades are the confirmed breakout or the pullback to the cloud, not chasing into the trendline. Strong chart, let it give you the entry.
 Long
Long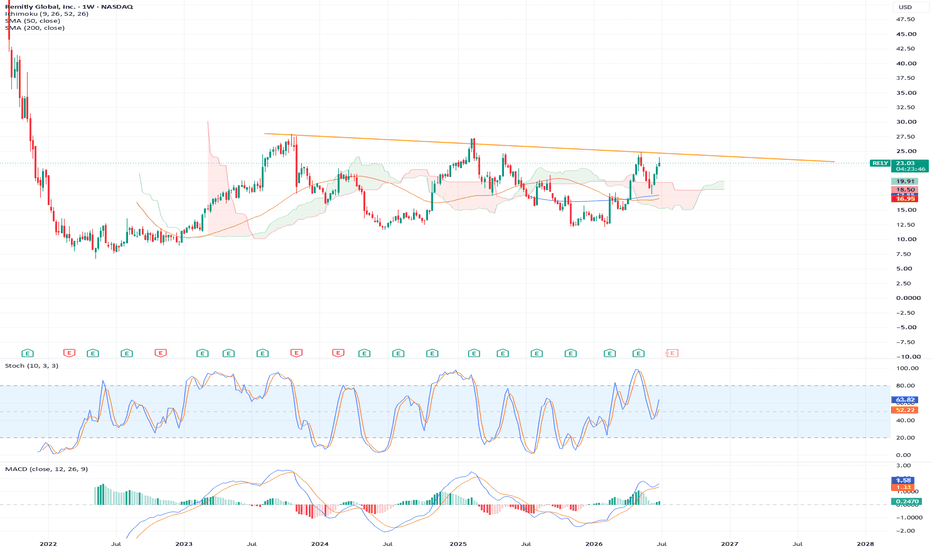
Long 
NVIDIA – Facing A Technical Correction Test?NVIDIA is a stock at the heart of the AI trade and while much has been made of AMD and Micron in recent weeks, it remains the benchmark against which all in the chipmaker sector are judged against. After a stellar run in May, June has been a volatile month for AI stocks which has seen NVIDIA in particular fall from a high of 231.79 on June 3rd down to a low of 189.54 on Monday, before recovering to its current level at 197.20. Monday’s drop to 2 month lows brings an interestingly technical level into play, which could have implications for not only the direction of NVIDIA stock but also the entire AI sector in general as we move forward into the early days and weeks of Q3.
This technical update is outlined below and could be something worth monitoring through the important event risk tomorrow when Fed Chair Kevin Warsh speaks at 1400 BST and then on Thursday when the latest US jobs report is release at 1330 BST.
Technical Update: Facing Technical Correction Test?
When trading any market, there are times when important support or resistance levels are tested or even broken, which can lead to directional moves either up or down. NVIDIA’s share price has recently seen a strong sell‑off and has tested one of these possible levels at 191.84, equal to the 61.8% Fibonacci retracement of the March 30th to May 14th advance.
Within the Fibonacci approach, three retracement levels are used after a phase of strength or weakness — 38.2%, 50%, and 61.8%. Looking at the NVIDIA chart above, each of these levels has recently played a role in highlighting potential of directional moves.
The 208.63 level, which was the 38.2% Fibonacci retracement, initially held and prompted a bounce, but closing breaks on June 5th triggered weakness toward 200.17, the deeper 50% level. While this also held briefly, renewed weakness saw closing breaks lower that has now taken price to 191.84, the deeper 61.8% level.
This illustrates how traders can use Fibonacci retracements to gauge whether a break of one support is occurring and to identify the next potential support, which in the case of NVIDIA, has been the next Fibonacci level.
Fibonacci techniques suggest NVIDIA has again tested key support at 191.84, and traders may anticipate at least a recovery attempt from that point. However, they will also monitor closing defence of 191.84, as closing breaks lower could lead to further price declines.
What are the Risks if 191.84 is Broken on a Closing Basis?
A closing break below the 61.8% retracement can be a potential trigger. Some traders even suggest risks may turn toward a revisit to where the original move began, which for NVIDIA is 164.28, the March 30th session low.
However, as the chart above shows, there are possible supports evident between the 191.84 and 164.28 levels. Therefore, closing breaks under 191.84 if seen, could result in price weakness, but earlier support levels might come into play. For instance, the April 10th low at 184.80 could be a focus on a downside break of 191.84, even then 180.33, the April 8th session extreme, possibly further.
What if 191.84 Support Remains Intact on a Closing Basis?
The 191.84 retracement is currently holding on a closing basis, and while this continues, risks may be for a more extended phase of price strength. In this case, traders may monitor 203.75, equal to the June 23rd session high.
As the chart above shows, if closing breaks above 203.75 are seen, the next resistance might prove to be 206.04, which is the 38.2% retracement. If this level is then beached on a closing basis, focus could shift to 211.36, a level equal to the 50% Fibonacci retracement, possibly further.
The material provided here has not been prepared accordance with legal requirements designed to promote the independence of investment research and as such is considered to be a marketing communication. Whilst it is not subject to any prohibition on dealing ahead of the dissemination of investment research, we will not seek to take any advantage before providing it to our clients.
Pepperstone doesn’t represent that the material provided here is accurate, current or complete, and therefore shouldn’t be relied upon as such. The information, whether from a third party or not, isn’t to be considered as a recommendation; or an offer to buy or sell; or the solicitation of an offer to buy or sell any security, financial product or instrument; or to participate in any particular trading strategy. It does not take into account readers’ financial situation or investment objectives. We advise any readers of this content to seek their own advice. Without the approval of Pepperstone, reproduction or redistribution of this information isn’t permitted.
Short 
EURUSD - Is the Short-Term Low Now in Place?Last week (June 24th), EURUSD traded at 1.1324, a one year low, the result of diverging interest rate outlooks between the ECB and Federal Reserve.
On the EUR side, traders embraced more dovish rhetoric to cut back their expectations for future ECB interest rate hikes after central bank President Christine Lagarde suggested that she doesn’t see any need for a more aggressive response to combat a surge in inflation created by the Iran war, while Preliminary PMI surveys for the Eurozone’s two biggest economies, France and Germany showed economic activity shrank in June, a warning sign that growth in the Eurozone may be stalling.
On the USD side, it was a different story, with economic data remaining resilient and Fed speakers continuing to flag their inflation concerns, adding support to the recent narrative that the US central bank may stand ready to hike rates as early as its next meeting at the end of July.
Since its Wednesday low, EURUSD has rebounded, traded several times up to the 1.1430 area before dropping back to 1.1395 again at the time of writing (0645 BST). This price action poses the question, are FX traders readying themselves for a fresh assault on the downside or is the short-term low in place and a deeper squeeze possible?
The answer to that question may be contained in the outcome of 3 key events scheduled for tomorrow and Thursday. The first is the release of preliminary inflation data for the Eurozone at 1000 BST. EURUSD traders may be watching closely to find evidence supporting or contradicting the recent interest rate outlook provided by ECB President Lagarde. Then, later in the day at 1400 BST Madame Lagarde and Fed Chair Warsh, share the stage at a central bank event organized by the ECB in Sintra, Portugal. Their comments on inflation, economic growth, future rate moves and the Iran conflict could keep FX market volatility elevated into Thursday, when traders receive the latest US Non-farms jobs report at 1330 BST.
With all of this and the early capital flows at start of Q3 to account for, being prepared for bigger directional moves could be a sensible decision.
Technical Update: Recovering from Retracement Support:
Having posted a recovery high of 1.1849 in April, EURUSD has since seen a retreat of 4.4%, taking the pair last week to its lowest level since late May 2025 at 1.1324. This type of move would normally attract trader attention given the potential for further declines. However, as the weekly chart below shows, this sell-off has tested a potential long-term support at 1.1359, the 38.2% Fibonacci retracement of the January 2025 to January 2026 advance.
A 38.2% retracement can act as an important support focus, and with the 1.1359 level remaining intact on a weekly closing basis, fresh attempts at upside have so far emerged this week. The key question now is whether 1.1359 represents a base for a more extended recovery, or if the bounce is simply a limited recovery within a broader downside phase.
Potential Resistance Levels:
The recovery from the support at 1.1359 has confirmed buyer interest is currently present around this area. However, if a more extended phase of strength is to develop, closing breaks above resistance provided by the 38.2% retracement of June weakness at 1.1439 may be required to open the way for more extended upside moves.
If 1.1439 were to give way on a closing basis, attention could shift toward 1.1475, which is the 50% retracement level. A break above 1.1475 may then open scope toward 1.1510, the higher 61.8% retracement.
Potential Support Levels:
We have already suggested that it is the 38.2% long term retracement support at 1.1359 that is a possible longer term focus, but this may only be important if EURUSD closes below it on Friday. However, as discussed above, there is a significant amount of new data traders will need to digest before then, suggesting shorter term levels could also play an important role before the end of the week.
The first key short-term support could be 1.1379, which is equal to half the latest rally. Breaks below this level could lead to further price declines toward 1.1324, which is the June 24th session low, then 1.1211, a level equal to the May 29th 2025 extreme.
On a longer term outlook, Friday’s close could tell us a lot about the where EURUSD may move next in the first month of Q3. If the long-term retracement support at 1.1359, has been broken on a weekly closing basis it may suggest a deeper retracement of the January 2025 to January 2026 price strength could be on the cards.
The material provided here has not been prepared accordance with legal requirements designed to promote the independence of investment research and as such is considered to be a marketing communication. Whilst it is not subject to any prohibition on dealing ahead of the dissemination of investment research, we will not seek to take any advantage before providing it to our clients.
Pepperstone doesn’t represent that the material provided here is accurate, current or complete, and therefore shouldn’t be relied upon as such. The information, whether from a third party or not, isn’t to be considered as a recommendation; or an offer to buy or sell; or the solicitation of an offer to buy or sell any security, financial product or instrument; or to participate in any particular trading strategy. It does not take into account readers’ financial situation or investment objectives. We advise any readers of this content to seek their own advice. Without the approval of Pepperstone, reproduction or redistribution of this information isn’t permitted.
Long 
US 500 – A Pivotal Trading Period to Start Q3The US 500 starts the new week at a pivotal moment, rocked over the previous 5 trading days by the latest sell off in AI stocks which according to Bank of America led to net outflows from US equity funds in the week ending June 24th for the first time in 3 months (Bloomberg), and by a resumption of attacks by the US and Iran on each other that threatened the fragile stability in the region. These events saw the index open on Monday 22nd June at 7485 and end the week 1.9% lower at 7345.
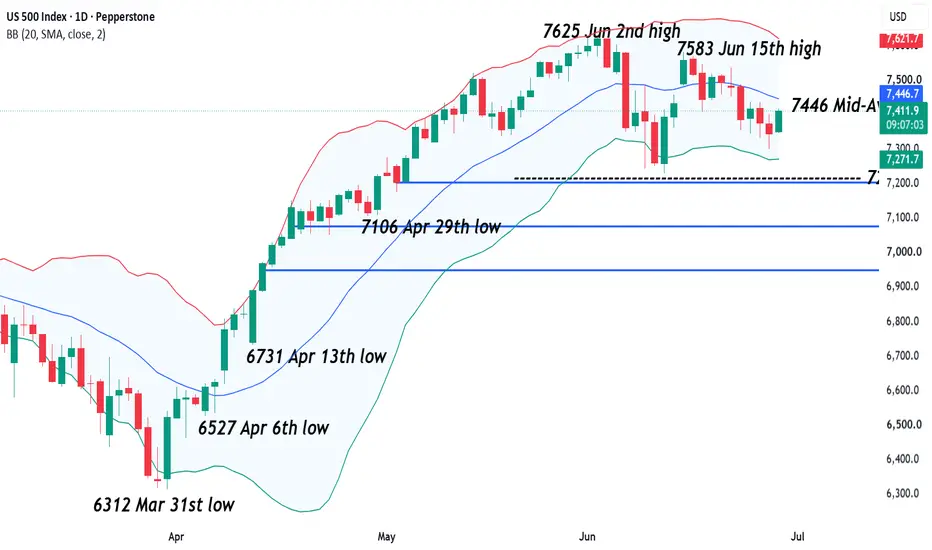
Today’s price action has been more constructive, with US 500 traders reacting positively to news reports released on Sunday that the US and Iran had agreed to stop attacking each other and are likely to resume technical talks on Tuesday aimed at bringing an official end to the war. This has seen prices move briefly up to a high of 7404, before settling back to trade +0.65% at 7393 at the time of writing (0700 BST). However, it is possibly too early to decide whether this move is sustainable given the important events packed into a week shortened by the US Independence Day holiday on Friday.
Looking forward, the outcome of Tuesday’s peace talks between the US-Iran may grab headlines, but on Wednesday the focus could shift to comments made by Federal Reserve Chair Kevin Warsh when he speaks at 1400 BST from a central bank event organised by the ECB in Sintra, Portugal. With traders nervous about inflation and rate hikes, the direction of the US 500 is likely to remain sensitive to any updates that he makes on these topics. Then on Thursday, the latest US non-farm payrolls report is due for release at 1330 BST, and it could be worth monitoring whether the headline jobs number remains resilient, and if the unemployment rate remains around 4.3%, which could see market expectations for a Federal Reserve rate hike on July 29th increase, a potential negative for sentiment toward the US 500. Or, if there are signs of weakness in the headline and the unemployment rate climbs, something which could see rate hike expectations put on hold until later in the year, a possible positive for the direction of the US 500.
With so much to absorb in a short period, there could be potential for extra price volatility in the US 500 to start Q3!
Technical Update: Weak Test of June Highs in Place?
Within technical analysis, an uptrend is defined by higher price highs and higher price lows, where a setback after a new recovery high is followed by buyers re‑emerging and generating enough strength to break and close above the previous high. In this type of price behaviour, traders anticipate continued price strength to maintain the positive momentum.
However, when a phase of strength fails to overcome the previous high, it is often viewed as a ‘weak test’ of that upside extreme, especially if it is followed by fresh price weakness.
In the US 500 index, as the chart above shows, strength into the June 15th high failed below the June 2nd extreme at 7625, followed by the latest price decline. While this doesn’t guarantee further weakness, traders may look to define key support and resistance levels that could determine whether a more extended correction is possible, or if the weakness proves limited before fresh upside returns.
Potential Support Levels:
If the recent price activity is developing into a ‘weak test’, the support focus often turns to the last correction low of the advance. For the US 500 index, this looks on the chart to be 7299, which is the June 11th session low and rally point.
Closing breaks below 7299 could trigger a deeper retracement of the March 31st to June 2nd advance, with scope toward 7208, a level equal to the 38.2% Fibonacci retracement and potentially then 7106, the April 29th low.
Potential Resistance Levels:
While support at 7299 remains intact attempts at price strength are still possible. If this is the case, the initial resistance level could stand at 7446, which represents the current price point of the declining Bollinger mid‑average.
If prices were to break above 7446 on a closing basis, attention may turn toward 7583, which is the June 15th high, and if this were also to give way, risks could then shift back toward the June 2nd upside extreme at 7625.
The material provided here has not been prepared accordance with legal requirements designed to promote the independence of investment research and as such is considered to be a marketing communication. Whilst it is not subject to any prohibition on dealing ahead of the dissemination of investment research, we will not seek to take any advantage before providing it to our clients.
Pepperstone doesn’t represent that the material provided here is accurate, current or complete, and therefore shouldn’t be relied upon as such. The information, whether from a third party or not, isn’t to be considered as a recommendation; or an offer to buy or sell; or the solicitation of an offer to buy or sell any security, financial product or instrument; or to participate in any particular trading strategy. It does not take into account readers’ financial situation or investment objectives. We advise any readers of this content to seek their own advice. Without the approval of Pepperstone, reproduction or redistribution of this information isn’t permitted.
Short 
Gold – Under Heavy Pressure With October Lows in SightAny positive momentum for Gold which saw it touch a high of 4382 last week after the US and Iran signed their interim peace agreement, seems to have evaporated quickly to be replaced with negativity linked to rising inflation risks that may increase the chance of global central banks keeping interest rates at elevated levels for a longer period or even raising them. A scenario which tends to weigh on Gold and other precious metals that pay no interest or dividend.
The double whammy for traders to manage is that the more hawkish outlook embraced by new Chair Kevin Warsh at last week’s Fed meeting, has also helped lift the US dollar to 1-year highs, further pressuring Gold prices which are priced in dollars and make the popular metal more expensive to purchase for international buyers. Yesterday, prices dropped to a new low for 2026 at 3959, and in doing so brought a 10-month extreme registered on October 28th at 3887 within touching distance.
Now, with Gold prices recovering slightly back around 3985 at time of writing (0645 BST) the focus for traders over the next 36 hours could be on the US PCE Index release later today at 1330 BST. This is the Fed’s preferred gauge of inflation, and while prices are anticipated to have risen, any print exceeding market expectations could see chances of a Fed rate hike in July increase, which may be a negative for Gold, while any surprise reading to the downside could lead to a more extended relief rally.
Technical Update: Focus Now on 3959 June Low:
While a period of price strength did emerge in Gold from the June 11th low into the June 17th high, traders appear to have viewed this as a limited reactive recovery within the ongoing price pattern of lower highs and lower lows. As the chart below shows, the rally was held and reversed by resistance at the declining Bollinger mid‑average (currently 4272), from which fresh weakness has developed, a move that on Wednesday saw closing breaks below the June 11th low at 4024.
Of course, an existing downtrend pattern does not guarantee further weakness, and traders could be trying to identify the next key support and resistance levels to gauge where the next directional themes may emerge.
Potential Support Focus:
Wednesday’s drop saw the 3959 level hold the decline and even see a minor bounce. As such, this level may be viewed as the first support focus. Closing breaks below 3959 over the upcoming sessions may lead to further price declines.
If 3959 were to give way on a closing basis, risks could shift toward 3887, the October 28th low as the next important support to monitor. Should that level also fail, focus might then move to 3810, which is the October 2nd extreme, which could represent a deeper potential support area.
Potential Resistance Focus:
While support at 3959 remains intact, attempts at a recovery are possible. If so, the first key resistance may stand at 4120, a level equal to the 38.2% Fibonacci retracement of the latest decline. If fresh strength is to materialise, closing breaks above 4120 may now be required to suggest it.
If prices were to close above the 4120, it could open scope toward 4171, which is the 50% retracement level, and then 4229, the higher 61.8% retracement level.
The material provided here has not been prepared accordance with legal requirements designed to promote the independence of investment research and as such is considered to be a marketing communication. Whilst it is not subject to any prohibition on dealing ahead of the dissemination of investment research, we will not seek to take any advantage before providing it to our clients.
Pepperstone doesn’t represent that the material provided here is accurate, current or complete, and therefore shouldn’t be relied upon as such. The information, whether from a third party or not, isn’t to be considered as a recommendation; or an offer to buy or sell; or the solicitation of an offer to buy or sell any security, financial product or instrument; or to participate in any particular trading strategy. It does not take into account readers’ financial situation or investment objectives. We advise any readers of this content to seek their own advice. Without the approval of Pepperstone, reproduction or redistribution of this information isn’t permitted.
Short 
Gold Breaks Below $4000: Our Opportunity to Profit Has ArrivedHello everyone:
Gold has fallen sharply again, breaking below the $4000 mark and hitting its lowest point this year. A downtrend in gold has formed. I believe our opportunity has arrived. Our chance to make money has arrived.
You might wonder, where is our opportunity to profit?
For short-term traders, following the trend is the best choice. Therefore, when a gold bear market arrives, we only have one trading method: continue shorting gold. Because gold has been highly volatile recently, we only need to identify the resistance area and then short gold in that area to obtain considerable profits.
As I mentioned before, gold has been in a downtrend recently. Although there have been several small rebounds, don't assume the downtrend has ended and go long on gold. Based on my experience, these rebounds after breaking new lows indicate that gold has not yet bottomed out. Historically, the low point of this bear market will be in the $3800-$3900 range.
Therefore, do not attempt to go long in the short term. This downward trend may continue for another 3-5 trading days. Therefore, we should continue to short gold in the near term.
It must be said that our recent trading win rate has been very high. This doesn't indicate superior technical skills or extensive experience, but rather that as short-term traders, we consistently trade with the trend.
Regarding the trading strategy for gold during the US session, I believe we should focus on the resistance area of 4040-4050. Short 
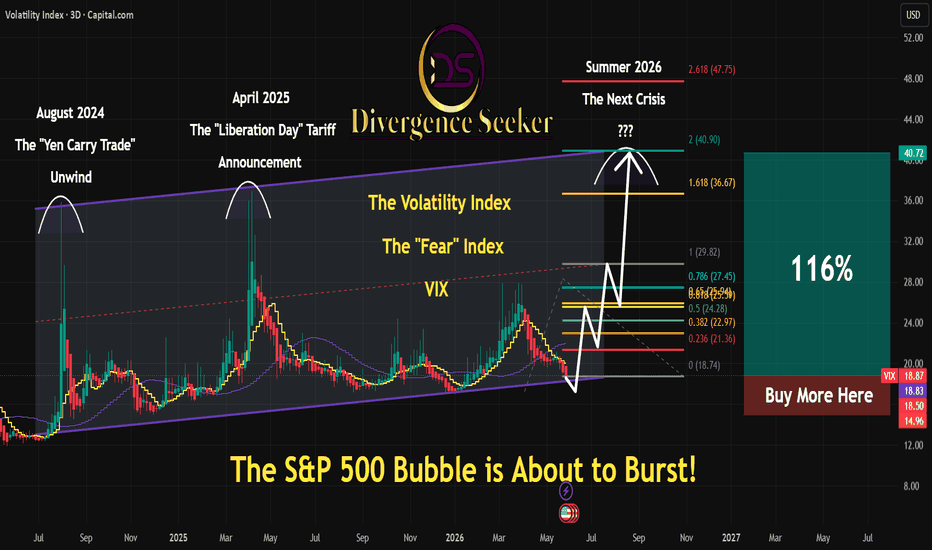
The VIX Illusion: Why the Calm Won't Last, Prepare for the SpikeTake a look at the VIX (CBOE Volatility Index) right now. We are hovering at multi-year lows, painting a picture of absolute market serenity. The crowd is complacent, the premium sellers are making a killing, and the general consensus is that the market is bulletproof.
But as the old trading adage goes: Volatility clusters, and it always mean-reverts. Here is exactly why this ultra-low VIX environment is a coiled spring, and why a massive skyrocket higher is likely right around the corner.
1. The 0DTE "Volatility Suppression" Effect
The explosive rise of 0DTE (Zero Days to Expiration) options has fundamentally changed how the VIX behaves.
Because the VIX is calculated using 30-day implied volatility, the massive volume shifting into same-day options acts as a structural dampener on the index.
The Reality: Intraday risk hasn't disappeared; it’s just being masked. When a true catalyst hits, the sudden unwinding of these short-term positions will force market makers to aggressively hedge, fueling a violent "gamma squeeze" to the upside.
2. Extreme Market Complacency & Positioning
We are seeing historic lows in the Put/Call ratio and massive institutional positioning in short-volatility strategies. Everyone is on one side of the boat.
When the VIX is this low, the cost of portfolio insurance (put options) becomes incredibly cheap.
Smart money is quietly accumulation protection here. When the tide turns, a panicked rush to buy protection will cause the VIX to gap up overnight.
3. A Minefield of Macro Catalysts
Markets are pricing in a perfect economic landing, but the macro backdrop is far from stable. Any of the following triggers could break the calm:
Geopolitical Flashpoints: Sudden escalations that disrupt global supply chains.
Inflation Rebounds: Forcing central banks to pivot back to a hawkish stance.
Liquidity Drain: Quantitative tightening and shifting overnight reverse repo balances quietly pulling the rug from underneath the equity rally.
How I’m Playing This
"Buy umbrellas when it’s sunny, not when it’s pouring."
I am not blindly shorting the equities market here, but I am aggressively scaling into long volatility exposure and asymmetric risk-to-reward setups.
The Strategy: Accumulating longer-dated VIX calls (60-90 days out) and looking at back-month debit spreads. The downside from these levels is mathematically limited, while the upside is explosive.
The Target: A mean-reversion move back toward the 20–25 level at a minimum, with a spike into the 30s if a true systemic shock triggers.
What’s your take?
Are you riding the wave of complacency, or are you preparing for the storm?
Drop your thoughts, targets, and charts in the comments below!
If you found this analysis helpful, please smash that Like button and
Follow for more updates and keep SEEKING THE TRUTH!!!
Disclaimer: This is for educational purposes only and not financial advice. Manage your risk.  Long
Long