$NYSE:VRT (Vertiv Holdings, LLC) Bullish Outlook NYSE:VRT
Company Overview:
Cooling for Data Centers. One of the very few.
Vertiv Holdings Co. engages in the design, manufacture, and service of critical digital infrastructure technology that powers, cools, deploys, secures and maintains electronics that process, store and transmit data. It also offers power management products, thermal management products, integrated rack systems, modular solutions, and management systems for monitoring and controlling digital infrastructure.
Vertiv Group Corp., established in 2016 after its acquisition by Platinum Equity, stands as a global leader in data center cooling solutions. Offering precision cooling systems and thermal management solutions since its inception, Vertiv has garnered recognition for its innovative technologies and commitment to sustainability. Recent developments, especially in energy-efficient cooling systems, underscore its dedication to meeting evolving market needs. Vertiv's focus on innovation, reliability, and customer satisfaction has solidified its position as a top choice for organizations seeking cutting-edge cooling solutions for their critical digital infrastructure.
Other companies may partake in Data Center Cooling but Vertiv (VST) specializes in it. That's the big difference. It's not a side piece of the business to make additional $. That's what makes it special. That's why I mentioned there really isn't many companies that specialize in this critical area especially with the growth of data centers.
Technicals:
Positive Divergence
RSI at 36 and as of now crossing RSI-Based MA
Descending Wedge (breaking out as of 3/12)
Downside: A lot of resistance to break through as in it 's under ALL Moving Average's.
Overall NYSE:VRT continues to to increase every single quarter and is in a very strong market of data centers as these will continue to increase and need cooling. Institutions own 83.77%
VRT Snapshot
VRT Growth
Wedge
XAUUSD 1H Long Trade PlanXAUUSD 1H Long Trade Plan
Trading Instrument: XAUUSD (Gold)
Time Frame: 1 Hour
Trading Direction: Long
Entry & Key Levels
• Entry Price: Enter directly near current price 4756.240
• Stop Loss: 4726.000
• First Take Profit (TP1): 4800.000
• Second Take Profit (TP2): 4888.000
Position Management & Stop Loss Trailing Rules
1. When price reaches 4800.000, close half of the position, and move the stop loss of the remaining position to breakeven (trail stop to protect profit).
2. When price reaches 4888.000, close half of the remaining position again, and trail the stop loss higher to lock in more profits.
3. Let the final small position run freely, exit flexibly according to market trend.
Risk Disclosure
This trading plan is only for technical analysis reference, not investment advice. Strictly implement stop loss rules, control position size, trade rationally, and be responsible for your own trading results.
#PSGUSDT #3D (Binance) Falling wedge breakout [LONG]Paris Saint Germain Fan Token regained and retested 50MA support, looks bullish.
Bouncing back with strong volume, mid-term recovery towards 200MA resistance seems next.
⚡️⚡️ #PSG/USDT ⚡️⚡️
Exchanges: Binance
Signal Type: Regular
Amount: 4.6%
Current Price:
0.958
Entry Zone:
0.936 - 0.798
Take-Profit Targets:
1) 1.313
1) 1.649
1) 1.985
Stop Targets:
1) 0.494
Published By: @Zblaba
CRYPTOCAP:PSG BINANCE:PSGUSDT #3D #ParisSaintGermain #FanToken socios.com psg.fr
Risk/Reward= 1:1.2 | 1:2.1 | 1:3.0
Expected Profit= +51.4% | +90.2% | +129.0%
Possible Loss= -43.0%
Estimated Duration= 3-4 months
Catch The Falling Knife - Silver Analysis (4H)In my last Silver analysis, I explained the micro-moves, but the market has shifted in several ways since then.
Macro events will be especially important heading into May. I believe my initial analysis remains valid; this one is simply more detailed.
Here is the macro view:
It looks bearish as it forms the final wave of a triple zig-zag and appears ready to drop.
The target for this drop should be around $50.
Look for buy/long positions near that level.
Until then, stay short until you see a change of character on the 4-hour chart.
Skyress.
HYPE - Medium Term SHORTHype is falling out of a rising wedge, and has developed a head and shoulders at the top of its advance.
There is clear bearish divergence on the daily RSI.
I personally shorted in this current area.
Take profit 1: $32.50-30.00
Take profit 2: $27.00-$24.23
Take profit 3: $21.50-$18.50
Please always use a stop/loss, and of course this isn't financial advice : )
Thank you!
Tesla: Bullish Structure Still Intact After 30% PullbackTesla (TSLA) has experienced a sharp pullback of nearly 30% from recent highs, yet the internal structure of the decline does not currently appear impulsive. Instead, price action continues to resemble a corrective phase rather than the start of a sustained bearish trend.
The updated wave analysis points toward a potential seven-swing corrective structure, which is typical of complex consolidations within larger uptrends. This retracement is approaching the 50% to 61.8% Fibonacci zone measured from the April 2025 lows, an area that often acts as a high-probability support region in ongoing bullish cycles.
Price behavior around this zone is becoming increasingly important. Tesla has already shown signs of recovery, attempting to move out of a corrective channel, which suggests early confirmation that buyers are re-entering the market. This aligns with the idea that the “yellow box” support area is currently being respected.
From a broader perspective, there remains a possibility of another upward leg forming, potentially developing into wave C of wave five within an ending diagonal pattern visible on the weekly timeframe. This would still be consistent with a broader bullish structure, but would require confirmation through continued upside momentum.
However, risk remains on the downside. A decisive break below 260, especially if accompanied by accelerating selling pressure, would significantly weaken the bullish interpretation. In that scenario, it would suggest that the ending diagonal structure may already be complete, opening the door for a deeper correction toward 200, and in an extended bearish case, even toward 150.
Key Points:
-Current decline appears corrective rather than impulsive (likely a seven-swing structure)
-Price is reacting around the 50%–61.8% Fibonacci retracement zone
-Recovery from support suggests early bullish response within the correction
-Break above 390 would confirm continuation of the bullish rebound scenario
-Drop below 260 would shift bias bearish, targeting 200–150 range
Overall, Tesla is sitting in a critical decision zone where the next directional move could define whether this is a continuation of the broader uptrend or the beginning of a deeper corrective phase.
EURGBP: Strong Bearish Pattern 🇪🇺🇬🇧
EURGBP will likely drop lower after a confirmed breakout
of a support line of a symmetrical triangle pattern on an hourly time frame.
Goal - 0.8636
❤️Please, support my work with like, thank you!❤️
I am part of Trade Nation's Influencer program and receive a monthly fee for using their TradingView charts in my analysis.
GBP/USD Bullish Setup: Identifying the TM Liquidity Trap & SmartFundamental Context:
Earlier today, the UK Construction PMI data came in significantly weaker than expected (39.7 vs 45.8 forecast). While this aggressive contraction in the construction sector creates fundamental selling pressure on the British Pound, the underlying market structure and order flow suggest a different narrative.
4H Timeframe Analysis (Market Structure):
Currently, GBP/USD is printing a standard bullish candle (approx. 33 pips, fitting within the 80-120% range of the current 37 ATR). The price initiated its bullish momentum from a "Daily Phases 02" zone and successfully fractured the 4H Phase 02 level.
Looking at the broader context, the bullish "Spike & Base" structure from last Thursday remains entirely valid. Price retraced towards the Base Pole but failed to engulf it. Therefore, the bullish order flow is intact as long as the ascending green support trendline holds.
We are currently approaching the FTC (Failure To Continue) zone of a newly confirmed 4H pivot. Retail logic dictates shorting this supply zone, but here is why we maintain a bullish bias:
15M Timeframe Analysis (Trigger & Entry Logic):
Zooming into the 15M chart around the recent 4H pivot, we observe the formation of the right shoulder of a structural pattern. At first glance, the retail eye will classify this as a bearish Quasimodo (QM) pattern.
However, upon closer inspection, the lower boundary has clearly penetrated the origin of the left shoulder. In our CyberTrading methodology, this invalidates the QM and confirms a TM (Trick/Manipulation) pattern.
This TM pattern is essentially a bearish fakeout—a liquidity trap designed to induce early shorts and engineer the necessary sell-side liquidity (fuel) for the next impulsive leg up.
The Setup (Action Plan):
We are avoiding direct shorts at the current FTC. The high-probability setup is to wait for a bearish pullback from this FTC (the fakeout phase) to buy at a discount.
Target (TP): The primary liquidity draw is the Phase 01 zone, located between 1.36705 and 1.36946.
Invalidation Criteria (Risk Management):
This bullish scenario is completely invalidated if any of the following occur:
Price breaks and closes back below the 1.36009 level (Phase 02 breakdown).
Price reaches the red diagonal liquidity resistance and prints a valid bearish confirmation on the 15M or 1H timeframe.
Price pushes slightly above the red zone but fails to exceed the 8-pip engulfing threshold, confirming a fake breakout to the upside.
Note: Be highly mindful of the EUR/USD correlation today. Our current outlook on EUR/USD is bearish, and if GBP/USD triggers any of the invalidation criteria above, it will likely sync with the Euro's bearish order flow.
www.tradingview.com
Direction: Long
Timeframe: 4H / 15M
Methodology: Advanced Price Action / CyberTrading Structure
JASMY bullish falling wedgeJASMY/USDT: Major "Falling Wedge" Breakout Imminent? 📈
On the weekly (1W) chart, JASMY has been respecting a long-term downward trend, but we are reaching a critical pivot point. Here is the breakdown:
The Pattern: A clear "Falling Wedge" has formed over several months, which is historically a bullish reversal pattern.
The Breakout: Price is currently testing the upper resistance line. A confirmed weekly close above this level could trigger significant momentum.
Price Target: Based on the wedge height, the projected upside is approximately +157%, targeting the $0.015 zone.
Oscillators: Bottom indicators suggest that selling pressure is exhausting, supporting a potential trend shift.
🚀 Staying ahead of the market with XR INVEST.
EURUSD Short: Descending Channel Holds Strong, Eyes On 1.1680Hello traders! Here’s my technical outlook based on the current EURUSD (3H) chart structure. EURUSD previously traded below a descending supply line. After a breakout above this structure, price entered a short consolidation phase (range), but the upside momentum was limited.
Currently, EURUSD is trading below the 1.1770 supply zone, which acts as resistance, while moving lower within the descending channel. A recent fake breakout above resistance followed by a sharp rejection indicates strong selling interest.
As long as EURUSD remains below the 1.1770 resistance and respects the descending channel, the bearish scenario remains valid. A continuation to the downside could push price toward the 1.1680 demand zone (TP1). Manage your risk!
GOLD (XAUUSD): Bullish Continuation After Trap
I see a valid bearish trap after the last test of the key daily horizontal support.
The price formed the ascending triangle pattern on that and violated
its neckline then.
I expect a bullish movement to 4563 now.
❤️Please, support my work with like, thank you!❤️
I am part of Trade Nation's Influencer program and receive a monthly fee for using their TradingView charts in my analysis.
ONE POINT SOLUTIONS📚 Descending Wedge – Monthly Breakout Lesson
📊 Pattern Insight:
A Descending Wedge is a bullish reversal/continuation pattern.
It forms when price makes lower highs and lower lows, but the slope of the lows is less steep than the highs.
This compression signals weakening selling pressure.
🔑 Key Features in the Chart:
Points a–b–c–d–e outline the wedge structure.
Breakout arrow shows potential upside once price escapes the wedge.
Monthly timeframe adds weight — higher TF patterns carry stronger conviction.
💡 Trader’s Takeaway:
Before Breakout: Watch for volume contraction inside the wedge.
At Breakout: A surge in volume confirms strength.
After Breakout: Retest of wedge resistance as support often provides entry.
⚡️ Educational Insight:
Descending wedges are powerful because they combine trend exhaustion with accumulation. On higher timeframes like monthly charts, they often precede multi‑month rallies.
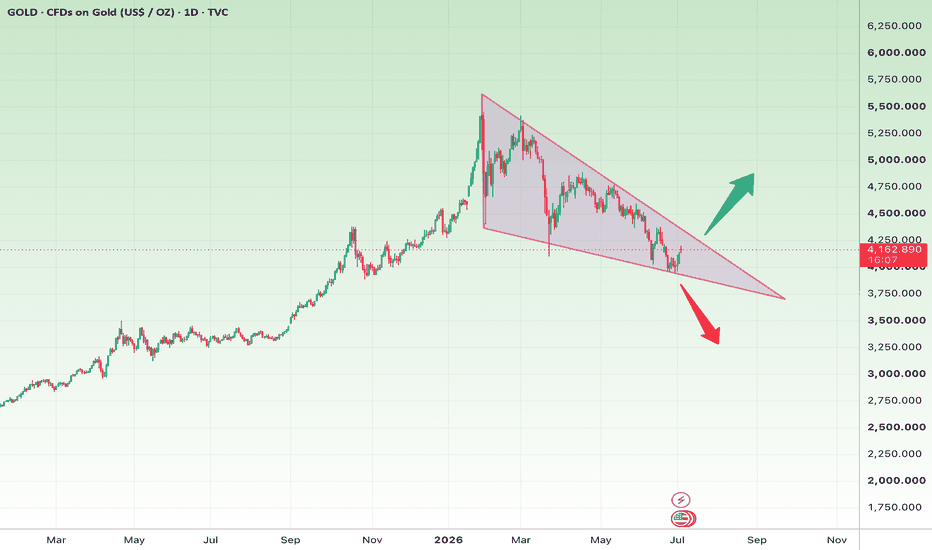
Gold’s Path to $4,400🏦 THE STRATEGY VAULT
Technical Checkpoint ✅
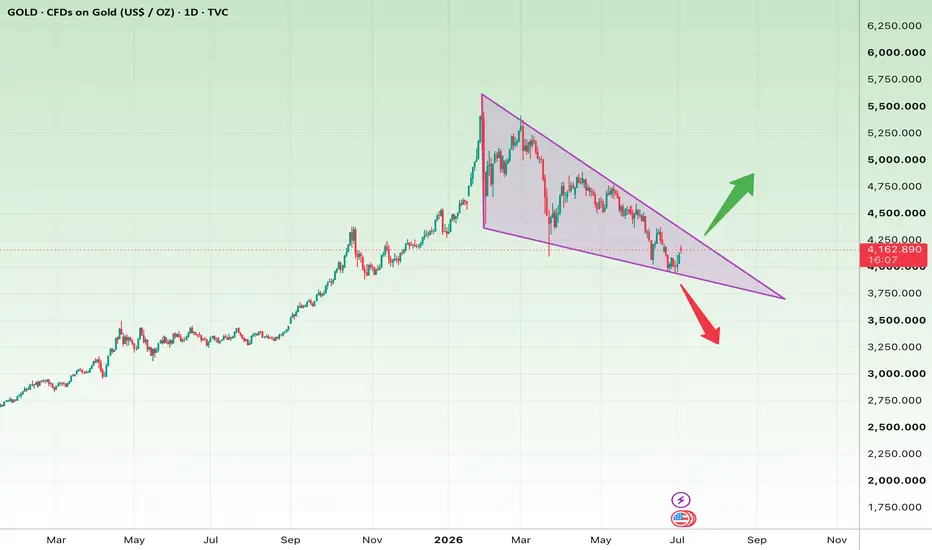
The Macro Structure: Gold is currently trapped in a large descending broadening formation. While the early 2026 parabolic run to $5,600 is a distant memory, the current price action confirms we are in a deep "Value Reset" phase.
The Triangle Break: Price recently sliced through a significant Triangle pattern floor. In technical terms, the bulls have officially lost the $4,700 handle as a base of operations.
The Supply Zone (Red Box): We are closely monitoring the $4,680 – $4,710 area. This is the "scene of the crime" where the triangle support flipped into a formidable resistance ceiling.
Momentum: The 8H candles show decreasing volume on relief rallies, suggesting that "Smart Money" is using every bounce to liquidate remaining long positions.
The Macro Overlay 🛰️
The fundamental backdrop has turned decidedly icy for bullion.
The Warsh Regime: With Kevin Warsh’s confirmation as Fed Chair imminent (expected May 15), the market is pricing in a "Regime Change." Warsh’s history of prioritizing a lean balance sheet and his critiques of pandemic-era overreach suggest a sustained high-rate environment.
FOMC Dissents: Last week's 8-4 hawkish hold was a wake-up call. Four dissents against an "easing bias" means the "Warsh Fed" will likely keep real yields elevated, making non-yielding assets like Gold less attractive.
Ceasefire Drag: The US-Iran ceasefire (extended into May) has successfully removed the "imminent explosion" premium. As long as Pakistani-mediated talks continue, the panic-buying that fueled the $5k+ prices remains absent.
The Playbook: Target $4,400 🎯
Following the purple projection on our chart, we are looking for a precision "Break-Retest-Reject" sequence:
The Entry (Sell Area): $4,680 – $4,710 (The Red Box). We want to see a bearish rejection candle (Pin Bar or Engulfing) on the 4H/8H timeframe here.
Primary Target: $4,400. This is the macro Support line and the high-volume liquidity floor established during the late 2025 accumulation phase.
The Safety Exit (Invalidation): A sustained daily close above $4,820 would shatter the descending resistance and suggest a neutral consolidation rather than a slide.
What's your strategy? Are you fading the $4,700 retest or waiting for a "black swan" to crack the $4,400 floor? Let’s talk in the comments! 👇
Quick Lesson: How to Trade Falling Wedge (Study & Benefit)Falling Wedge is one of the most common and recognisable chart pattern. However, many (and may be even most of) people trade it in a wrong way, which often results in taking losses. Knowing when to enter the market can make the difference between catching a clean breakout and getting trapped in a fake move . The chart above compares two similar wedge setups that look alike at first glance, but are built on completely different conditions.
On the left, we see a textbook example of a healthy bullish breakout through the falling wedge:
After a downtrend, the price begins to form a horizontal accumulation range, marking a bottom with it.
When the first round of accumulation is done, there is a bounce following, marking the first touch of the future resistance.
The second round of accumulation usually forms lower than the first one, allowing bulls to properly accumulate the asset at a favourable price.
When accumulation is done, bulls are processing a breakout of the wedge. What is important there is that the most of volumes are being absorbed on this move which allows the impulse to grow further.
In contrast, the right side shows a very similar pattern — a falling wedge forming after a downtrend, but with crucial differences.
The price touches the potential support, but bounces way too fast, not allowing traders to properly accumulate the asset.
After the pump, the accumulation phase starts forming near the future resistance. The core volumes are forming at the top of the pattern as well.
Big accumulations near the top of the patterns trigger the price to dump in order to hunt stop losses & liquidations which ruins the accumulation.
After the wedge breakout, people who accumulated at the top must sell their assets in BE or even at loss, because the accumulation phases were above the resistance breakout point.
As the result, fresh buyers face the high sell pressure on the breakout, which makes the impulse weak and fade in the end.
To sum up , a REAL FALLING WEDGE has its core volumes near the bottom - sign of a healthy accumulation phase, while a FAKE WEDGE has its core volumes near the top - sign of a manipulation made to trigger stop losses & liquidations.
Gold bounce fading, downside back in focusFor a metal that has behaved far more like something at the outer edge of the risk asset spectrum, it’s notable how heavy gold has traded lately in what’s been an otherwise risk-on environment. Having been rejected at $4660 resistance on the H4 timeframe late last week, mirroring the performance of other riskier asset classes that delivered notable bearish reversals, and now coiling in a structure that resembles a rising wedge, it suggests downside risks may once again be building.
I’m not rushing to put on any positions yet, especially with many parts of Asia on holidays on Monday and the price remaining within the middle of the wedge structure, but moves towards either trendline would provide setups to consider.
If we were to see a bounce and rejection at $4660, where a bearish pin formed late Friday, shorts could be considered with a tight stop above for protection, targeting $4600 initially where the price bounced from beneath earlier today and, beyond that, wedge support located currently around $4580. A sustained break of the wedge structure would put a potential retest of the April 29 low of $4510 on the cards, with horizontal support at $4560 located in between.
Alternatively, if we were to see a test and bounce from wedge support, it would also open the door for longs to be considered with a tight stop beneath for protection, targeting $4660 initially.
While downside momentum has all but diminished with RSI (14) and MACD now sitting at neutral levels on the H4 timeframe, it’s not like the bulls are in the ascendancy either, with both indicators flattening out in recent days. The overall message is to put more weight on price action when assessing setups rather than retaining a specific directional bias. Gold may be sitting in something resembling a bearish structure, but until the price action confirms, both short and long setups remain in play.
Good luck!
DS