US30 1H: Trapping the Channel Buyers (Bearish Breakdown Setup)1. Market Context
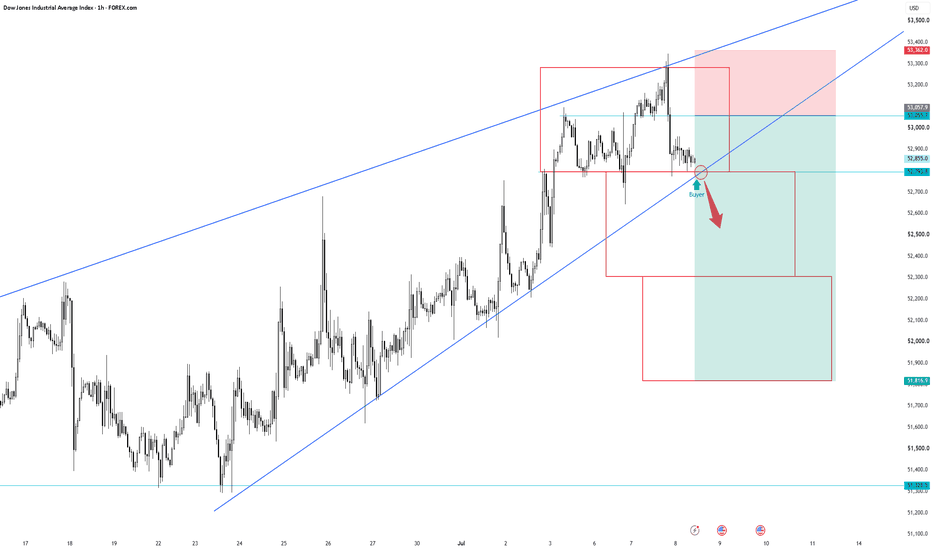
On the 1H chart, US30 is trading within a well-defined ascending parallel channel. After a sharp rejection from the channel's upper boundary around 53,279.9, the price collapsed rapidly and is currently consolidating right above the critical ascending trendline support and local horizontal level at 52,793.7.
2. Sentiment & Price Trap Analysis
• The Retail Buyer Trap: Retail traders are aggressively opening long positions at the touch of the ascending trendline support (marked "Buyer"), expecting a typical bullish bounce back toward the upper channel limit. This heavy retail buying behavior has clustered a massive pool of sell-stop liquidity (stop losses) directly beneath the 52,793.7 support floor.
• The Breakdown Trigger: Institutional algorithms are likely keeping the price suspended temporarily to induce more retail buyers into the trap. Once the accumulation of long positions is complete, a decisive break below the 52,793.7 support will trigger a domino effect of stop-loss market orders (selling pressure).
• The Downward Expansion: The forced liquidation of trapped buyers will rapidly accelerate the downward momentum, driving the market straight into the deeper liquidity pools and structural support zones at 52,307.5 and 51,821.3.
3. Trade Setup
We target a high-probability short entry on the confirmed breakdown of the trendline support to capitalize on the trapped buyers' liquidation momentum.
• Entry: 52,793.7 (Selling the confirmed breakdown of the trendline and local support)
• Stop Loss (SL): 53,279.9 (Placed safely above the recent swing high/consolidation top)
• Take Profit 1 (TP1): 52,307.5 (First major horizontal support zone)
• Take Profit 2 (TP2): 51,821.3 (Ultimate target / lower structural expansion level)
• Risk-to-Reward Ratio (R:R): Approx 2:1 (Calculated based on TP2)
Wedge
$TTD: Falling Wedge + Higher-Timeframe RSI Bullish DivergenceNASDAQ:TTD is showing a technical setup worth watching as price continues to compress inside a falling wedge structure.
The key signal here is not just the wedge itself, but the momentum behavior underneath price. RSI is showing bullish divergence across multiple higher timeframes:
Weekly RSI bullish divergence
2-week RSI bullish divergence
3-week RSI bullish divergence
This suggests downside momentum may be weakening while price continues to trade near the lower end of the structure.
From a technical perspective, falling wedges can become important reversal structures when price begins to tighten, volatility compresses, and momentum starts improving before price confirms the move.
For confirmation, I would want to see:
A clean breakout above wedge resistance
Improving volume on the breakout
RSI continuation higher
Price reclaiming prior resistance levels
Until then, this remains a watchlist setup, not a confirmed reversal.
Invalidation would be a sustained loss of wedge support with RSI failing to improve.
Overall, NASDAQ:TTD is setting up as a higher-timeframe bullish divergence watch. The chart still needs confirmation, but the structure and momentum are worth monitoring closely.
This is not financial advice. This is my personal technical analysis and trading plan for educational discussion.
$PENGUUSDT Falling WedgePENGUUSDT is trading on the 1D timeframe and is currently compressing inside a falling wedge pattern. The structure is defined by descending resistance and support trendlines, with price approaching the apex where a directional move may develop.
The current price is trading around 0.0066 USDT. The lower boundary of the wedge and the nearby 0.0049 USDT area act as key support, while the upper descending trendline represents the primary resistance zone.
A breakout above the wedge resistance would provide the initial confirmation that bullish momentum may be returning. If that breakout is confirmed, the chart projects a potential move toward 0.011655 USDT, which is approximately 78% above the current price zone.
If price fails to break the upper trendline and instead falls below the wedge support, the bullish setup would be invalidated and further downside could be considered. As always, watch for confirmation before interpreting the pattern.
This analysis is based solely on the visible chart structure and is intended for educational purposes.
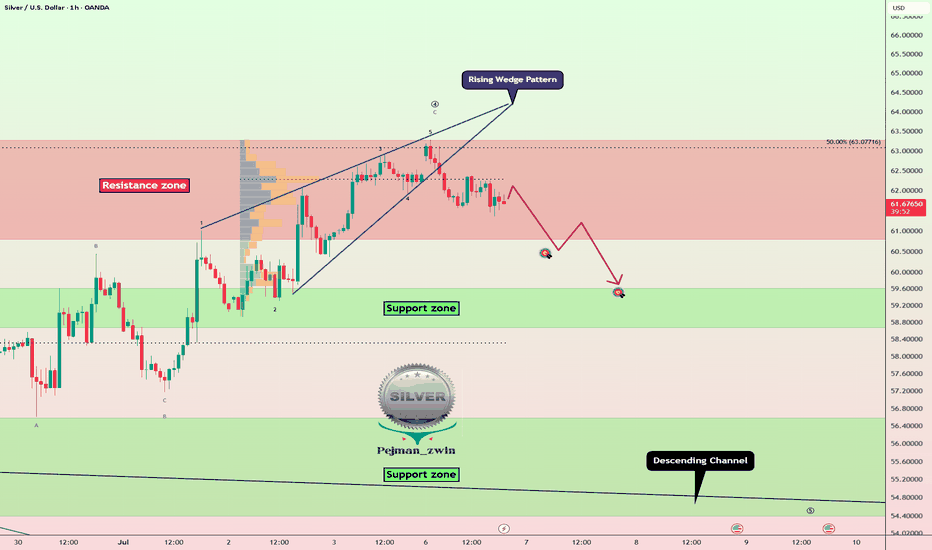
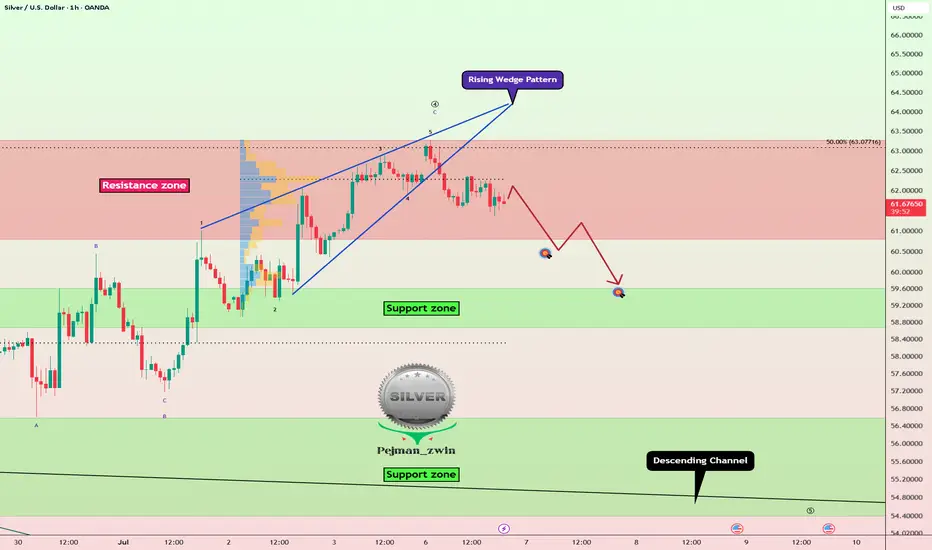
Silver Breaks Rising Wedge — Is a Drop Below $60 Next?Silver ( OANDA:XAGUSD ) is currently trading at the resistance zone($63.27-$60.80).
From a classic technical analysis perspective, it seems that Silver has broken below the lower line of a rising wedge pattern. This break could indicate a reversal from the bullish trend of last week.
From an Elliott Wave perspective, Silver appears to have completed its main wave 4 through a Zigzag correction(ABC/5-3-5).
I expect Silver to continue its downward move in the coming hours, potentially falling at least toward the $59.80–$60 range.
First Target: $60.33
Second Target: $59.74
Stop Loss(SL): $63.42(Worst)
Points may shift as the market evolves
What’s your view on Silver? Will it drop back below $60, or not?
💡 Please respect each other's opinions and express agreement or disagreement politely.
📌 Silver/ U.S. Dollar Analyze (XAGUSD), 1-hour time frame.
🛑 Always set a Stop Loss(SL) for every position you open.
✅ This is just my idea; I’d love to see your thoughts too!
🔥 If you find it helpful, please BOOST this post and share it with your friends.
CAD/CHF Technical Analysis (30-Minute Timeframe)The CAD/CHF chart is showing an improving bullish outlook after two strong technical signals appeared simultaneously: a Bullish RSI Divergence and a Falling Wedge breakout.
The bullish divergence suggests that although price was making lower lows, the RSI was forming higher lows, indicating that bearish momentum was fading and buyers were gradually stepping in. This type of divergence often precedes a trend reversal.
Adding further confirmation, price has broken above the upper trendline of the Falling Wedge, a classic bullish reversal pattern. This breakout signals that sellers are losing control and increases the probability of a continuation to the upside.
📈 Bullish Scenario
Price has successfully broken out of the Falling Wedge.
A sustained move above the 0.56646 Buy Stop level would confirm bullish continuation.
Target 1 (Resistance-1): 0.56803
Target 2 (Resistance-2): 0.56914
🎯 Trading Plan
✅ Entry Option 1: Place a Buy Stop above 0.56646 to enter only after confirmation of bullish momentum.
✅ Entry Option 2: If price pulls back after the breakout and prints a bullish confirmation candle, it may provide a lower-risk buying opportunity.
🛑 Stop Loss: Below the recent swing low and the Falling Wedge support trendline.
⚠️ Risk Scenario
If price fails to hold above the breakout level and falls back inside the Falling Wedge, it would indicate a false breakout, increasing the probability of another move lower. Traders should wait for confirmation and manage risk accordingly.
"Bullish divergence reveals weakening sellers. A Falling Wedge breakout confirms that buyers are beginning to take control. Trade the confirmation—not the anticipation."
Disclaimer: This analysis is for educational purposes only and should not be considered financial advice. Always use proper risk management and wait for price confirmation before entering a trade.
Do you agree with this analysis, or do you see the market differently? Let me know in the comments! If you found this idea valuable, your support through likes and comments is greatly appreciated.
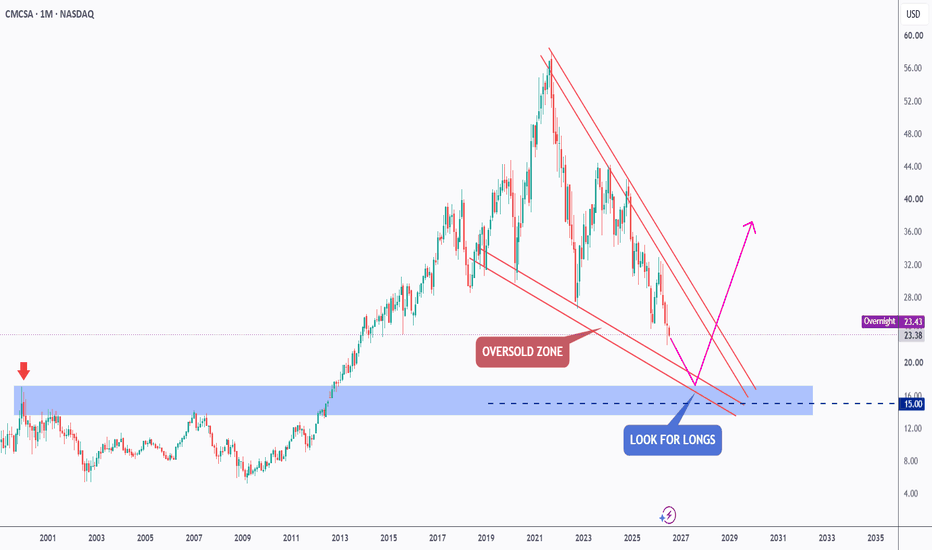
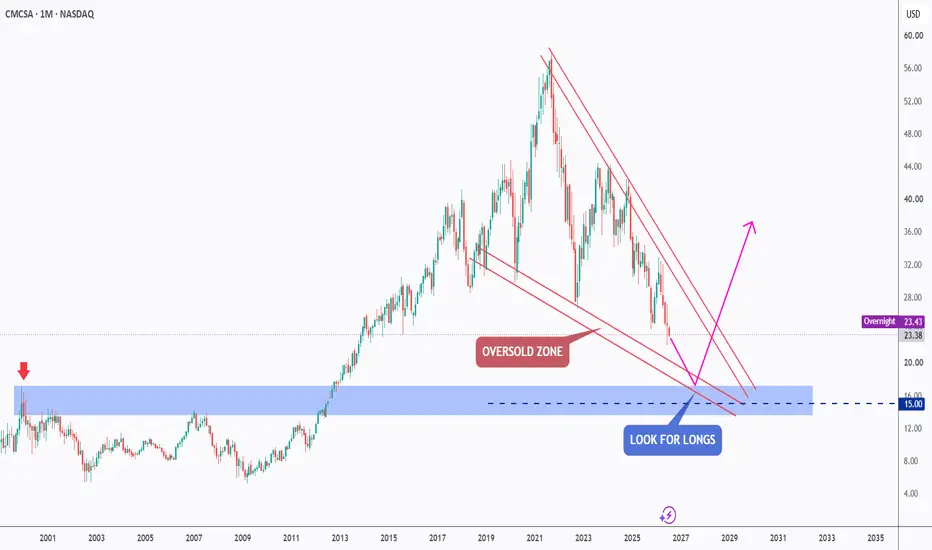
CMCSA - Approaching a High-Confluence Oversold ZoneCMCSA has been trending lower within a falling wedge pattern, bringing price closer to a major area of long-term support. 📉
Price is now approaching a high-confluence oversold zone, formed by the intersection of:
• The previous major high marked in blue.
• The $15 round number.
• The lower bound of the falling wedge pattern.
📌 As CMCSA approaches this confluence, we will consider it an oversold zone and will be looking for long setups, targeting the upper bound of the falling wedge as the first objective during the expected correction phase.
As always, rather than buying blindly into support, we will wait for bullish confirmation before considering any long positions.
Will buyers step in at this key confluence and trigger a corrective rally? 🤔
⚠️ Disclaimer: This is not financial advice. Always do your own research and manage risk properly.
📚 Stick to your trading plan regarding entries, risk, and management.
Good luck! 🍀
All Strategies Are Good; If Managed Properly!
~Richard Nasr
Gold. 3888USD Perounce? China Gonna Control XAUUSD? 6/July/2026XAUUSD. China going to launch its Gold Clearing System this week.. So What this "moves" will affect China and Overall world Gold market? This push by Hong Kong and Beijing is a structural shake-up for the precious metals world. For nearly two centuries, Western markets (specifically London and New York) have controlled how global gold is traded, cleared, and priced.
This move directly targets that dominance, fundamentally shifting the gold market's "center of gravity" from West to East while boosting China's financial autonomy....
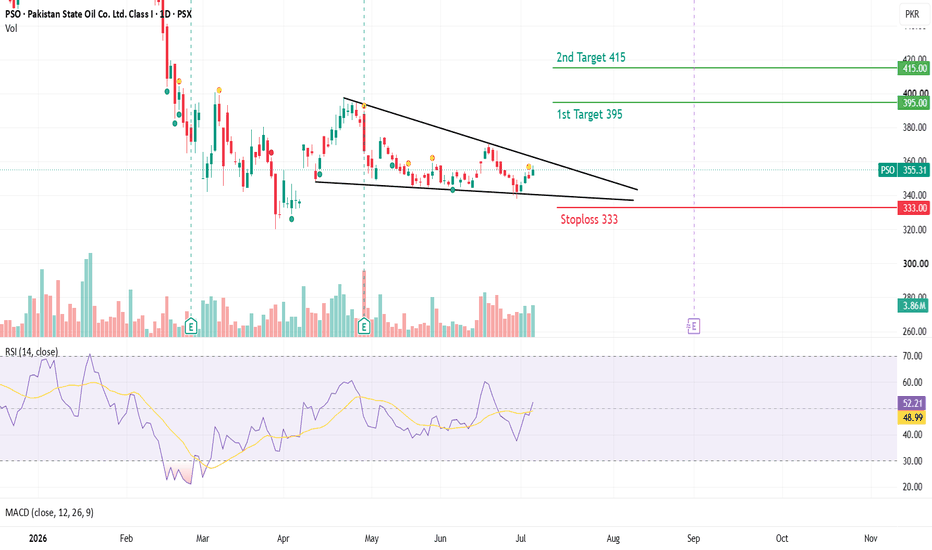
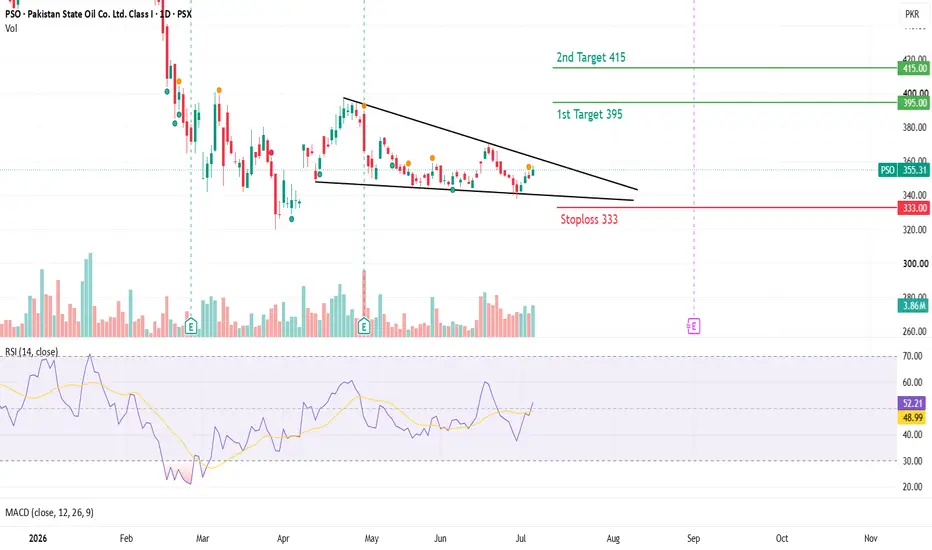
PSO on a wedgePSO (Pakistan State Oil) – Bullish Falling Wedge Breakout
Technical Setup:
PSO has broken out of a classic Daily Falling Wedge pattern. The breakout is confirmed by expanding volume, an RSI hook above 50, and a fresh bullish MACD crossover at the zero line.
Execution Parameters:
Strategy: Buy / Accumulate
Current Market Price: 355.31 PKR
Buy Range: 345.00 to 355.00 PKR
Stop Loss: 333.00 PKR (Daily Closing Basis)
Risk Per Share: 22.31 PKR (6.28% risk)
Targets:
Target 1: 395.00 PKR | Upside: 11.17% | R:R Ratio: 1 : 1.78
Target 2: 415.00 PKR | Upside: 16.80% | R:R Ratio: 1 : 2.68
Manage your risk carefully and follow position-sizing rules.
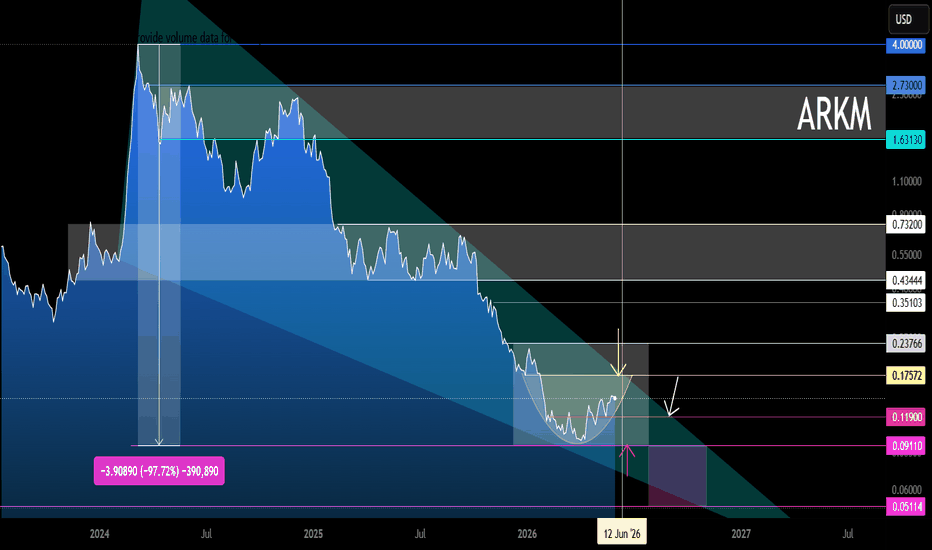
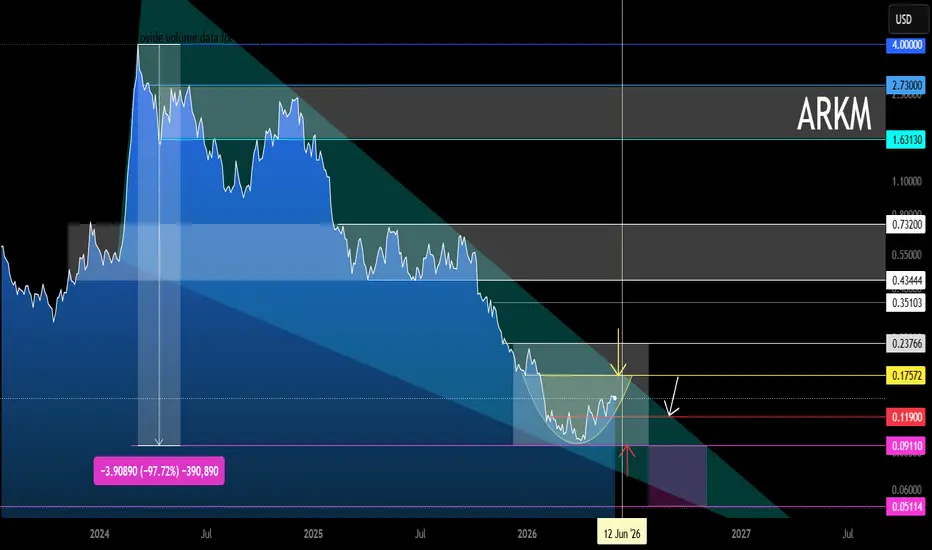
ARKM Main Trend. Wedge. Cup. Squeeze. 01/06/2026Logarithm. 3-day time frame. A descending wedge has formed in the main trend.
1️⃣🟢 A cup has formed in the local trend, pushing toward wedge resistance. There could be a impulse pump , driven by some fictitious positive news. It would be rational to use trigger orders for a breakout , and diversified limit orders if the breakout is false.
There could be a pullback from wedge resistance (not a breakout of the downtrend line):
2️⃣🔴 toward the support zone, and a horizontal channel could form;
3️⃣🔴 or an extremely negative scenario – entering the final zone of the descending wedge closer to August-September (optional), if there is no breakout and support from previous lows is broken.
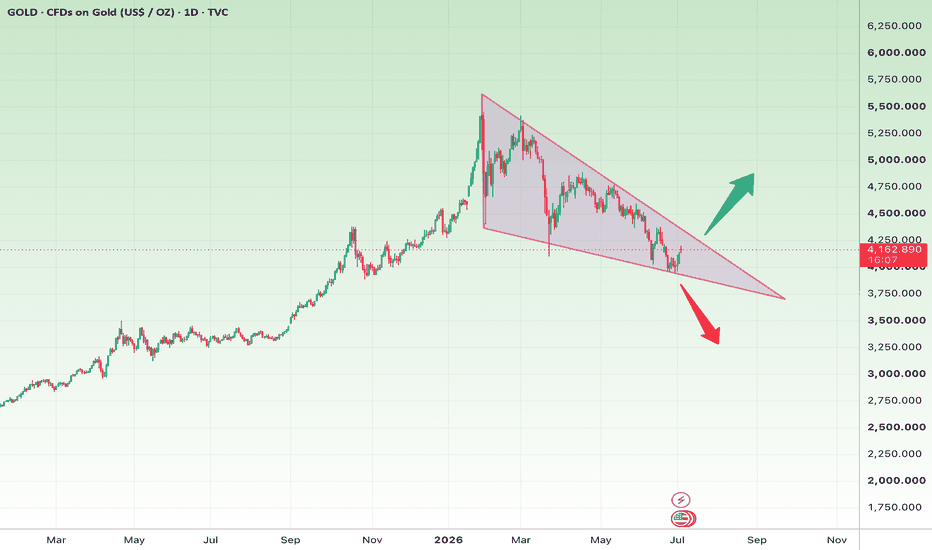
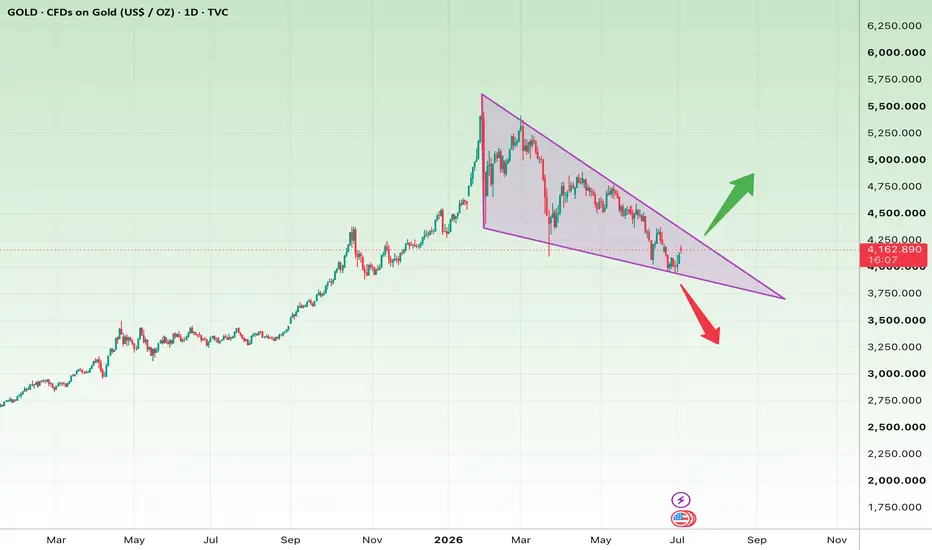
GOLD (XAU/USD) | 1D
🟢 Bullish Scenario
Price is testing the lower boundary of a falling wedge.
Holding this support and breaking the upper trendline could lead to:
4400
4700
5000
🔴 Bearish Scenario
A daily close below the wedge support invalidates the setup.
Downside targets:
3900
3700
3400–3300
Key Levels
Bullish Confirmation: Daily close above 4300
Bearish Confirmation: Daily close below 3900
Probability
🟢 Bullish: 60%
🔴 Bearish: 40%
Verdict
Gold is at a critical support. The higher-probability scenario remains a bullish rebound as long as the wedge support holds; a confirmed breakdown would shift the outlook bearish.
AUDCAD: Strong Bullish Setup 🇦🇺🇨🇦
There is a high probability that AUDCAD will continue rising
after a retest of a recently broken structure.
A bullish breakout of a resistance line of a flag indicates
a strong buying pressure.
Expect a price rise to 0.986
❤️Please, support my work with like, thank you!❤️
I am part of Trade Nation's Influencer program and receive a monthly fee for using their TradingView charts in my analysis.
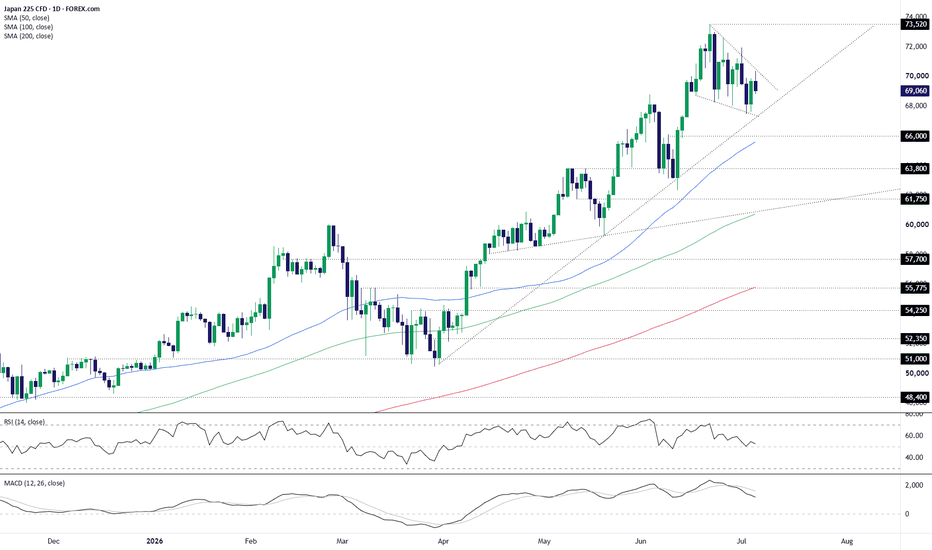
Nikkei 225 wedge points to breakout riskOur Nikkei 225 contract is coiling within what resembles a falling wedge pattern, raising the prospect of an eventual bullish breakout and retest of the record high. That would fit with the broader technical picture, with the price in a strong uptrend while continuing to hold above the key medium and longer-term moving averages, all of which have a positive slope.
Of course, that's no guarantee we'll see a breakout, but traders should be alert to the risk. A sustained move above wedge resistance, preferably on a closing basis, would allow for longs to be set with a tight stop below the breakout level, targeting the record high at 73,520. 72,000 is a level of note in between, marking the swing high set on July 1.
The oscillators are more neutral than bullish or bearish. RSI (14) has posted a series of lower highs but remains marginally above the neutral 50 level. MACD has crossed the signal line from above but continues to hold in positive territory. It’s more a cautionary message for bulls than a green light for bears. As such, for now, I'd place more emphasis on price action.
Good luck!
DS
Gold Weekly Chart: The Most Important Level to Watch Right NowOn the weekly chart, price is once again testing the rising trendline that has supported every major pullback since October 2023. Each previous visit to this level attracted aggressive buyers and led to another leg up, making this one of the most important technical levels on the chart.
Since peaking in March 2026, Gold has been correcting inside a falling wedge. While this pattern often appears after downtrends, it can also develop as a continuation pattern within a larger uptrend. In this case, the broader trend remains bullish, making a breakout from the wedge a potential signal that the primary uptrend is ready to resume.
The last two weekly candles formed a “Double Tweezer Bottom”, a classic reversal pattern that suggests sellers are struggling to push price lower and buyers are beginning to defend this support zone.
That said, the macro picture is far from one-sided.
Higher Treasury yields, a stronger U.S. dollar, and investors rotating into technology stocks have weighed heavily on Gold, contributing to its weakest quarterly performance since 2013. Meanwhile, analysts at JPMorgan describe Gold as sitting in technical no-man's land, with markets caught between two competing narratives.
The next major move will likely depend on which macro scenario plays out first:
🟢 Bullish: The Fed pivots toward rate cuts, the U.S. dollar weakens, and lower yields revive demand for Gold.
🔴 Bearish: Inflation remains stubborn, forcing the Fed to keep rates higher for longer or even hike again, supporting the dollar and putting additional pressure on Gold.
If buyers can defend this long-term trendline and price breaks out of the falling wedge, Gold could be setting up for the next leg higher. But if this support finally gives way after holding for nearly three years, it would mark a significant technical shift and could open the door to a much deeper correction.
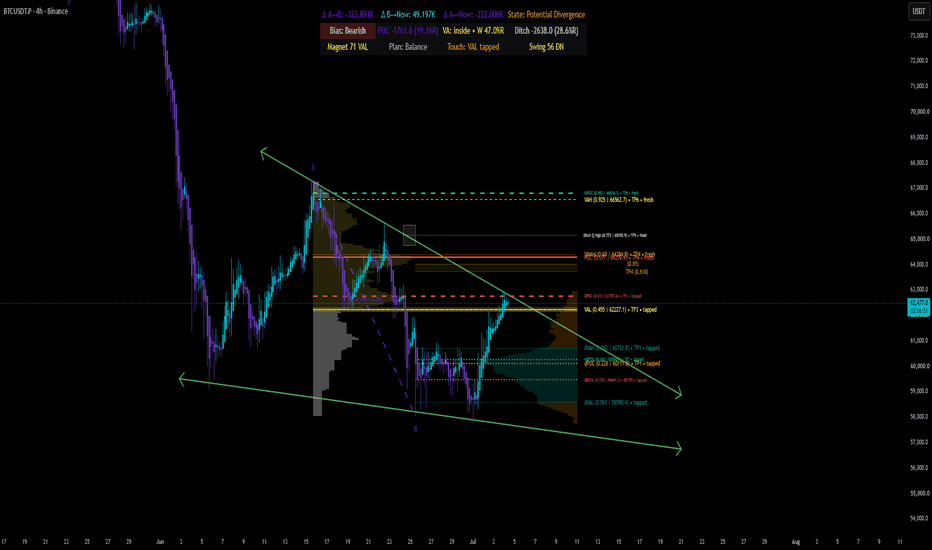
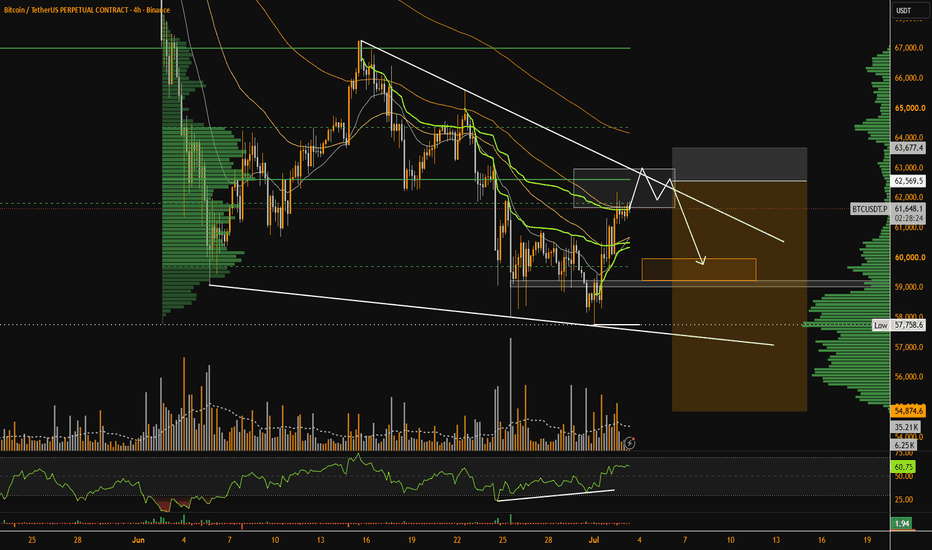
Back to the Value.BTC 4H: Back Inside Value, But Still Fighting Falling Wedge Resistance
BTC has managed to reclaim the value area after tapping the VAL zone around 62.2k.
That is constructive, but not enough by itself.
Price is now testing an important confluence:
Back inside VA
VAL reclaimed around 62.2k
Falling wedge resistance directly above price
Current price near the 62.4k area
This makes the next few 4H closes important.
The market is no longer in a simple breakdown structure, but it has not confirmed a clean breakout yet.
Scenario 1: Bullish Acceptance Back Inside Value
The bullish scenario requires BTC to hold above the VAL and start closing above the falling wedge resistance.
If buyers can confirm acceptance back inside the value area, the next upside magnet is the higher-volume zone around 64.2k-64.5k.
That area lines up with previous value/POC resistance and is likely the first important reaction zone.
If BTC accepts above that region, the next upside targets are around 65.1k and then the upper value area near 66.5k.
In simple terms:
Hold above 62.2k VAL
Break and close above falling wedge resistance
Target 64.2k-64.5k first
Above that, watch 65.1k and 66.5k
This would suggest that the move back into value is not just a short squeeze, but a real acceptance move.
Scenario 2: Rejection From Wedge Resistance
The bearish scenario is a rejection from the falling wedge resistance followed by a loss of the VAL.
If BTC fails to close above the wedge and starts closing back below 62.2k, the reclaim loses strength.
That would turn the move back into value into a failed acceptance.
In that case, price can rotate back toward the lower liquidity and volume zones.
The main downside areas I would watch are:
60.7k
60.0k
59.4k
58.6k
A clean loss of VAL would put sellers back in control and increase the probability of another sweep toward the lower part of the structure.
Key Level
For me, the key zone is 62.2k-62.5k.
As long as BTC holds above this area and keeps building acceptance inside VA, the bullish scenario remains alive.
If price loses this zone and rejects the wedge, the setup shifts back toward a bearish rotation.
Final Thought
BTC is at a decision point.
Reclaiming value is positive.
But the falling wedge resistance still needs to be broken.
The next move depends on whether BTC confirms acceptance above this resistance, or fails and rotates back below VAL.
This is not a prediction.
It is a trigger-based plan.
First real test of resistance after the bounce for $BTC
→ First real strength showing — first meaningful retracement of the downtrend after wiping out longs down to $57.7k
→ BTC has now taken most of the shorts (some still remain directly above)
→ Facing first strong resistance right here: 1D 21 EMA, POC of the range, Golden Pocket from last swing high + upper trendline of the potential falling wedge
→ For me, especially after the shorts got liquidated, this is a solid shorting opportunity (not guaranteed, but worth a try given the trend)
→ Of course we can rally higher from here, but sentiment can flip fast. We’ve also formed big imbalances below + lots of high-leverage longs piled in recently
→ Range POC + Golden Pocket feels like a good shorting spot for now. If we go higher, I’ll look for the next short at key levels
→ As long as people keep longing aggressively, I don’t think the macro bottom is in. No final capitulation yet
→ Cycle theory also supports more downside and a longer bear market. Zoom out: HTF structure still super bearish and missive resistance above
→ Extended weekend ahead — we’ll see how BTC moves once liquidity returns
Selena | XAUUSD 1H – Bullish Recovery from Demand Zone PEPPERSTONE:XAUUSD FOREXCOM:XAUUSD "
Gold is showing signs of a bullish recovery after respecting a major demand zone and the lower boundary of the descending channel. Price is attempting to reclaim short-term resistance, and a successful breakout could trigger stronger upside momentum. As long as buyers defend the current support, the overall bias remains bullish toward higher resistance levels.
🎯 Bullish Targets:
TP1: 4,170
TP2: 4,250
TP3: 4,350
📌 Invalidation: A sustained break below the demand zone would weaken the bullish outlook.
Educational purposes only. Not financial advice.
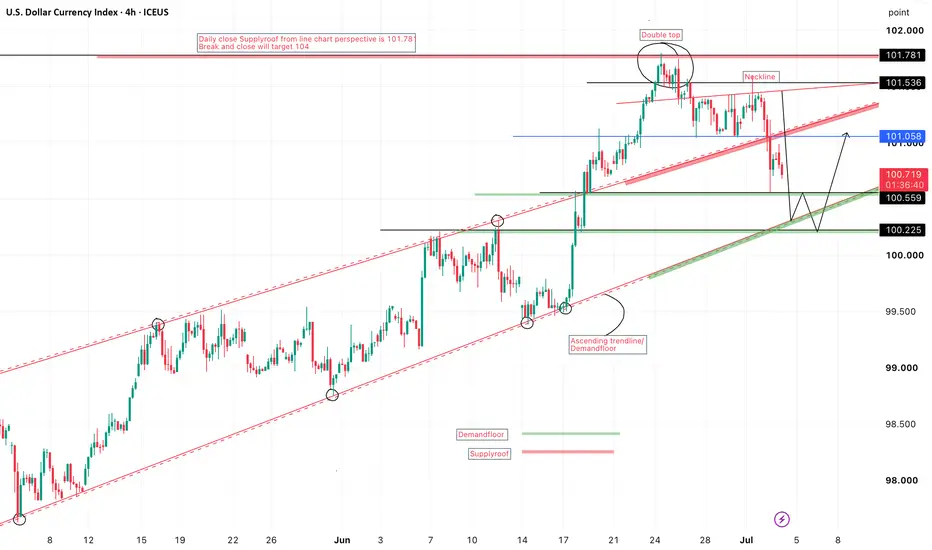
DOLLAR INDEXDollar What is DXY?
The DXY (or USDX) measures the value of the US Dollar (USD) against a weighted basket of six major currencies:
• Euro (EUR) ~57.6%
• Japanese Yen (JPY) ~13.6%
• British Pound (GBP) ~11.9%
• Canadian Dollar (CAD) ~9.1%
• Swedish Krona (SEK) ~4.2%
• Swiss Franc (CHF) ~3.6%
A rising DXY = stronger USD. A falling DXY = weaker USD. Current levels are around 100.8–101 (as of early July 2026). 
How DXY Affects Gold (XAU/USD)
Gold and DXY have a strong negative (inverse) correlation — typically between -0.5 and -0.8 historically. 
• Stronger USD (↑ DXY) → Lower gold prices: Gold is priced in USD. A stronger dollar makes gold more expensive for buyers using other currencies, reducing demand and pressuring prices down.
• Weaker USD (↓ DXY) → Higher gold prices: Gold becomes cheaper for international buyers, boosting demand. Gold also acts as a hedge against dollar weakness.
Exceptions: During extreme crises (e.g., major geopolitical events or simultaneous safe-haven flows), both can sometimes rise together temporarily. 
How DXY Affects Other Currency Pairs (“Other Pairs”)
Since DXY tracks the USD’s strength, it has a direct impact on most USD-based forex pairs:
• Negative correlation pairs (DXY up → pair down):
• EUR/USD: Heavily weighted in DXY — strong inverse link.
• GBP/USD, AUD/USD, NZD/USD, etc. (commodity currencies often move with risk sentiment too).
• Positive correlation pairs (DXY up → pair up):
• USD/JPY, USD/CHF, USD/CAD (these strengthen when USD does).
Practical trading tip: If DXY is breaking higher, expect downward pressure on EUR/USD, GBP/USD, and gold.
#DXY
$TONUSDT Falling WedgeTONUSDT Perpetual Contract is currently trading on the 12H timeframe and is consolidating within a falling wedge, which is also positioned inside a larger descending structure visible on the chart.
The current price is trading around 1.57 USDT, where price continues to compress near the upper boundary of the smaller wedge. This area may become important as volatility contracts.
Key Levels
Support: ~1.50–1.55 USDT
Resistance: ~1.85 USDT (highlighted confirmation zone)
Higher descending resistance remains near the upper boundary of the larger wedge.
A confirmed breakout above approximately 1.85 USDT could indicate that buyers are gaining momentum. If this breakout is sustained, the chart projects a move toward approximately 2.50 USDT, representing an upside potential of roughly 35% from the confirmation level (or about 59% from the current price zone).
If price fails to hold the wedge support and breaks below the lower boundary, the bullish setup may become invalid, and further downside could remain possible. Watching for a confirmed breakout before considering the projected target is important.
This analysis is based solely on the chart structure shown and is intended for educational purposes rather than financial advice.