OPEN-SOURCE SCRIPT
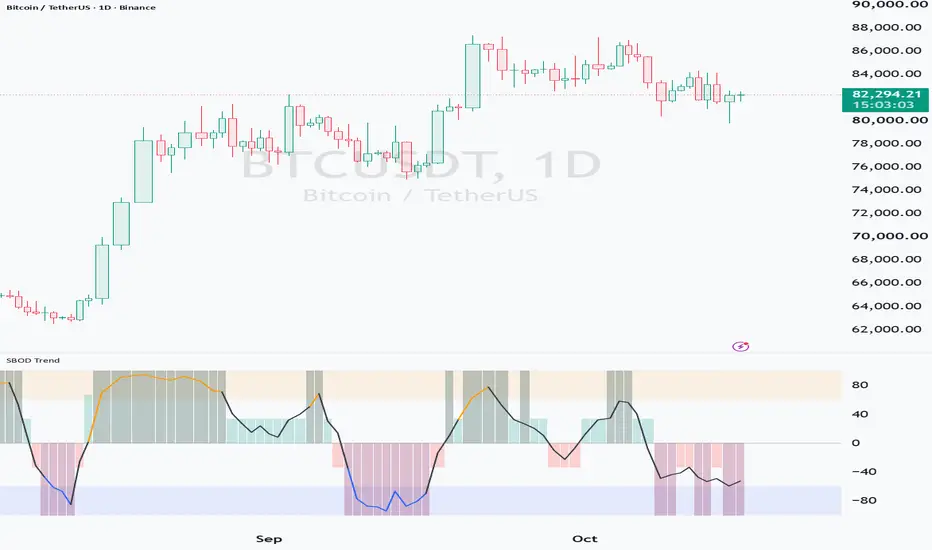
SBOD Trend by readCrypto
WHY A NEW VERSION
The original SBOD ("OBV by readCrypto") shows BSSC, OBV and StochRSI as separate plots in one pane. Each is useful on its own, but reading them together has limits:
- The three often disagree, and the chart does not tell you which one to follow.
- Some readings depend on direction (rising / falling), so they flip on small moves and make it hard to tell a trend from noise.
- Overbought / oversold can only be judged on StochRSI, which reflects price momentum alone and ignores volume flow.
SBOD Trend keeps the same three calculations and combines them into one reading: is the market in an uptrend or a downtrend, how strong is it, and is it stretched far enough that a reversal becomes more likely.
WHAT IT CALCULATES
The three components use the same formulas as the original SBOD:
- BSSC: a combined score of MFI, Accumulation/Distribution and Williams %R (-6 to +6)
- OBV: On-Balance Volume based on OHLC4, compared with its EMA(18) and its 18-bar high-low band
- StochRSI: RSI(14) of OHLC4 -> Stochastic(7) -> K(3), D(3) -> (K + D) / 2
1. Trend histogram
Each component casts one vote. The votes are based on position, not direction, so short pullbacks do not flip them:
- BSSC: score above 0 = up, below 0 = down
- OBV: above its EMA(18) = up, below = down
- StochRSI: above 50 = up, below 50 = down
The sum of the votes is shown as columns:
- +3 (dark green): strong uptrend, all three agree
- +1 (light green): uptrend, two of three agree
- -1 (light red): downtrend, two of three agree
- -3 (dark red): strong downtrend, all three agree
2. Strength line (-100 to +100)
Each component is scaled to the same -1 to +1 range and the three are averaged:
- BSSC / 50
- OBV position inside its 18-bar high-low band
- (StochRSI - 50) / 50
The histogram shows the side of the trend; the strength line shows how much force is behind it.
3. Overbought / oversold zones
Similar to the 80 / 20 levels of StochRSI, but measured on the combined strength line, so price momentum and volume flow must both be extended before a zone is reached.
- Overbought: strength at or above +60 (orange zone, the line turns orange)
- Oversold: strength at or below -60 (blue zone, the line turns blue)
HOW TO READ IT
- Trend: follow the histogram color. Dark colors mean all three components agree.
- Momentum: watch the strength line within the trend. A rising line means the trend is strengthening; a falling line while the histogram keeps its color means it is losing force.
- Exhaustion: when the strength line reaches the orange zone in an uptrend and then turns down, the move may be ending. The same applies to a downtrend in the blue zone.
- Trend change: a change of trend is confirmed when the histogram itself changes from green to red, or from red to green.
In strong trends the strength line can stay inside a zone for a long time. A zone is a warning to watch for a reversal, not a signal on its own.
SETTINGS
- Volume source: Auto uses real volume when the symbol has it, and the high-low range for symbols without volume (such as indices). Real volume or Range can also be selected.
- Show strength line: on / off
- Overbought / Oversold levels: default +60 / -60
NOTES
- All values are calculated on the chart timeframe.
- On symbols without volume, the OBV, MFI and A/D components use the high-low range as a substitute, so the reading is an approximation.
- The histogram and strength line of the current bar can change until the bar closes.
- This indicator is a tool for chart analysis and is not financial advice.
Script de código aberto
Em verdadeiro espírito do TradingView, o criador deste script o tornou de código aberto, para que os traders possam revisar e verificar sua funcionalidade. Parabéns ao autor! Embora você possa usá-lo gratuitamente, lembre-se de que a republicação do código está sujeita às nossas Regras da Casa.

[Practical trading strategy using HA-MS and SBOD]
youtu.be/aceN1AttX1Y
youtu.be/aceN1AttX1Y
Aviso legal
As informações e publicações não se destinam a ser, e não constituem, conselhos ou recomendações financeiras, de investimento, comerciais ou de outro tipo fornecidos ou endossados pela TradingView. Leia mais nos Termos de Uso.
Script de código aberto
Em verdadeiro espírito do TradingView, o criador deste script o tornou de código aberto, para que os traders possam revisar e verificar sua funcionalidade. Parabéns ao autor! Embora você possa usá-lo gratuitamente, lembre-se de que a republicação do código está sujeita às nossas Regras da Casa.
[Practical trading strategy using HA-MS and SBOD]
youtu.be/aceN1AttX1Y
youtu.be/aceN1AttX1Y
Aviso legal
As informações e publicações não se destinam a ser, e não constituem, conselhos ou recomendações financeiras, de investimento, comerciais ou de outro tipo fornecidos ou endossados pela TradingView. Leia mais nos Termos de Uso.