WaveRider Divergence Oscillator
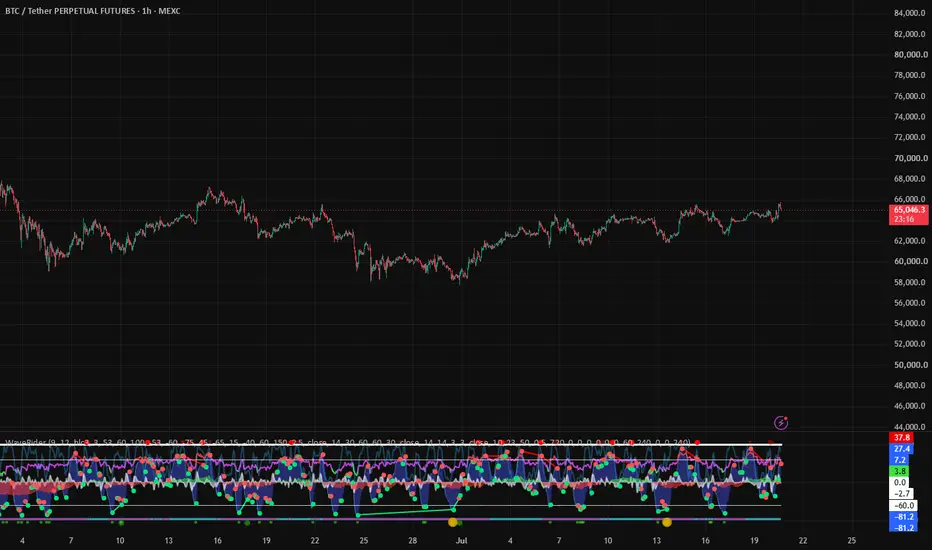
WaveRider is a momentum oscillator that combines the RSI with its moving average to reveal the underlying market “wave.” It detects bullish and bearish divergences, highlights overbought and oversold extremes, and generates signals based on level crossings and zero-line crossings. It is suitable for cryptocurrencies, indices, forex, and stocks.
Indicator Features
PulseWave Oscillator — RSI − SMA(RSI)
Measures the difference between the RSI and its moving average to capture the true acceleration and deceleration of momentum.
Robust Divergences — No Repainting After Confirmation
Divergences are based on confirmed pivots using ta.pivothigh() and ta.pivotlow(). Bullish and bearish labels appear only after the pivot has been validated.
OB/OS Extreme Zones
Customizable levels, set to ±12 by default, help identify bullish and bearish momentum extremes.
Ready-to-Use Signals
OB/OS: A signal is generated when the oscillator crosses back through an extreme level.
Zero Line: A signal is generated when the oscillator crosses zero, indicating a possible momentum regime change.
Clean Visual Design
Includes gradients, progressive fills toward the zero line, and distinct bullish and bearish colors for immediate interpretation.
Built-In Alerts
Alerts are available for:
Bullish divergence
Bearish divergence
Buy signals
Sell signals
The available buy and sell alerts depend on the selected signal type.
How to Use It
Market Context
Above zero: positive momentum
Below zero: negative momentum
The greater the oscillator amplitude, the stronger the momentum impulse
Identify Momentum Extremes
When the oscillator enters an overbought or oversold area, wait for it to cross back through the extreme level. This often provides a cleaner signal than entering immediately at the extreme.
Look for Divergences
Bullish Divergence
Price forms a lower low while the oscillator forms a higher low.
Bearish Divergence
Price forms a higher high while the oscillator forms a lower high.
For more conservative entries, combine a confirmed divergence with a zero-line crossing.
Create Alerts
Open Create Alert and select one of the conditions provided by the indicator:
Bullish divergence
Bearish divergence
Buy
Sell
Main Settings
RSI Length / RSI MA Length
Controls the RSI period and the moving-average period used to build the oscillator.
Overbought / Oversold
Defines the oscillator’s extreme thresholds. The default values are ±12.
Calculate Divergence
Enables or disables divergence detection.
Pivot Length
Controls pivot sensitivity. The default value is 5.
Signal Type
Available options:
OB/OS
Zero Line
Both
None
Gradient Settings
These settings are purely visual and do not affect the indicator logic.
Display Note
The indicator uses overlay=false, so it is displayed in its own panel for maximum readability.
Recommended Crypto Settings
Adjust the settings according to the volatility of the asset. A longer RSI moving average produces more filtering and less noise.
5-Minute — Scalping
RSI: 20
RSI MA: 20
OB/OS: ±12
Pivot: 5
15-Minute — Fast Intraday
RSI: 20
RSI MA: 22
OB/OS: ±12
Pivot: 5–6
1-Hour — Intraday / Swing
RSI: 20
RSI MA: 34
OB/OS: ±12 to ±14
Pivot: 6
4-Hour — Swing Trading
RSI: 24
RSI MA: 34
OB/OS: ±14
Pivot: 6–7
Daily — Position Trading
RSI: 26
RSI MA: 50
OB/OS: ±15 to ±16
Pivot: 7–8
Quick Adjustment Tips
Too Many False Signals
Increase the RSI MA length, for example from 20 to 34
Increase the pivot length
Widen the OB/OS thresholds, for example from ±12 to ±14
Not Enough Signals
Reduce the moving-average length, for example from 34 to 20
Narrow the OB/OS thresholds, for example from ±14 to ±12
FAQ — WaveRider RSI−MA and Divergences
1. What Is WaveRider Used For?
WaveRider is a momentum oscillator based on:
RSI − SMA(RSI)
It highlights overbought and oversold extremes, zero-line crossings, and bullish or bearish divergences.
2. How Do I Read the Oscillator?
Above zero: positive momentum and bullish pressure
Below zero: negative momentum and bearish pressure
High amplitude: strong momentum impulse and possible price extension
3. What Do Overbought and Oversold Mean?
These are momentum extreme zones, set to ±12 by default, where the current move may begin to lose strength.
Waiting for the oscillator to cross back through the extreme level often provides a cleaner signal than entering while the oscillator is still moving deeper into the extreme.
4. What Signals Does the Indicator Display?
OB/OS Signals
A marker appears when the oscillator crosses back through an extreme threshold.
Zero-Line Signals
A marker appears when the oscillator crosses zero.
You can select:
None
OB/OS
Zero Line
Both
using the Signal Type setting.
5. Do the Divergences Repaint?
No. Divergences use confirmed pivots through ta.pivothigh() and ta.pivotlow().
The divergence label appears only after the pivot has been confirmed. This creates a small confirmation delay, but once displayed, the divergence does not repaint.
6. Why Do I See Few or No Signals?
Check the following:
Signal Type is not set to None
OB/OS thresholds are not too wide for the selected asset
The market may be moving very slowly
The RSI MA length may be too long
The pivot length may be too high
The settings may be too conservative for the active timeframe
7. What Should I Do If I See Too Many Signals?
Widen the OB/OS thresholds, for example to ±14
Increase the RSI moving-average length, for example to 34
Increase the pivot length to 6–8 for more selective divergences
8. Recommended Cryptocurrency Settings
5-Minute
RSI 20
MA 20
OB/OS ±12
Pivot 5
15-Minute
RSI 20
MA 22
OB/OS ±12
Pivot 5–6
1-Hour
RSI 20
MA 34
OB/OS ±12 to ±14
Pivot 6
4-Hour
RSI 24
MA 34
OB/OS ±14
Pivot 6–7
Daily
RSI 26
MA 50
OB/OS ±15 to ±16
Pivot 7–8
9. Which Markets and Timeframes Can Be Used?
WaveRider can be used on:
Cryptocurrencies
Indices
Forex
Stocks
It works on all timeframes.
Higher timeframes generally produce slower and more filtered signals, but they may also provide stronger market context.
10. How Is It Different From a Standard RSI?
Instead of displaying the raw RSI, WaveRider displays the difference between the RSI and its moving average:
RSI − SMA(RSI)
This isolates momentum around an equilibrium level of zero and makes momentum regime changes easier to identify.
11. How Should Divergences Be Used?
Bullish
Price forms a lower low while the oscillator forms a higher low. This may indicate weakening bearish momentum and a possible bullish reversal.
Bearish
Price forms a higher high while the oscillator forms a lower high. This may indicate weakening bullish momentum and a possible bearish reversal.
For more conservative timing, combine a divergence with a zero-line crossing.
12. Are Alerts Available?
Yes. Alerts are available for:
Bullish divergence
Bearish divergence
Buy signals
Sell signals
Open Create Alert, select WaveRider as the condition, and choose the desired alert.
13. Can the Visual Appearance Be Customized?
Yes. You can customize:
Positive and negative colors
OB/OS colors
Label colors
Gradients
Fills toward the zero line
These settings are purely visual and do not affect the underlying calculations.
14. How Can It Be Combined With Other Tools?
WaveRider can be combined with:
Market structure, support and resistance, or channels for targets and invalidation
Trend-following moving averages such as EMA 50 and EMA 200
Volume and volatility tools for breakout confirmation
DivergX One for additional divergence confirmation
15. Best Practices
Avoid entering immediately at an extreme
Wait for the oscillator to cross back through the extreme level or zero line
Backtest the settings before using real capital
Use paper trading first
Adapt the thresholds to the volatility of the asset
Use risk management and protective stops
16. Important Limitations
Signals are not guarantees
They represent a momentum condition, not a certain future price movement
In sideways markets, frequent zero-line crossings may occur
Divergences can remain active while price continues moving in the same direction
Higher volatility can create wider and faster oscillator movements
17. Key Settings — Quick Reminder
RSI Length / RSI MA Length
Controls oscillator speed and smoothing.
Overbought / Oversold
Controls the width of the momentum extreme zones.
Pivot Length
Controls divergence sensitivity. A larger value creates more selective divergences.
Signal Type
Available options:
OB/OS
Zero Line
Both
None
Gradients
Used for visual customization only.
Circles and Triangles
Small Circle
A small circle appears at every WaveRider wave crossover.
Green Circle
A green circle appears when the WaveRider waves are oversold and cross upward, indicating a bullish momentum crossover.
Red Circle
A red circle appears when the WaveRider waves are overbought and cross downward, indicating a bearish momentum crossover.
Gold / Orange Circle
A gold or orange circle appears when:
RSI is below 20
WaveRider waves are at or below −80
The waves cross upward
A strong bullish divergence has occurred
This may indicate the possibility of a strong bullish move.
However, none of these circles should be treated as reliable standalone trading signals. They are informational tools designed to support market analysis and are best combined with DivergX One and additional confirmation.
Purple Triangle
A purple triangle appears when a bullish or bearish divergence forms and the WaveRider waves cross in an overbought or oversold area.
Trade safely and use proper risk management.
Script sob convite
Apenas usuários aprovados pelo autor podem acessar este script. Você precisará solicitar e obter permissão para usá-lo. Isso geralmente é concedido após o pagamento. Para mais detalhes, siga as instruções do autor abaixo ou entre em contato diretamente com john_boisvert1985.
A TradingView NÃO recomenda pagar ou usar um script, a menos que você confie totalmente em seu autor e entenda como ele funciona. Você também pode encontrar alternativas gratuitas e de código aberto em nossos scripts da comunidade.
Instruções do autor

Aviso legal
Script sob convite
Apenas usuários aprovados pelo autor podem acessar este script. Você precisará solicitar e obter permissão para usá-lo. Isso geralmente é concedido após o pagamento. Para mais detalhes, siga as instruções do autor abaixo ou entre em contato diretamente com john_boisvert1985.
A TradingView NÃO recomenda pagar ou usar um script, a menos que você confie totalmente em seu autor e entenda como ele funciona. Você também pode encontrar alternativas gratuitas e de código aberto em nossos scripts da comunidade.