Atualizado
Volume Delta Pivot Matrix [BigBeluga]
More exclusive indicators from BigBeluga
Subscribe to BigBeluga Premium for $66.47/month to get exclusive indicators by this author. You pay right on TradingView and can use them on your charts straight away.
Explore BigBeluga Premium🔵 OVERVIEW
🔵 HOW IT WORKS
🔵 HOW TO USE
🔵 NOTES
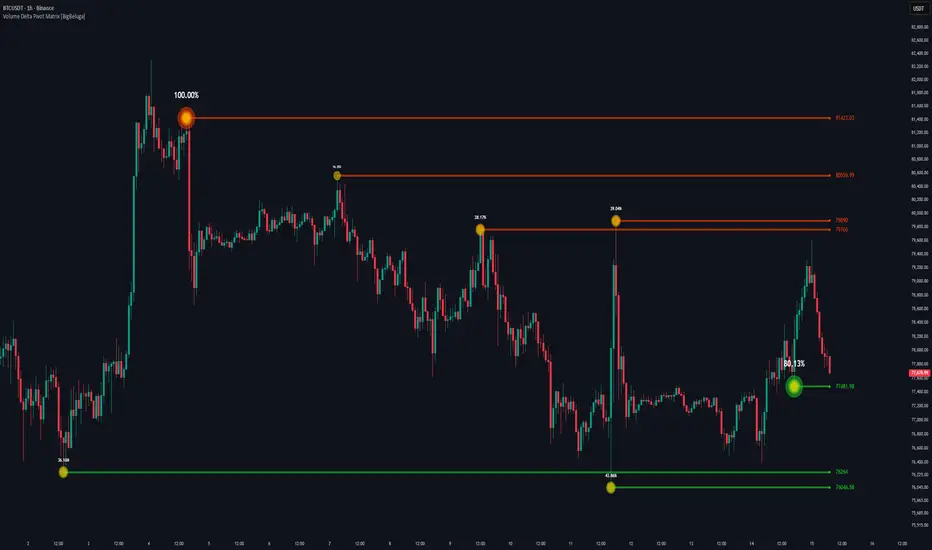
Volume Delta Pivot Matrix [BigBeluga] is an indicator that maps pivot highs and lows together with the volume delta accumulated around them, then plots each level as a color-coded support or resistance line.
It solves the problem of flat, unweighted pivot lines by filtering out pivots backed by weak volume delta, so only levels with meaningful buying or selling pressure stay on the chart.
🔵 HOW IT WORKS
The indicator runs a pivot detection and volume-delta scoring pipeline, then renders the surviving levels visually:
1 — Pivot Detection & Delta Collection
- Swing Lookback: Uses Pivot Swing Length bars on both sides to detect pivot highs and pivot lows.
- Volume Delta Calculation: Sums volume across the pivot window, adding volume on up-closes and subtracting it on down-closes to produce a net delta value for each pivot.
Pine Script®
2 — Breakout & Level Management
- Breakout Removal: A support level is removed when price trades at or below it, and a resistance level is removed when price trades at or above it.
- Capacity Cap: Only the most recent Max Active Levels to Plot levels are kept, with older ones dropped automatically.
- Delta Filter: Levels whose absolute delta falls below Minimum Delta % Filter relative to the strongest level are permanently discarded.
3 — Visual Encoding
- Gradient Circles: Each level is marked with 1 to 4 circles whose size and gradient color scale with delta strength, from yellow to the bullish or bearish theme color.
- Percentage Label: The largest circle displays the level's delta as a percentage of the strongest active level.
- Price Tag: A left-facing label at the current bar shows the exact level price.
🔵 HOW TO USE
Beyond simply marking pivots, the indicator can be applied in several ways:
- Identify High-Conviction Levels: Treat levels with more and larger circles as stronger support or resistance, since they carry greater volume delta.
- Filter Noise Automatically: Raise the Minimum Delta % Filter to strip out weak pivots and keep only the most significant levels.
- Trade Reactions near Levels: Watch for price approaching a green support or red resistance line and use the displayed price tag for precise entries.
- Confirm Breakouts: When a level disappears, it signals price has broken through, which can be used as a breakout confirmation.
- Customize the Look: Adjust Line Style and the bullish/bearish colors to match your chart theme.
🔵 NOTES
Why this implementation is unique:
- Combines classic pivot detection with a real-time volume delta weighting system instead of treating all pivots equally.
- Uses a dynamic gradient circle system so level strength is readable at a glance without extra panels.
- Automatically manages level lifecycle through breakout detection, capacity limits, and delta filtering.
- Fully customizable colors, line styles, and filter thresholds to match any chart setup.
Notas de Lançamento
- Added delta volume size per pivotNotas de Lançamento
Notes — What ChangedDelta basis changed — now uses close position inside the bar's high–low range instead of just close vs open.
Added barRange (high - low) to measure where the close sits.
Added closeRatio (0 = at low, 1 = at high) to normalize the close's position.
Volume is now smoothly weighted from -volume (close at low) to +volume (close at high); mid-range closes contribute ~0.
Zero-range fallback added — when high == low, falls back to the original close vs open logic to avoid divide-by-zero.
Applied to both ph and pl blocks for consistency.
Note: delta values are now fractional, so totals can be smaller in magnitude than before.

🌐 bigbeluga.org/tv - Get access to our powerful tools & indicators.
🔵 Learn More -> docs.bigbeluga.org/
🔵 Join Discord -> go.bigbeluga.org/k65q9bfqfu
All content provided by BigBeluga is for educational purposes only
🔵 Learn More -> docs.bigbeluga.org/
🔵 Join Discord -> go.bigbeluga.org/k65q9bfqfu
All content provided by BigBeluga is for educational purposes only
Aviso legal
As informações e publicações não se destinam a ser, e não constituem, conselhos ou recomendações financeiras, de investimento, comerciais ou de outro tipo fornecidos ou endossados pela TradingView. Leia mais nos Termos de Uso.
🌐 bigbeluga.org/tv - Get access to our powerful tools & indicators.
🔵 Learn More -> docs.bigbeluga.org/
🔵 Join Discord -> go.bigbeluga.org/k65q9bfqfu
All content provided by BigBeluga is for educational purposes only
🔵 Learn More -> docs.bigbeluga.org/
🔵 Join Discord -> go.bigbeluga.org/k65q9bfqfu
All content provided by BigBeluga is for educational purposes only
Aviso legal
As informações e publicações não se destinam a ser, e não constituem, conselhos ou recomendações financeiras, de investimento, comerciais ou de outro tipo fornecidos ou endossados pela TradingView. Leia mais nos Termos de Uso.