Gurbetci iFVG + V-Shape Recovery
OVERVIEW
This open-source indicator combines two of the most widely known Smart Money / ICT concepts into a single, structured workflow: the V-Shape Recovery (liquidity sweep followed by a CISD reversal confirmation) and the Inversion Fair Value Gap (iFVG) retest model. Instead of printing isolated signals, every reversal is measured against an 8-point confluence checklist, so you always see not only WHAT fired but WHY it fired. Entries are visualized together with their invalidation level and an R-multiple target zone.
This tool was built and released for free on purpose: no indicator alone is a trading edge. An indicator can only describe what price has already done. Edge comes from a tested model, risk management and disciplined execution. This script gives you the same drawing and confluence engine that is often sold commercially, so you can focus on the part that actually matters.
BACKGROUND CONCEPTS
- Fair Value Gap (FVG): a three-candle imbalance where the wicks of candle 1 and candle 3 do not overlap, leaving an unfilled gap.
- Inversion FVG (iFVG): when price closes through an FVG against its original direction, the gap is considered invalidated and flips its role — a bearish gap becomes support, a bullish gap becomes resistance. The retest of this inverted zone is the core entry of the model.
- Consequent Encroachment (CE): the 50% midpoint of a gap, used as the fine-tuned entry/reaction level inside the zone.
- Liquidity Sweep: price wicks through an obvious swing high/low (where stop orders rest) but closes back beyond the level — a stop hunt rather than a genuine breakout.
- CISD (Change In State of Delivery): after a sweep, price closes through the opening price of the candle series that ran into the extreme, confirming that delivery has flipped direction. Sweep + CISD together form the V-Shape Recovery.
- SMT Divergence: two correlated instruments (e.g. NQ and ES) disagree at an extreme — one sweeps its swing while the other holds. This is checked in real time at the moment of the sweep.
- MSS (Market Structure Shift): a candle close through the most recent opposing swing point.
- Premium / Discount: position of price relative to the 50% equilibrium of the recent dealing range. Longs are favored in discount, shorts in premium.
- Killzone: the New York morning session window (customizable), when volatility and institutional participation are highest.
HOW IT WORKS
1. Swing highs/lows are tracked with pivots and treated as resting liquidity. Equal highs/lows (double tops/bottoms within an ATR tolerance) are detected and weighted as stronger liquidity.
2. When a swing is swept by a wick but the candle closes back beyond the level, a sweep is marked (x-cross) and the CISD level is calculated from the candle series that ran into the extreme.
3. If price closes through the CISD level within the configured window, and the confirming candle passes the ATR displacement filter, the V-Shape Recovery is confirmed and scored.
4. In parallel, all FVGs are tracked in the background. A gap that is closed through against its direction becomes an iFVG, drawn with a dashed border and its CE (50%) line.
5. ENTRY signal: after a V-Shape Recovery, when price retests an iFVG in the same direction and gets rejected (closes back beyond the zone edge), the entry marker prints, with the invalidation placed beyond the zone/sweep extreme and a configurable R-multiple target box.
CONFLUENCE SCORE (max 8)
Every V-Shape signal shows a score label (e.g. 5/8). Hover the label to see exactly which components were met:
1. Sweep + CISD (base condition, always 1 point)
2. Real-time SMT divergence against the correlated symbol at the sweep
3. Recent iFVG retest in the same direction
4. Market Structure Shift within the lookback window
5. Premium/Discount alignment (longs in discount, shorts in premium)
6. Higher-timeframe FVG bias alignment (default 15m)
7. Equal highs/lows sweep bonus
8. Killzone timing
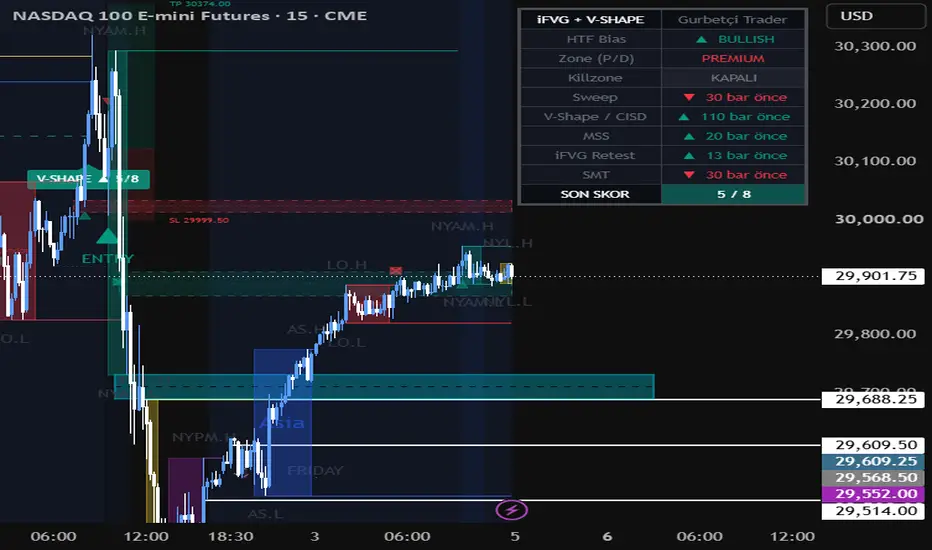
The status panel (top right) shows the live state of every component: HTF bias, premium/discount position, killzone state, last sweep, last V-Shape, last MSS, last iFVG retest, last SMT and the score of the most recent signal.
CHART MARKERS
- x-cross: liquidity sweep (dotted line connects the swept swing)
- Small diamond: V-Shape confirmed but below your minimum score
- Score label "V-SHAPE 5/8": V-Shape at or above your minimum score
- Small triangle: iFVG retest
- ENTRY triangle: iFVG retest following a V-Shape Recovery, with SL/TP boxes
- Small circle: SMT divergence at a sweep
- Dashed boxes: inversion FVG zones with dotted CE midline
- Blue background: killzone session
ALERTS
Create ONE alert on this indicator and select "Any alert() function call" as the condition. You will receive dynamic notifications containing the symbol, timeframe, confluence breakdown and the entry/invalidation/target prices of ENTRY signals. Individual static alert conditions are also available for every event type (V-Shape long/short, ENTRY long/short, iFVG retest, SMT).
SETTINGS
- Zone display: "iFVG only" (clean chart, recommended) or all FVGs
- Minimum FVG width as an ATR multiple; inversion detection by close or wick
- Swing pivot length, sweep-to-CISD window, ATR displacement filter
- Every confluence component can be toggled individually (SMT symbol, MSS, premium/discount range length, HTF timeframe, equal H/L tolerance, killzone session)
- Killzone can be used as a score component or as a hard session filter
- Minimum score required for signal labels; R-multiple for the target box; alert toggle
LIMITATIONS - PLEASE READ
The higher-timeframe bias uses the developing HTF candle and may change before that candle closes. All signals are evaluated on bar close. The SL/TP boxes are visualizations of the model's logic, not trade recommendations. This indicator is a charting and educational tool: no indicator alone constitutes a profitable strategy, past behavior does not guarantee future results, and nothing here is financial advice.
Published free and open-source by Gurbetci Trader.
This open-source indicator combines two of the most widely known Smart Money / ICT concepts into a single, structured workflow: the V-Shape Recovery (liquidity sweep followed by a CISD reversal confirmation) and the Inversion Fair Value Gap (iFVG) retest model. Instead of printing isolated signals, every reversal is measured against an 8-point confluence checklist, so you always see not only WHAT fired but WHY it fired. Entries are visualized together with their invalidation level and an R-multiple target zone.
This tool was built and released for free on purpose: no indicator alone is a trading edge. An indicator can only describe what price has already done. Edge comes from a tested model, risk management and disciplined execution. This script gives you the same drawing and confluence engine that is often sold commercially, so you can focus on the part that actually matters.
BACKGROUND CONCEPTS
- Fair Value Gap (FVG): a three-candle imbalance where the wicks of candle 1 and candle 3 do not overlap, leaving an unfilled gap.
- Inversion FVG (iFVG): when price closes through an FVG against its original direction, the gap is considered invalidated and flips its role — a bearish gap becomes support, a bullish gap becomes resistance. The retest of this inverted zone is the core entry of the model.
- Consequent Encroachment (CE): the 50% midpoint of a gap, used as the fine-tuned entry/reaction level inside the zone.
- Liquidity Sweep: price wicks through an obvious swing high/low (where stop orders rest) but closes back beyond the level — a stop hunt rather than a genuine breakout.
- CISD (Change In State of Delivery): after a sweep, price closes through the opening price of the candle series that ran into the extreme, confirming that delivery has flipped direction. Sweep + CISD together form the V-Shape Recovery.
- SMT Divergence: two correlated instruments (e.g. NQ and ES) disagree at an extreme — one sweeps its swing while the other holds. This is checked in real time at the moment of the sweep.
- MSS (Market Structure Shift): a candle close through the most recent opposing swing point.
- Premium / Discount: position of price relative to the 50% equilibrium of the recent dealing range. Longs are favored in discount, shorts in premium.
- Killzone: the New York morning session window (customizable), when volatility and institutional participation are highest.
HOW IT WORKS
1. Swing highs/lows are tracked with pivots and treated as resting liquidity. Equal highs/lows (double tops/bottoms within an ATR tolerance) are detected and weighted as stronger liquidity.
2. When a swing is swept by a wick but the candle closes back beyond the level, a sweep is marked (x-cross) and the CISD level is calculated from the candle series that ran into the extreme.
3. If price closes through the CISD level within the configured window, and the confirming candle passes the ATR displacement filter, the V-Shape Recovery is confirmed and scored.
4. In parallel, all FVGs are tracked in the background. A gap that is closed through against its direction becomes an iFVG, drawn with a dashed border and its CE (50%) line.
5. ENTRY signal: after a V-Shape Recovery, when price retests an iFVG in the same direction and gets rejected (closes back beyond the zone edge), the entry marker prints, with the invalidation placed beyond the zone/sweep extreme and a configurable R-multiple target box.
CONFLUENCE SCORE (max 8)
Every V-Shape signal shows a score label (e.g. 5/8). Hover the label to see exactly which components were met:
1. Sweep + CISD (base condition, always 1 point)
2. Real-time SMT divergence against the correlated symbol at the sweep
3. Recent iFVG retest in the same direction
4. Market Structure Shift within the lookback window
5. Premium/Discount alignment (longs in discount, shorts in premium)
6. Higher-timeframe FVG bias alignment (default 15m)
7. Equal highs/lows sweep bonus
8. Killzone timing
The status panel (top right) shows the live state of every component: HTF bias, premium/discount position, killzone state, last sweep, last V-Shape, last MSS, last iFVG retest, last SMT and the score of the most recent signal.
CHART MARKERS
- x-cross: liquidity sweep (dotted line connects the swept swing)
- Small diamond: V-Shape confirmed but below your minimum score
- Score label "V-SHAPE 5/8": V-Shape at or above your minimum score
- Small triangle: iFVG retest
- ENTRY triangle: iFVG retest following a V-Shape Recovery, with SL/TP boxes
- Small circle: SMT divergence at a sweep
- Dashed boxes: inversion FVG zones with dotted CE midline
- Blue background: killzone session
ALERTS
Create ONE alert on this indicator and select "Any alert() function call" as the condition. You will receive dynamic notifications containing the symbol, timeframe, confluence breakdown and the entry/invalidation/target prices of ENTRY signals. Individual static alert conditions are also available for every event type (V-Shape long/short, ENTRY long/short, iFVG retest, SMT).
SETTINGS
- Zone display: "iFVG only" (clean chart, recommended) or all FVGs
- Minimum FVG width as an ATR multiple; inversion detection by close or wick
- Swing pivot length, sweep-to-CISD window, ATR displacement filter
- Every confluence component can be toggled individually (SMT symbol, MSS, premium/discount range length, HTF timeframe, equal H/L tolerance, killzone session)
- Killzone can be used as a score component or as a hard session filter
- Minimum score required for signal labels; R-multiple for the target box; alert toggle
LIMITATIONS - PLEASE READ
The higher-timeframe bias uses the developing HTF candle and may change before that candle closes. All signals are evaluated on bar close. The SL/TP boxes are visualizations of the model's logic, not trade recommendations. This indicator is a charting and educational tool: no indicator alone constitutes a profitable strategy, past behavior does not guarantee future results, and nothing here is financial advice.
Published free and open-source by Gurbetci Trader.

Aviso legal
As informações e publicações não se destinam a ser, e não constituem, conselhos ou recomendações financeiras, de investimento, comerciais ou de outro tipo fornecidos ou endossados pela TradingView. Leia mais nos Termos de Uso.
Aviso legal
As informações e publicações não se destinam a ser, e não constituem, conselhos ou recomendações financeiras, de investimento, comerciais ou de outro tipo fornecidos ou endossados pela TradingView. Leia mais nos Termos de Uso.