OPEN-SOURCE SCRIPT
Macro Clock Overlap 166/186/208) Anchored (v6)
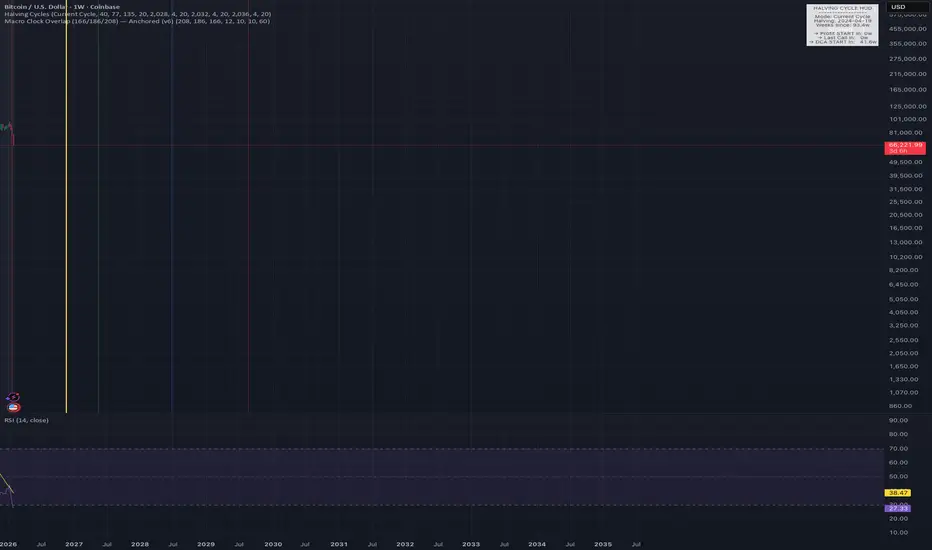
Macro Clock Overlap is a time-based market structure overlay designed to visualize cyclical pressure zones created by the interaction of three independent macro clocks:
166 weeks — Momentum / expansion cycle (anchored to a major weekly RSI peak)
186 weeks — Capitulation / contraction cycle (anchored to a weekly RSI < 30 trough)
208 weeks — Bitcoin halving cycle (protocol-defined supply shock)
Rather than attempting to predict price, this indicator highlights periods of structural instability where multiple cycles overlap — conditions that historically coincide with increased volatility, regime shifts, and non-linear market behavior.
How it works
Each cycle is projected forward and backward from a fixed anchor date.
Around each projected event, a configurable time window (± weeks) is applied.
For every bar, the script computes an Overlap Score (0–3):
0 — No active macro cycles
1 — Single cycle influence
2 — Reinforced cycle overlap (heightened instability)
3 — Rare full convergence (maximum structural stress)
The background shading reflects the current overlap score, and optional vertical lines mark projected cycle events for each clock.
What this indicator is (and isn’t)
✔ A probabilistic timing framework
✔ A way to identify volatility expansion and transition zones
✔ Useful for risk management, position sizing, and expectation setting
✘ Not a price prediction tool
✘ Not a buy/sell signal generator
✘ Not curve-fitted to price action
This tool is best used in conjunction with price structure, trend, and momentum analysis.
Customization
Anchor dates can be adjusted from the settings panel
Cycle lengths and window sizes are fully configurable
Visuals (background shading, vertical lines, table) can be toggled on/off
Designed for weekly charts, but works on any timeframe with macro intent.
Philosophy
Markets are not governed by a single clock.
They evolve through the interaction of multiple rhythms — internal momentum, stress accumulation, and external shocks.
Macro Clock Overlap makes those rhythms visible.
166 weeks — Momentum / expansion cycle (anchored to a major weekly RSI peak)
186 weeks — Capitulation / contraction cycle (anchored to a weekly RSI < 30 trough)
208 weeks — Bitcoin halving cycle (protocol-defined supply shock)
Rather than attempting to predict price, this indicator highlights periods of structural instability where multiple cycles overlap — conditions that historically coincide with increased volatility, regime shifts, and non-linear market behavior.
How it works
Each cycle is projected forward and backward from a fixed anchor date.
Around each projected event, a configurable time window (± weeks) is applied.
For every bar, the script computes an Overlap Score (0–3):
0 — No active macro cycles
1 — Single cycle influence
2 — Reinforced cycle overlap (heightened instability)
3 — Rare full convergence (maximum structural stress)
The background shading reflects the current overlap score, and optional vertical lines mark projected cycle events for each clock.
What this indicator is (and isn’t)
✔ A probabilistic timing framework
✔ A way to identify volatility expansion and transition zones
✔ Useful for risk management, position sizing, and expectation setting
✘ Not a price prediction tool
✘ Not a buy/sell signal generator
✘ Not curve-fitted to price action
This tool is best used in conjunction with price structure, trend, and momentum analysis.
Customization
Anchor dates can be adjusted from the settings panel
Cycle lengths and window sizes are fully configurable
Visuals (background shading, vertical lines, table) can be toggled on/off
Designed for weekly charts, but works on any timeframe with macro intent.
Philosophy
Markets are not governed by a single clock.
They evolve through the interaction of multiple rhythms — internal momentum, stress accumulation, and external shocks.
Macro Clock Overlap makes those rhythms visible.
Script de código aberto
Em verdadeiro espírito do TradingView, o criador deste script o tornou de código aberto, para que os traders possam revisar e verificar sua funcionalidade. Parabéns ao autor! Embora você possa usá-lo gratuitamente, lembre-se de que a republicação do código está sujeita às nossas Regras da Casa.

Aviso legal
As informações e publicações não se destinam a ser, e não constituem, conselhos ou recomendações financeiras, de investimento, comerciais ou de outro tipo fornecidos ou endossados pela TradingView. Leia mais nos Termos de Uso.
Script de código aberto
Em verdadeiro espírito do TradingView, o criador deste script o tornou de código aberto, para que os traders possam revisar e verificar sua funcionalidade. Parabéns ao autor! Embora você possa usá-lo gratuitamente, lembre-se de que a republicação do código está sujeita às nossas Regras da Casa.
Aviso legal
As informações e publicações não se destinam a ser, e não constituem, conselhos ou recomendações financeiras, de investimento, comerciais ou de outro tipo fornecidos ou endossados pela TradingView. Leia mais nos Termos de Uso.