Previous Day High/Low Breakout Indicator
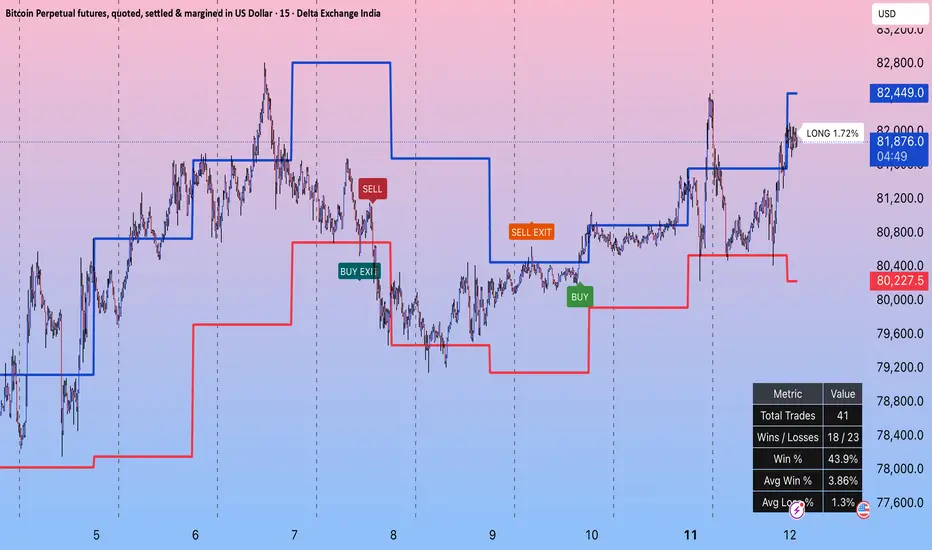
Previous Day High/Low Breakout Indicator
This indicator is built around a simple breakout concept:
• Bullish momentum is assumed when price closes above the Previous Day High (PDH)
• Bearish momentum is assumed when price closes below the Previous Day Low (PDL)
The script continuously tracks the previous session’s high and low levels and uses them as directional breakout triggers.
Unlike indicators that rely on multiple lagging filters, this approach focuses primarily on raw price action and market expansion beyond key reference levels.
━━━━━━━━━━━━━━━━━━
CORE LOGIC
Previous Day Range Detection
The script calculates:
• Previous Day High (PDH)
• Previous Day Low (PDL)
using the selected session settings.
These levels remain active until a new session completes and fresh PDH/PDL levels become available.
━━━━━━━━━━━━━━━━━━
LONG LOGIC
A BUY signal is generated when:
• Price closes above the Previous Day High
This indicates that price has broken beyond the prior session’s upper boundary, suggesting possible bullish continuation or expansion.
If an active short position exists internally, the script first generates a SELL EXIT signal before flipping to a BUY signal.
━━━━━━━━━━━━━━━━━━
SHORT LOGIC
A SELL signal is generated when:
• Price closes below the Previous Day Low
This indicates that price has broken beneath the prior session’s lower boundary, suggesting possible bearish continuation or downside expansion.
If an active long position exists internally, the script first generates a BUY EXIT signal before flipping to a SELL signal.
━━━━━━━━━━━━━━━━━━
EXIT LOGIC
The indicator uses an opposite-breakout exit model.
Long Exit
A BUY EXIT signal occurs when:
• A valid bearish breakout appears while a long state is active
Short Exit
A SELL EXIT signal occurs when:
• A valid bullish breakout appears while a short state is active
This creates a continuous flip-based structure where the market remains either:
• Bullish
• Bearish
• Neutral
depending on the latest breakout condition.
━━━━━━━━━━━━━━━━━━
MARKET COMPATIBILITY
This indicator is primarily designed for continuous 24-hour markets such as cryptocurrencies, where Previous Day High and Low levels often act as important breakout reference zones.
However, it can also be used on other markets such as:
• Indices
• Stocks
• Forex
• Futures
with appropriate session selection and trader discretion.
━━━━━━━━━━━━━━━━━━
FLOATING RUNNING P/L LABEL
While a trade state is active, the script displays a floating running P/L label on the chart.
The label updates dynamically and shows:
• Current trade direction
• Live unrealized percentage gain/loss
The label’s:
• Colors
• Position offset
• Visibility
can all be customized from settings.
━━━━━━━━━━━━━━━━━━
BACKTEST WINDOW
The indicator includes an optional custom backtest window.
When enabled:
• Signals
• Statistics
• Performance calculations
are restricted only to the selected date range.
This helps isolate specific market conditions or testing periods without affecting the rest of the chart.
━━━━━━━━━━━━━━━━━━
STATISTICS TABLE
A compact statistics table is included for quick performance reference.
The table displays:
• Total Trades
• Wins / Losses
• Win Rate %
• Average Win %
• Average Loss %
The table position and colors are fully customizable from settings.
━━━━━━━━━━━━━━━━━━
NOTES
• This script is an indicator, not a TradingView strategy.
• Statistics are internally calculated and intended for analytical reference only.
• Performance can vary significantly across assets, sessions, and timeframes.
• Always combine breakout systems with proper risk management and market context analysis.
━━━━━━━━━━━━━━━━━━
DISCLAIMER
This indicator is provided for educational and informational purposes only and should not be considered financial advice.
Trading involves substantial risk, and past performance does not guarantee future results. Always perform your own research, test strategies thoroughly, and use appropriate risk management before trading with real capital.

Aviso legal
As informações e publicações não se destinam a ser, e não constituem, conselhos ou recomendações financeiras, de investimento, comerciais ou de outro tipo fornecidos ou endossados pela TradingView. Leia mais nos Termos de Uso.
Aviso legal
As informações e publicações não se destinam a ser, e não constituem, conselhos ou recomendações financeiras, de investimento, comerciais ou de outro tipo fornecidos ou endossados pela TradingView. Leia mais nos Termos de Uso.