Atualizado
Buy-or-Sell-WiP
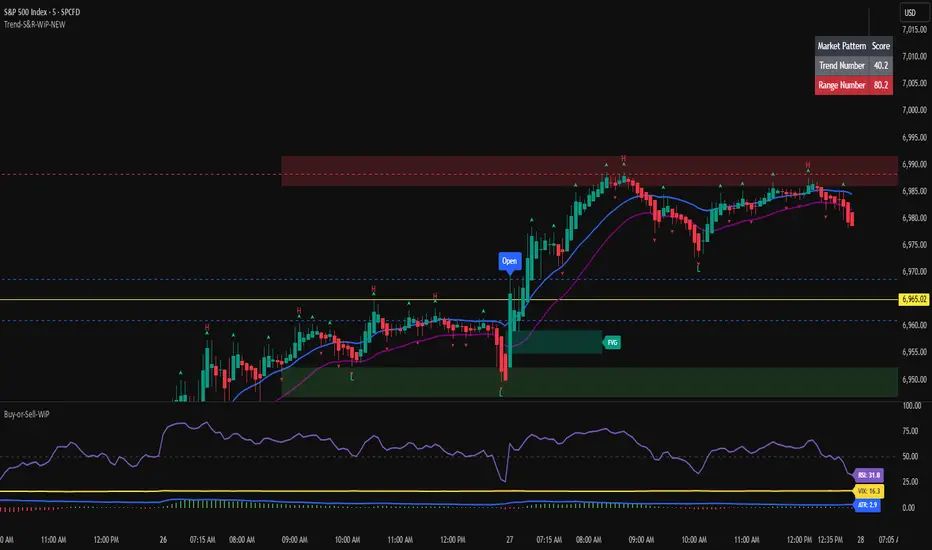
Indicator Features:
> Simple red/green histogram to indicate go long/buy or go short/sell
> Recommended to use with my other indicator: 5/15-Min-ORB-Trend-Finder-WiP
Strategy:
> Use with 1-min chart with 5-min High/Low or 5-min chart with 15-min High/Low
> After a breakout, wait for confirmation before placing a trade, which is:
- Two confirming candles (green for long/buy, red for short/sell)
and
- Buy-or-Sell-WiP histogram: green for long/buy, red for short/sell
Notas de Lançamento
Indicator Features:> Simple green (buy)/ red (sell) histogram.
> Recommended to be used with my other indicator: 5/15-Min-ORB-Trend-Finder-WiP
Strategy:
> I use this exclusively with SPX, trading CALL/PUT credit spreads.
> Use the 1-min chart with 5-min High/Low, or use the 5-min chart with 15-min High/Low.
> After a breakout, wait for the confirmations before placing a trade, which are:
- Two consecutive confirming candles (green for going long/buy, red for going short/sell).
and
- Buy-or-Sell-WiP histogram: green for long/buy, red for short/sell.
> NOTE: Do not place a trade unless there are 10-points, or more from the "go" candle to the nearest resistance line (when going long/buy) or support line (when going short/sell); the reason being the market may not move enough for you to take profit once your trade fills; FYI, I usually try for $0.30 profit when trading CALL/PUT credit spreads.
Notas de Lançamento
11/15/2025 - corrected the title by adding a shorttitle=Buy-or-Sell-WiPNotas de Lançamento
11/28/2025 Update: combined ATR with MACD histogram, this will be used later with my secret ODTE Iron Condor strategy that I release with my Trade Calculator software.Notas de Lançamento
01/05/2026 - I've added...> the VIX line w/label (the CBOE Volatility Index which measures the market's expectation of 30-day volatility for the S&P 500),
- values above 30 indicate greater market fear and uncertainty,
- values below 20 suggest stability.
> and the ATR line w/label (Average True Range),
- helps gain a perspective on the market's historical volatility vs recent daily changes.
Both the VIX and ATR can be used to track a trade's performance and over time the historic data will tell you if a trade is a "go" or "no go".
Notas de Lançamento
2026.01.27 - added RSI, VIX, and ATR lines, all with labels for easy reference
Aviso legal
As informações e publicações não se destinam a ser, e não constituem, conselhos ou recomendações financeiras, de investimento, comerciais ou de outro tipo fornecidos ou endossados pela TradingView. Leia mais nos Termos de Uso.
Aviso legal
As informações e publicações não se destinam a ser, e não constituem, conselhos ou recomendações financeiras, de investimento, comerciais ou de outro tipo fornecidos ou endossados pela TradingView. Leia mais nos Termos de Uso.