Atualizado
GBR Quant Master Suite [Smart S/R + Trend]
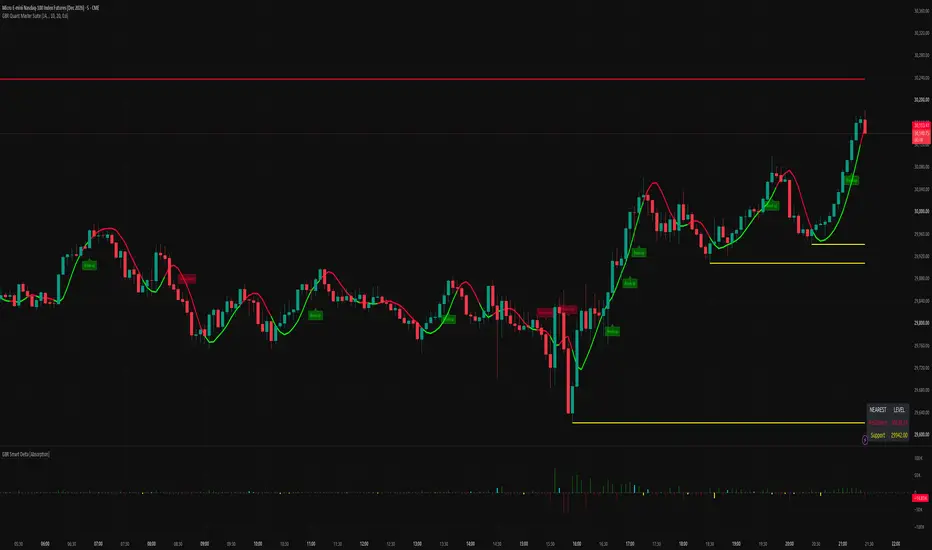
The GBR Quant Master Suite is the ultimate all-in-one algorithmic weapon for professional prop firm traders and aggressive day traders. It combines a highly sensitive multi-timeframe (MTF) trend ribbon with a smart, self-cleaning Support & Resistance network.
Built for those who demand raw price action without the visual clutter.
🔥 Core Features:
Self-Cleaning Adaptive S/R: Automatically detects major structural pivot points and draws clean support/resistance lines.
Auto-Breakout Logic: The moment a level is broken by a candle close, the long line is instantly deleted to keep your chart pristine. It leaves behind a minimal Break ▲ or Break ▼ marker for historical reference.
Dynamic Trend Ribbon: A zero-lag, smoothed moving average band that instantly shifts between Bullish (Green) and Bearish (Red) to keep you on the right side of the momentum.
Minimal Radar Dashboard: A sleek, transparent, non-intrusive HUD in the bottom right corner that continuously tracks the exact price distance of the closest active Resistance and Support levels.
Institutional Grade: Zero noise. No repainting. Just pure market geometry.
🎯 How to execute:
Wait for the Trend Ribbon to align with a breakout. If the ribbon turns Green and you get a Break ▲ signal at a major resistance, that is your sniper entry.
Built for those who demand raw price action without the visual clutter.
🔥 Core Features:
Self-Cleaning Adaptive S/R: Automatically detects major structural pivot points and draws clean support/resistance lines.
Auto-Breakout Logic: The moment a level is broken by a candle close, the long line is instantly deleted to keep your chart pristine. It leaves behind a minimal Break ▲ or Break ▼ marker for historical reference.
Dynamic Trend Ribbon: A zero-lag, smoothed moving average band that instantly shifts between Bullish (Green) and Bearish (Red) to keep you on the right side of the momentum.
Minimal Radar Dashboard: A sleek, transparent, non-intrusive HUD in the bottom right corner that continuously tracks the exact price distance of the closest active Resistance and Support levels.
Institutional Grade: Zero noise. No repainting. Just pure market geometry.
🎯 How to execute:
Wait for the Trend Ribbon to align with a breakout. If the ribbon turns Green and you get a Break ▲ signal at a major resistance, that is your sniper entry.
Notas de Lançamento
v2.0 — Level cap, no phantom levels, and an option for confirmedhigher-timeframe data
Four changes in this update. Two of them change what you see on the
chart, two of them keep the script working well on long histories.
1. Maximum active levels
Levels used to accumulate without limit — only a break removed one, so
anything that never broke stayed forever. On a long chart that meant
hundreds of lines and a loop that ran over all of them on every bar,
which slowed the script down and eventually filled TradingView's drawing
limit. There is now a "Maximum active levels" setting, default 20. When
the limit is reached, the oldest level is dropped.
2. Levels that were already passed are no longer created
A pivot is only confirmed a number of bars after it forms, and by then
price has often moved beyond it. The script used to create those levels
anyway, then immediately mark them as broken and delete them — a line
that flashed on the chart and a break marker for a level that was never
actually in play. Those are now skipped.
3. New option: "Use only closed higher-timeframe bars", on by default
When on, the trend line only updates once the higher-timeframe bar has
closed, so the historical chart matches what you would have seen live.
When off, the line reacts sooner, but it can change within the bar, and
the historical display will look better than it actually was.
4. Break labels moved clear of the candles
They used to sit at the level price, right inside the price action,
where the candles covered them. They now sit beside the bar at a
distance that scales with ATR, so they are readable on any instrument.
An upward break is marked below the bar, a downward break above it —
the label shows where price came from, and leaves the space ahead of
the move clear. The distance is adjustable, and the markers can be
switched off.
Other changes:
- Alerts added: price crossing the trend line in either direction, and
resistance or support levels being broken
- Prices in the dashboard follow the instrument's own tick size instead
of being rounded to two decimals
- Warning on the chart if the selected trend timeframe is lower than the
chart timeframe, which produces misleading results
- Colours are configurable
- The plot was labelled "Ribbon" but draws a single line — renamed to
"Trend line"
- Code comments translated to English
Two notes on the description, since the previous one was not accurate.
The trend line uses a Hull moving average, which lags less than a simple
average but is not zero-lag — every moving average is an average of the
past. And the previous "no repainting" claim only holds with the new
confirmed-bars option on; with it off, the higher-timeframe value does
change within the bar. Both are now stated plainly in the settings.

Aviso legal
As informações e publicações não se destinam a ser, e não constituem, conselhos ou recomendações financeiras, de investimento, comerciais ou de outro tipo fornecidos ou endossados pela TradingView. Leia mais nos Termos de Uso.
Aviso legal
As informações e publicações não se destinam a ser, e não constituem, conselhos ou recomendações financeiras, de investimento, comerciais ou de outro tipo fornecidos ou endossados pela TradingView. Leia mais nos Termos de Uso.