OPEN-SOURCE SCRIPT
daPisa MA + RSI
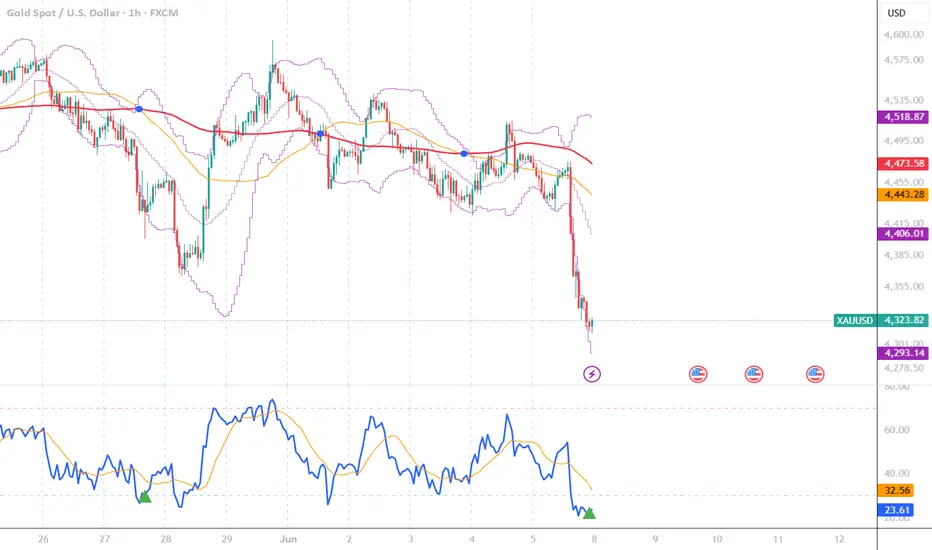
daPisa + Simple RSI Div: Multi-Confluence Trend & Reversal Suite
The daPisa + Simple RSI Div (Pine Script v6) is an all-in-one technical analysis dashboard designed to blend structural trend-following with high-probability momentum exhaustion signals. By housing Dual Moving Averages, Bollinger Bands, an optimized RSI Divergence engine, and a Stochastic Oscillator within a single script, it provides traders with a clean, clutter-free workspace to identify confluence zones, trend reversals, and volatility breakouts.
🛠️ Key Components & Architecture
1. Primary Chart Elements (Force Overlay)
Dual Moving Averages: Tracks structural market direction utilizing a Fast MA (50) and a Slow MA (120). Trend shifts are explicitly highlighted on your main chart using Blue Intersection Marks at crossover/crossunder points.
Price Bollinger Bands: Displays standard volatility bands (20 Length, 2 StdDev) directly on the price chart to gauge squeeze phases and extension targets.
2. Advanced RSI Engine (Sub-Chart)
Native-Style RSI line: Built using TradingView's default algorithm for seamless continuity.
Flexible RSI-Based MA Options: Replicates default TV features by allowing you to choose between SMA, EMA, or Bollinger Bands applied directly to the RSI value. This helps filter out momentum noise and signals line crossovers or volatility bands expansion within the oscillator panel itself.
Filtered Divergence Alerts: Triggers clean Bullish and Bearish divergence markers.
3. Secondary Momentum Panel
Stochastic Oscillator: A fully adjustable Stochastic (%K, %D) line designed to act as a secondary trigger engine for fine-tuning entry windows when price interacts with major support/resistance or structural MA lines.
🎯 What Makes This Script Unique?
Anti-Clutter Divergence Logic: Traditional divergence indicators often suffer from "signal crowding" or over-plotting. This script utilizes precise, micro-pivot lookbacks (pivothigh/low 1, 1). Signals are evaluated exactly at the moment of pivot validation and plotted using a -1 bar offset to align perfectly with the exact price peak/trough.
Strict Exhaustion Filters: Divergences are only displayed if they occur within Overbought (≥70) or Oversold (≤30) territories. This drastically reduces false signals during choppy, sideways markets.
Customizable UI Toggles: Keep your chart workspace clean. You can toggle off the visual displays for the RSI or Stochastic panels individually with simple tick boxes in the settings menu.
💡 How to Trade with This Indicator
Trend Alignment: Identify the macro trend using the Fast and Slow MA crossovers. Look for price pullbacks toward the MA lines or the lower/upper Bollinger Bands.
Reversal Confirmation: Spot potential tops or bottoms when price prints higher highs/lower lows while the RSI plots a strict, overbought/oversold Divergence Arrow.
Execution Trigger: Use the Stochastic crossover (%K crossing %D) inside extreme zones to find the exact execution candle once the macro trend and RSI divergence have aligned.
🔔 Integrated Real-Time Alerts
This indicator comes pre-packaged with 6 essential alert conditions to keep you ahead of the market without constantly staring at the screen:
MA Golden Cross (Fast MA crosses above Slow MA)
MA Death Cross (Fast MA crosses below Slow MA)
RSI Bearish Divergence (Confirmed top reversal setup)
RSI Bullish Divergence (Confirmed bottom reversal setup)
Stoch Bullish Cross (%K crossing above %D)
Stoch Bearish Cross (%K crossing below %D)
Disclaimer: Past performance does not guarantee future results. Always practice proper risk management and utilize this script alongside your broader trading framework.
The daPisa + Simple RSI Div (Pine Script v6) is an all-in-one technical analysis dashboard designed to blend structural trend-following with high-probability momentum exhaustion signals. By housing Dual Moving Averages, Bollinger Bands, an optimized RSI Divergence engine, and a Stochastic Oscillator within a single script, it provides traders with a clean, clutter-free workspace to identify confluence zones, trend reversals, and volatility breakouts.
🛠️ Key Components & Architecture
1. Primary Chart Elements (Force Overlay)
Dual Moving Averages: Tracks structural market direction utilizing a Fast MA (50) and a Slow MA (120). Trend shifts are explicitly highlighted on your main chart using Blue Intersection Marks at crossover/crossunder points.
Price Bollinger Bands: Displays standard volatility bands (20 Length, 2 StdDev) directly on the price chart to gauge squeeze phases and extension targets.
2. Advanced RSI Engine (Sub-Chart)
Native-Style RSI line: Built using TradingView's default algorithm for seamless continuity.
Flexible RSI-Based MA Options: Replicates default TV features by allowing you to choose between SMA, EMA, or Bollinger Bands applied directly to the RSI value. This helps filter out momentum noise and signals line crossovers or volatility bands expansion within the oscillator panel itself.
Filtered Divergence Alerts: Triggers clean Bullish and Bearish divergence markers.
3. Secondary Momentum Panel
Stochastic Oscillator: A fully adjustable Stochastic (%K, %D) line designed to act as a secondary trigger engine for fine-tuning entry windows when price interacts with major support/resistance or structural MA lines.
🎯 What Makes This Script Unique?
Anti-Clutter Divergence Logic: Traditional divergence indicators often suffer from "signal crowding" or over-plotting. This script utilizes precise, micro-pivot lookbacks (pivothigh/low 1, 1). Signals are evaluated exactly at the moment of pivot validation and plotted using a -1 bar offset to align perfectly with the exact price peak/trough.
Strict Exhaustion Filters: Divergences are only displayed if they occur within Overbought (≥70) or Oversold (≤30) territories. This drastically reduces false signals during choppy, sideways markets.
Customizable UI Toggles: Keep your chart workspace clean. You can toggle off the visual displays for the RSI or Stochastic panels individually with simple tick boxes in the settings menu.
💡 How to Trade with This Indicator
Trend Alignment: Identify the macro trend using the Fast and Slow MA crossovers. Look for price pullbacks toward the MA lines or the lower/upper Bollinger Bands.
Reversal Confirmation: Spot potential tops or bottoms when price prints higher highs/lower lows while the RSI plots a strict, overbought/oversold Divergence Arrow.
Execution Trigger: Use the Stochastic crossover (%K crossing %D) inside extreme zones to find the exact execution candle once the macro trend and RSI divergence have aligned.
🔔 Integrated Real-Time Alerts
This indicator comes pre-packaged with 6 essential alert conditions to keep you ahead of the market without constantly staring at the screen:
MA Golden Cross (Fast MA crosses above Slow MA)
MA Death Cross (Fast MA crosses below Slow MA)
RSI Bearish Divergence (Confirmed top reversal setup)
RSI Bullish Divergence (Confirmed bottom reversal setup)
Stoch Bullish Cross (%K crossing above %D)
Stoch Bearish Cross (%K crossing below %D)
Disclaimer: Past performance does not guarantee future results. Always practice proper risk management and utilize this script alongside your broader trading framework.
Script de código aberto
Em verdadeiro espírito do TradingView, o criador deste script o tornou de código aberto, para que os traders possam revisar e verificar sua funcionalidade. Parabéns ao autor! Embora você possa usá-lo gratuitamente, lembre-se de que a republicação do código está sujeita às nossas Regras da Casa.

Aviso legal
As informações e publicações não se destinam a ser, e não constituem, conselhos ou recomendações financeiras, de investimento, comerciais ou de outro tipo fornecidos ou endossados pela TradingView. Leia mais nos Termos de Uso.
Script de código aberto
Em verdadeiro espírito do TradingView, o criador deste script o tornou de código aberto, para que os traders possam revisar e verificar sua funcionalidade. Parabéns ao autor! Embora você possa usá-lo gratuitamente, lembre-se de que a republicação do código está sujeita às nossas Regras da Casa.
Aviso legal
As informações e publicações não se destinam a ser, e não constituem, conselhos ou recomendações financeiras, de investimento, comerciais ou de outro tipo fornecidos ou endossados pela TradingView. Leia mais nos Termos de Uso.