BTC Bear-Low Band
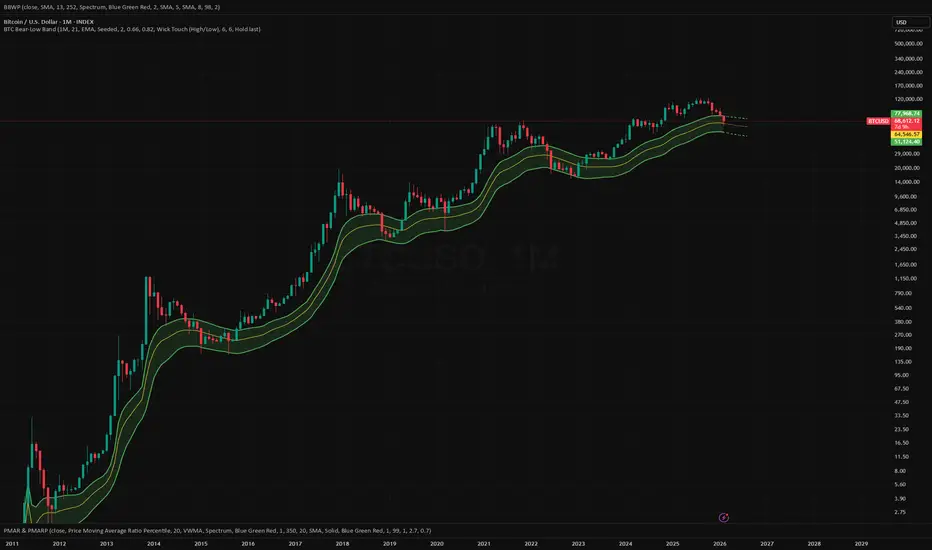
█ OVERVIEW
The BTC Bear-Low Band is a higher-timeframe moving-average band indicator designed to approximate Bitcoin's bear-market low regions. It calculates smoothed MA bands from High and Low prices on the Monthly (1M) timeframe and projects them forward using a curved, EMA-respecting extrapolation — giving you a visual estimate of where the band is heading.
This indicator is designed to be used on a logarithmic (log) price scale. Switch your chart to log scale for correct visual alignment of the bands with price action.
█ HOW IT WORKS
The indicator applies a configurable moving average (EMA, SMA, RMA, or WMA) to the High and Low price series on a chosen higher timeframe (default: 1M Monthly), then scales each band by a user-defined multiplier:
• Upper Band = MA(High) × Upper Multiplier (default 0.82)
• Lower Band = MA(Low) × Lower Multiplier (default 0.66)
• Midline = average of the two bands
An optional extra EMA smoothing pass can be applied to reduce noise.
█ FORWARD PROJECTION
When MA Type is set to EMA, the indicator projects the bands forward using the EMA recurrence formula, stepping through future bars to produce a curved dotted line. Two projection modes are available:
• Hold Last — assumes High/Low stay flat at their last value.
• Drift (Last Delta) — assumes High/Low continue at their last bar-to-bar rate of change.
For non-EMA types, a simpler linear last-delta projection is used as a fallback.
█ SETTINGS
Core
• Calculation Timeframe — Higher timeframe for MA calculation (default: 1M).
• MA Length — Lookback period (default: 21).
• MA Type — SMA / EMA / RMA / WMA (default: EMA).
• Start Mode — Strict, Seeded, or AdaptiveSMA (default: Seeded).
Strict requires full history; Seeded fills NaN with source; AdaptiveSMA grows the window.
• Extra Smoothing — Additional EMA smoothing pass, 1 = off (default: 2).
Band Placement
• Lower Multiplier — Scales the Low MA downward (default: 0.66).
• Upper Multiplier — Scales the High MA downward (default: 0.82).
Display
• Fill Band — Shaded area between upper and lower.
• Show Midline — Yellow midline between the bands.
Projection
• Show Projection — Curved dotted projection lines.
• Projection Bars — How many bars into the future (default: 6).
• Projection Segments — Smoothness of the curve (default: 6).
• Projection Assumption — Hold Last or Drift.
█ ALERTS
Four alert conditions are included:
1 — Lower Band — Cross Under — price crosses below the lower band.
2 — Lower Band — Cross Over — price crosses above the lower band.
3 — Upper Band — Cross Under — price crosses below the upper band.
4 — Upper Band — Cross Over — price crosses above the upper band.
The alert trigger uses either Close or Wick (High/Low) depending on the Trigger Basis setting.
█ HOW TO USE
1 — Apply to BTCUSD index on the Monthly (1M) chart with log scale enabled.
2 — The lower band historically approximates the zone where BTC tends to find major cycle lows.
3 — Use the projection to see where the band is heading — set "Drift" mode if you expect the trend to continue.
4 — Set up alerts on band crosses to get notified when price approaches the band zone.
The indicator can be applied to other assets and timeframes by adjusting the inputs, though it was designed with BTC monthly data in mind.
═════════════════════════════════════════════════════════════
Disclaimer: This indicator is provided for educational and informational purposes only. It does not constitute financial advice. Past performance does not guarantee future results. Always do your own research and use proper risk management.
The BTC Bear-Low Band is a higher-timeframe moving-average band indicator designed to approximate Bitcoin's bear-market low regions. It calculates smoothed MA bands from High and Low prices on the Monthly (1M) timeframe and projects them forward using a curved, EMA-respecting extrapolation — giving you a visual estimate of where the band is heading.
This indicator is designed to be used on a logarithmic (log) price scale. Switch your chart to log scale for correct visual alignment of the bands with price action.
█ HOW IT WORKS
The indicator applies a configurable moving average (EMA, SMA, RMA, or WMA) to the High and Low price series on a chosen higher timeframe (default: 1M Monthly), then scales each band by a user-defined multiplier:
• Upper Band = MA(High) × Upper Multiplier (default 0.82)
• Lower Band = MA(Low) × Lower Multiplier (default 0.66)
• Midline = average of the two bands
An optional extra EMA smoothing pass can be applied to reduce noise.
█ FORWARD PROJECTION
When MA Type is set to EMA, the indicator projects the bands forward using the EMA recurrence formula, stepping through future bars to produce a curved dotted line. Two projection modes are available:
• Hold Last — assumes High/Low stay flat at their last value.
• Drift (Last Delta) — assumes High/Low continue at their last bar-to-bar rate of change.
For non-EMA types, a simpler linear last-delta projection is used as a fallback.
█ SETTINGS
Core
• Calculation Timeframe — Higher timeframe for MA calculation (default: 1M).
• MA Length — Lookback period (default: 21).
• MA Type — SMA / EMA / RMA / WMA (default: EMA).
• Start Mode — Strict, Seeded, or AdaptiveSMA (default: Seeded).
Strict requires full history; Seeded fills NaN with source; AdaptiveSMA grows the window.
• Extra Smoothing — Additional EMA smoothing pass, 1 = off (default: 2).
Band Placement
• Lower Multiplier — Scales the Low MA downward (default: 0.66).
• Upper Multiplier — Scales the High MA downward (default: 0.82).
Display
• Fill Band — Shaded area between upper and lower.
• Show Midline — Yellow midline between the bands.
Projection
• Show Projection — Curved dotted projection lines.
• Projection Bars — How many bars into the future (default: 6).
• Projection Segments — Smoothness of the curve (default: 6).
• Projection Assumption — Hold Last or Drift.
█ ALERTS
Four alert conditions are included:
1 — Lower Band — Cross Under — price crosses below the lower band.
2 — Lower Band — Cross Over — price crosses above the lower band.
3 — Upper Band — Cross Under — price crosses below the upper band.
4 — Upper Band — Cross Over — price crosses above the upper band.
The alert trigger uses either Close or Wick (High/Low) depending on the Trigger Basis setting.
█ HOW TO USE
1 — Apply to BTCUSD index on the Monthly (1M) chart with log scale enabled.
2 — The lower band historically approximates the zone where BTC tends to find major cycle lows.
3 — Use the projection to see where the band is heading — set "Drift" mode if you expect the trend to continue.
4 — Set up alerts on band crosses to get notified when price approaches the band zone.
The indicator can be applied to other assets and timeframes by adjusting the inputs, though it was designed with BTC monthly data in mind.
═════════════════════════════════════════════════════════════
Disclaimer: This indicator is provided for educational and informational purposes only. It does not constitute financial advice. Past performance does not guarantee future results. Always do your own research and use proper risk management.

Aviso legal
As informações e publicações não se destinam a ser, e não constituem, conselhos ou recomendações financeiras, de investimento, comerciais ou de outro tipo fornecidos ou endossados pela TradingView. Leia mais nos Termos de Uso.
Aviso legal
As informações e publicações não se destinam a ser, e não constituem, conselhos ou recomendações financeiras, de investimento, comerciais ou de outro tipo fornecidos ou endossados pela TradingView. Leia mais nos Termos de Uso.