OPEN-SOURCE SCRIPT
ATR Swing Stop Loss (Long)
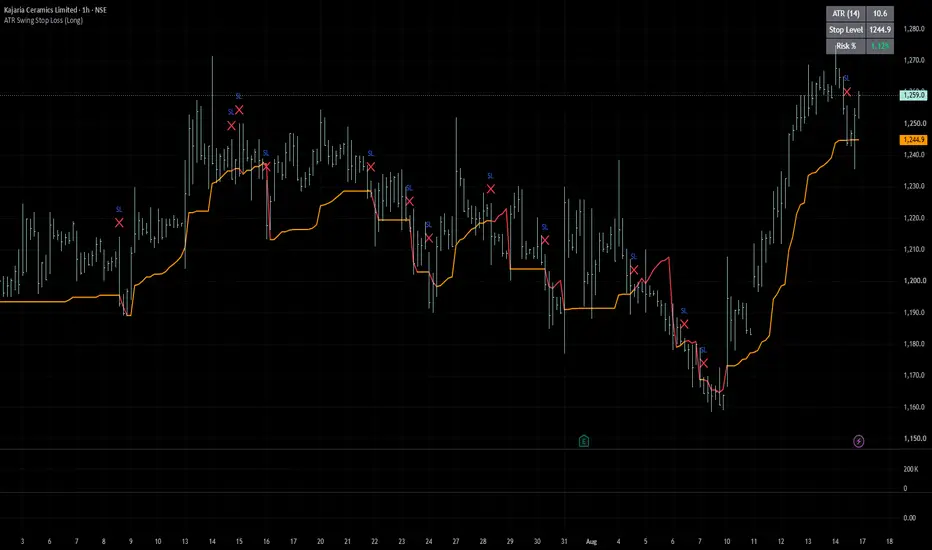
ATR Swing Stop Loss (Long) — Documentation
Purpose: Plots a trailing stop-loss line for long swing positions in Indian equities, based on Average True Range (ATR) volatility rather than a fixed percentage or arbitrary support level.
Core Logic
ATR Calculation — Measures 14-period average true range (Wilder's smoothing), capturing the stock's typical daily volatility.
Stop Level — Highest High (14 bars) − (ATR × 3.0). Anchoring to the recent high (not just current price) keeps the stop from tightening prematurely during a pullback within an uptrend.
Ratcheting — The stop only moves up, never down, as price makes new highs. This locks in gains as the trade progresses.
Reset on Breach — If a candle closes below the trailing stop, it's treated as a stop-out. The calculation resets fresh from that point (as if starting a new trade), and the line briefly turns red.
Inputs
Input Default Description
ATR Length 14 Lookback period for ATR and highest-high calculation
ATR Multiplier 3.0 Controls stop distance — lower = tighter stop, higher = more room
Show Info Table On Displays ATR value, stop price, and risk % in top-right corner
Show Stop-Hit Markers On Plots an "SL" cross marker when price closes below the stop
Visual Output
Orange line — active trailing stop
Red line/marker — stop was just breached (exit signal)
Info table — current ATR, stop level, and % distance from close to stop (useful for position sizing/risk calc)
Alerts
One built-in alert condition: "Long ATR Stop Hit" — fires when price closes below the trailing stop. Set this up via TradingView's Alert panel to get notified without watching the chart.
Usage Notes
Designed for daily timeframe swing trades; can be used intraday but multiplier/length may need adjustment for lower timeframes.
Works best on trending stocks — in sideways/choppy names it may whipsaw more often near the 3× ATR threshold.
Long-only. Does not track entry price or position size — it's a volatility-based exit reference, not a full position manager.
Not signal generation — this indicator does not tell you when to enter, only where to consider exiting once you're long.
Suggested Workflow
Add to your stock's daily chart alongside your entry signal/strategy.
Enter long per your own setup.
Use the plotted stop as your live stop-loss reference — adjust broker SL order as the line ratchets up.
Exit (or tighten manually) when the "SL" marker appears or your alert fires.
Script de código aberto
Em verdadeiro espírito do TradingView, o criador deste script o tornou de código aberto, para que os traders possam revisar e verificar sua funcionalidade. Parabéns ao autor! Embora você possa usá-lo gratuitamente, lembre-se de que a republicação do código está sujeita às nossas Regras da Casa.

Aviso legal
As informações e publicações não se destinam a ser, e não constituem, conselhos ou recomendações financeiras, de investimento, comerciais ou de outro tipo fornecidos ou endossados pela TradingView. Leia mais nos Termos de Uso.
Script de código aberto
Em verdadeiro espírito do TradingView, o criador deste script o tornou de código aberto, para que os traders possam revisar e verificar sua funcionalidade. Parabéns ao autor! Embora você possa usá-lo gratuitamente, lembre-se de que a republicação do código está sujeita às nossas Regras da Casa.
Aviso legal
As informações e publicações não se destinam a ser, e não constituem, conselhos ou recomendações financeiras, de investimento, comerciais ou de outro tipo fornecidos ou endossados pela TradingView. Leia mais nos Termos de Uso.