OPEN-SOURCE SCRIPT
Atualizado MoonBoys Line
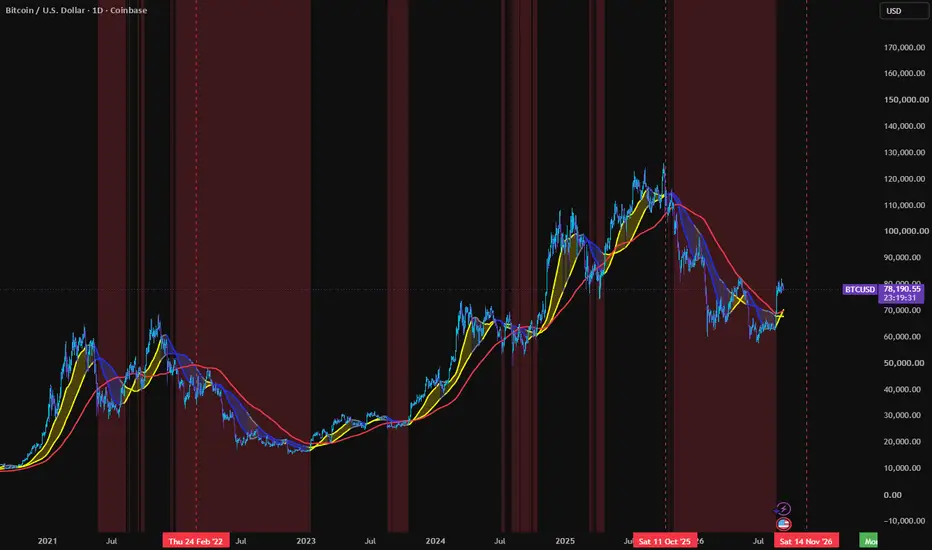
MoonBoys Line – Market Regime & Trend Confirmation Indicator
The MoonBoys Line is a simple but powerful trend-following system designed to identify bullish and bearish market regimes using key daily moving averages.
Built around the 44, 125, and 200-day SMAs, this indicator helps you quickly determine trend direction, strength, and key areas of support/resistance.
🔍 How It Works
44 SMA (Fast Line) → Short-term trend
125 SMA (Slow Line) → Mid-term trend (key reclaim level)
200 SMA (Red Line) → Macro trend / “fair value” baseline
🟡 Bullish Regime
Price is above both the 44 & 125 SMAs
Lines turn yellow
Band turns gold
Indicates strong upward momentum and trend continuation
🔵 Bearish Regime
Price is below both the 44 & 125 SMAs
Lines turn blue
Band turns blue
Signals downside momentum and potential continuation lower
⚪ Neutral / Chop
Price is between the 44 and 125
Lines turn gray
Indicates uncertainty or consolidation
🔴 Risk Zone (200 SMA)
When price falls below the 200 SMA, the background turns red
This highlights high-risk conditions and potential macro weakness
🧠 How We Use It (Moon Boys Strategy)
Reclaim of 125 SMA = early signal of bullish reversal
Holding above 44 SMA = trend strength confirmation
Losing 125 SMA = caution / trend weakening
Below 200 SMA = risk-off environment
This indicator is designed to keep you on the right side of the trend and avoid getting chopped up in uncertain markets.
The MoonBoys Line is a simple but powerful trend-following system designed to identify bullish and bearish market regimes using key daily moving averages.
Built around the 44, 125, and 200-day SMAs, this indicator helps you quickly determine trend direction, strength, and key areas of support/resistance.
🔍 How It Works
44 SMA (Fast Line) → Short-term trend
125 SMA (Slow Line) → Mid-term trend (key reclaim level)
200 SMA (Red Line) → Macro trend / “fair value” baseline
🟡 Bullish Regime
Price is above both the 44 & 125 SMAs
Lines turn yellow
Band turns gold
Indicates strong upward momentum and trend continuation
🔵 Bearish Regime
Price is below both the 44 & 125 SMAs
Lines turn blue
Band turns blue
Signals downside momentum and potential continuation lower
⚪ Neutral / Chop
Price is between the 44 and 125
Lines turn gray
Indicates uncertainty or consolidation
🔴 Risk Zone (200 SMA)
When price falls below the 200 SMA, the background turns red
This highlights high-risk conditions and potential macro weakness
🧠 How We Use It (Moon Boys Strategy)
Reclaim of 125 SMA = early signal of bullish reversal
Holding above 44 SMA = trend strength confirmation
Losing 125 SMA = caution / trend weakening
Below 200 SMA = risk-off environment
This indicator is designed to keep you on the right side of the trend and avoid getting chopped up in uncertain markets.
Notas de Lançamento
Optimizing the moving averaged:44 becomes 50
125 becomes 116
As per Gerhard, 116 is more profitable for bitcoin than 125. 50 is for trading perps, 116 is for trading spot.
Script de código aberto
Em verdadeiro espírito do TradingView, o criador deste script o tornou de código aberto, para que os traders possam revisar e verificar sua funcionalidade. Parabéns ao autor! Embora você possa usá-lo gratuitamente, lembre-se de que a republicação do código está sujeita às nossas Regras da Casa.

Not Financial Advice
Aviso legal
As informações e publicações não se destinam a ser, e não constituem, conselhos ou recomendações financeiras, de investimento, comerciais ou de outro tipo fornecidos ou endossados pela TradingView. Leia mais nos Termos de Uso.
Script de código aberto
Em verdadeiro espírito do TradingView, o criador deste script o tornou de código aberto, para que os traders possam revisar e verificar sua funcionalidade. Parabéns ao autor! Embora você possa usá-lo gratuitamente, lembre-se de que a republicação do código está sujeita às nossas Regras da Casa.
Not Financial Advice
Aviso legal
As informações e publicações não se destinam a ser, e não constituem, conselhos ou recomendações financeiras, de investimento, comerciais ou de outro tipo fornecidos ou endossados pela TradingView. Leia mais nos Termos de Uso.