OPEN-SOURCE SCRIPT
DNSE VN301!, BB - RSI Break Out Strategy
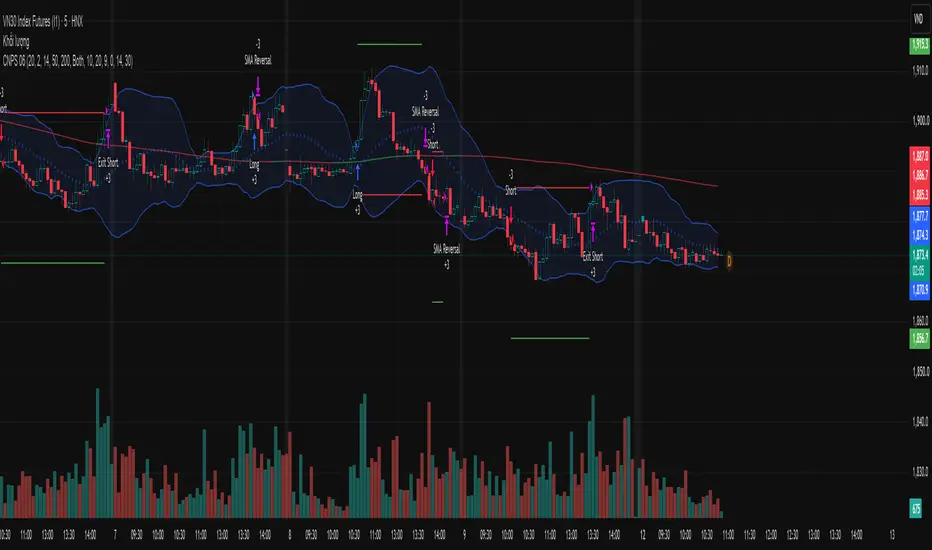
"Bollinger Bands RSI Trend Following" is a volatility-based trend-following strategy designed to capture strong directional price movements by combining Bollinger Band breakouts with RSI momentum confirmation. The strategy uses Bollinger Bands with a default SMA(20) basis and 2.0 standard deviations to identify bullish breakouts above the upper band and bearish breakouts below the lower band, while RSI(14) confirms momentum direction relative to its neutral level of 50.
To improve signal quality, the strategy incorporates an optional SMA(200) trend filter, allowing Long trades only when the SMA is rising and Short trades only when it is falling. By combining volatility breakouts, momentum confirmation, and broader trend direction, the strategy seeks to filter out weaker signals and reduce counter-trend entries. It also includes configurable stop loss, take profit, trading session, trade direction, and automatic end-of-session position closure for disciplined risk management.
Strategy settings and configuration:
Chart timeframe: recommended 5-minute chart
Position size: 3 contracts
Bollinger Bands length: 20
Bollinger Bands multiplier: 2.0
RSI length: 14
RSI neutral level: 50
SMA length: 200
Stop loss: 10 points
Take profit: 20 points
SMA trend filter: On / Off
Take profit: On / Off
Time filter: On / Off
Trading session: 09:00 – 14:30
Trade direction: Long / Short / Both
Default script settings:
The strategy calculates Bollinger Bands using the SMA(20) of the closing price. The upper and lower bands are created by adding or subtracting two standard deviations around the middle line.
When the closing price breaks above the upper Bollinger Band, the market may be breaking out to the upside. When the closing price breaks below the lower Bollinger Band, selling pressure may be taking control.
RSI(14) is used to confirm the momentum behind the breakout signal. When RSI is above 50, bullish momentum may be taking control. When RSI is below 50, bearish momentum may be taking control.
When the SMA(200) trend filter is enabled, the script only allows Long trades when SMA(200) is rising and only allows Short trades when SMA(200) is falling. When the SMA filter is disabled, the strategy can trade both directions based only on Bollinger Bands breakout signals combined with RSI confirmation.
This design is intentional. Bollinger Bands confirm that price has moved outside its normal volatility range. RSI confirms momentum in the same direction. SMA(200) helps filter the larger trend and reduce counter-trend signals.
Users can add the built-in Bollinger Bands indicator with Length 20 and Multiplier 2.0, along with RSI length 14, on TradingView to visually monitor the signal.
Entry and exit rules:
Long entry:
Closing price > upper Bollinger Band
AND RSI(14) > 50
AND SMA(200) is rising, if the SMA filter is enabled
AND the signal appears during the trading session
AND trade direction allows Long entries
Long exit:
Stop loss: 10 points from entry price
Take profit: 20 points from entry price, if enabled
Opposite breakout signal appears with RSI reversal
Reversal when a valid Short signal appears
Automatic position close at the end of the trading session
Short entry:
Closing price < lower Bollinger Band
AND RSI(14) < 50
AND SMA(200) is falling, if the SMA filter is enabled
AND the signal appears during the trading session
AND trade direction allows Short entries
Short exit:
Stop loss: 10 points from entry price
Take profit: 20 points from entry price, if enabled
Opposite breakout signal appears with RSI reversal
Reversal when a valid Long signal appears
Automatic position close at the end of the trading session
Risk disclaimer:
Futures trading involves a high level of risk and prices can move sharply. This script is provided for reference, research, and backtesting purposes only. Users should fully understand derivatives trading, their own risk tolerance, and the strategy logic before applying it to live trading.
All investment decisions are the responsibility of the user. phaisinh.online is not responsible for any losses arising from the use of this strategy in real trading. Past performance does not guarantee future results.
____________________________________________________________
"Bollinger Bands RSI Trend Following" là một chiến lược giao dịch theo xu hướng dựa trên biến động, được thiết kế nhằm nắm bắt các chuyển động giá mạnh theo một hướng bằng cách kết hợp tín hiệu bứt phá từ Bollinger Bands với xác nhận động lượng từ RSI. Chiến lược sử dụng Bollinger Bands với đường cơ sở mặc định là SMA(20) và 2,0 độ lệch chuẩn để xác định tín hiệu bứt phá tăng khi giá đóng cửa vượt lên trên dải trên và tín hiệu bứt phá giảm khi giá đóng cửa xuống dưới dải dưới. Trong khi đó, RSI(14) xác nhận hướng động lượng dựa trên mức trung tính 50.
Để nâng cao chất lượng tín hiệu, chiến lược tích hợp bộ lọc xu hướng SMA(200) tùy chọn, chỉ cho phép giao dịch Long khi SMA đang dốc lên và giao dịch Short khi SMA đang dốc xuống. Bằng cách kết hợp tín hiệu bứt phá theo biến động, xác nhận động lượng và hướng xu hướng tổng thể, chiến lược hướng tới việc lọc các tín hiệu yếu và giảm thiểu các lệnh giao dịch ngược xu hướng. Chiến lược cũng bao gồm các tùy chọn Stop Loss, Take Profit, khung thời gian giao dịch, hướng giao dịch và cơ chế tự động đóng toàn bộ vị thế khi kết thúc phiên, nhằm đảm bảo quản trị rủi ro một cách chặt chẽ và có kỷ luật.
Cài đặt & cấu hình chiến lược:
Biểu đồ: khuyến nghị khung 5 phút
Khối lượng giao dịch: 3 hợp đồng
Chu kỳ Bollinger Bands: 20
Hệ số nhân Bollinger Bands: 2.0
Chu kỳ RSI: 14
Ngưỡng trung tính RSI: 50
Chu kỳ SMA: 200
Cắt lỗ: 10 điểm
Chốt lời: 20 điểm
Bộ lọc xu hướng SMA: Bật / Tắt
Dùng chốt lời: Bật / Tắt
Bộ lọc giờ: Bật / Tắt
Khung giờ giao dịch: 09:00 – 14:30
Chiều giao dịch: Mua / Bán / Cả hai
Cài đặt mặc định của script:
Chiến lược tính toán Bollinger Bands dựa trên đường SMA(20) của giá đóng cửa. Dải trên và dải dưới được tạo bằng cách cộng hoặc trừ hai độ lệch chuẩn quanh đường giữa.
Khi giá đóng cửa vượt lên trên dải trên Bollinger Bands, thị trường có thể đang bứt phá theo chiều tăng. Khi giá đóng cửa xuyên xuống dưới dải dưới Bollinger Bands, áp lực bán có thể đang chiếm ưu thế.
RSI(14) được dùng để xác nhận động lượng của tín hiệu breakout. Khi RSI nằm trên 50, động lượng tăng có thể đang chiếm ưu thế. Khi RSI nằm dưới 50, động lượng giảm có thể đang chiếm ưu thế.
Khi bật bộ lọc xu hướng SMA(200), script chỉ cho phép lệnh Mua khi SMA(200) dốc lên và chỉ cho phép lệnh Bán khi SMA(200) dốc xuống. Khi tắt bộ lọc SMA, chiến lược có thể giao dịch cả hai chiều chỉ dựa trên tín hiệu Bollinger Bands kết hợp RSI.
Thiết kế này có chủ đích. Bollinger Bands xác nhận giá đã thoát khỏi vùng biến động thông thường. RSI xác nhận động lượng cùng chiều. SMA(200) giúp lọc xu hướng lớn để hạn chế các tín hiệu ngược chiều.
Người dùng có thể thêm chỉ báo Bollinger Bands với Length 20, Multiplier 2.0 và RSI chu kỳ 14 trên TradingView để quan sát tín hiệu trực quan.
Điều kiện vào và thoát lệnh:
Vào lệnh Mua:
Giá đóng cửa > dải trên Bollinger Bands
VÀ RSI(14) > 50
VÀ SMA(200) dốc lên, nếu bật bộ lọc SMA
VÀ tín hiệu xuất hiện trong khung giờ giao dịch
VÀ chiều giao dịch cho phép lệnh Mua
Thoát lệnh Mua:
Cắt lỗ: 10 điểm từ giá vào lệnh
Chốt lời: 20 điểm từ giá vào lệnh, nếu bật
Có tín hiệu breakout ngược chiều kết hợp RSI đảo chiều
Đảo chiều khi xuất hiện tín hiệu Bán hợp lệ
Tự động đóng lệnh khi hết khung giờ giao dịch
Vào lệnh Bán:
Giá đóng cửa < dải dưới Bollinger Bands
VÀ RSI(14) < 50
VÀ SMA(200) dốc xuống, nếu bật bộ lọc SMA
VÀ tín hiệu xuất hiện trong khung giờ giao dịch
VÀ chiều giao dịch cho phép lệnh Bán
Thoát lệnh Bán:
Cắt lỗ: 10 điểm từ giá vào lệnh
Chốt lời: 20 điểm từ giá vào lệnh, nếu bật
Có tín hiệu breakout ngược chiều kết hợp RSI đảo chiều
Đảo chiều khi xuất hiện tín hiệu Mua hợp lệ
Tự động đóng lệnh khi hết khung giờ giao dịch
Tuyên bố rủi ro:
Giao dịch hợp đồng tương lai có mức độ rủi ro cao và giá có thể biến động mạnh. Script này chỉ phục vụ mục đích tham khảo, nghiên cứu và kiểm thử. Người dùng cần hiểu rõ giao dịch phái sinh, khẩu vị rủi ro cá nhân và logic của chiến lược trước khi áp dụng vào giao dịch thực tế.
Mọi quyết định đầu tư thuộc trách nhiệm của người dùng. phaisinh.online không chịu trách nhiệm cho bất kỳ khoản lỗ nào phát sinh từ việc sử dụng chiến lược này trong giao dịch thực tế. Hiệu quả trong quá khứ không đảm bảo kết quả trong tương lai.
To improve signal quality, the strategy incorporates an optional SMA(200) trend filter, allowing Long trades only when the SMA is rising and Short trades only when it is falling. By combining volatility breakouts, momentum confirmation, and broader trend direction, the strategy seeks to filter out weaker signals and reduce counter-trend entries. It also includes configurable stop loss, take profit, trading session, trade direction, and automatic end-of-session position closure for disciplined risk management.
Strategy settings and configuration:
Chart timeframe: recommended 5-minute chart
Position size: 3 contracts
Bollinger Bands length: 20
Bollinger Bands multiplier: 2.0
RSI length: 14
RSI neutral level: 50
SMA length: 200
Stop loss: 10 points
Take profit: 20 points
SMA trend filter: On / Off
Take profit: On / Off
Time filter: On / Off
Trading session: 09:00 – 14:30
Trade direction: Long / Short / Both
Default script settings:
The strategy calculates Bollinger Bands using the SMA(20) of the closing price. The upper and lower bands are created by adding or subtracting two standard deviations around the middle line.
When the closing price breaks above the upper Bollinger Band, the market may be breaking out to the upside. When the closing price breaks below the lower Bollinger Band, selling pressure may be taking control.
RSI(14) is used to confirm the momentum behind the breakout signal. When RSI is above 50, bullish momentum may be taking control. When RSI is below 50, bearish momentum may be taking control.
When the SMA(200) trend filter is enabled, the script only allows Long trades when SMA(200) is rising and only allows Short trades when SMA(200) is falling. When the SMA filter is disabled, the strategy can trade both directions based only on Bollinger Bands breakout signals combined with RSI confirmation.
This design is intentional. Bollinger Bands confirm that price has moved outside its normal volatility range. RSI confirms momentum in the same direction. SMA(200) helps filter the larger trend and reduce counter-trend signals.
Users can add the built-in Bollinger Bands indicator with Length 20 and Multiplier 2.0, along with RSI length 14, on TradingView to visually monitor the signal.
Entry and exit rules:
Long entry:
Closing price > upper Bollinger Band
AND RSI(14) > 50
AND SMA(200) is rising, if the SMA filter is enabled
AND the signal appears during the trading session
AND trade direction allows Long entries
Long exit:
Stop loss: 10 points from entry price
Take profit: 20 points from entry price, if enabled
Opposite breakout signal appears with RSI reversal
Reversal when a valid Short signal appears
Automatic position close at the end of the trading session
Short entry:
Closing price < lower Bollinger Band
AND RSI(14) < 50
AND SMA(200) is falling, if the SMA filter is enabled
AND the signal appears during the trading session
AND trade direction allows Short entries
Short exit:
Stop loss: 10 points from entry price
Take profit: 20 points from entry price, if enabled
Opposite breakout signal appears with RSI reversal
Reversal when a valid Long signal appears
Automatic position close at the end of the trading session
Risk disclaimer:
Futures trading involves a high level of risk and prices can move sharply. This script is provided for reference, research, and backtesting purposes only. Users should fully understand derivatives trading, their own risk tolerance, and the strategy logic before applying it to live trading.
All investment decisions are the responsibility of the user. phaisinh.online is not responsible for any losses arising from the use of this strategy in real trading. Past performance does not guarantee future results.
____________________________________________________________
"Bollinger Bands RSI Trend Following" là một chiến lược giao dịch theo xu hướng dựa trên biến động, được thiết kế nhằm nắm bắt các chuyển động giá mạnh theo một hướng bằng cách kết hợp tín hiệu bứt phá từ Bollinger Bands với xác nhận động lượng từ RSI. Chiến lược sử dụng Bollinger Bands với đường cơ sở mặc định là SMA(20) và 2,0 độ lệch chuẩn để xác định tín hiệu bứt phá tăng khi giá đóng cửa vượt lên trên dải trên và tín hiệu bứt phá giảm khi giá đóng cửa xuống dưới dải dưới. Trong khi đó, RSI(14) xác nhận hướng động lượng dựa trên mức trung tính 50.
Để nâng cao chất lượng tín hiệu, chiến lược tích hợp bộ lọc xu hướng SMA(200) tùy chọn, chỉ cho phép giao dịch Long khi SMA đang dốc lên và giao dịch Short khi SMA đang dốc xuống. Bằng cách kết hợp tín hiệu bứt phá theo biến động, xác nhận động lượng và hướng xu hướng tổng thể, chiến lược hướng tới việc lọc các tín hiệu yếu và giảm thiểu các lệnh giao dịch ngược xu hướng. Chiến lược cũng bao gồm các tùy chọn Stop Loss, Take Profit, khung thời gian giao dịch, hướng giao dịch và cơ chế tự động đóng toàn bộ vị thế khi kết thúc phiên, nhằm đảm bảo quản trị rủi ro một cách chặt chẽ và có kỷ luật.
Cài đặt & cấu hình chiến lược:
Biểu đồ: khuyến nghị khung 5 phút
Khối lượng giao dịch: 3 hợp đồng
Chu kỳ Bollinger Bands: 20
Hệ số nhân Bollinger Bands: 2.0
Chu kỳ RSI: 14
Ngưỡng trung tính RSI: 50
Chu kỳ SMA: 200
Cắt lỗ: 10 điểm
Chốt lời: 20 điểm
Bộ lọc xu hướng SMA: Bật / Tắt
Dùng chốt lời: Bật / Tắt
Bộ lọc giờ: Bật / Tắt
Khung giờ giao dịch: 09:00 – 14:30
Chiều giao dịch: Mua / Bán / Cả hai
Cài đặt mặc định của script:
Chiến lược tính toán Bollinger Bands dựa trên đường SMA(20) của giá đóng cửa. Dải trên và dải dưới được tạo bằng cách cộng hoặc trừ hai độ lệch chuẩn quanh đường giữa.
Khi giá đóng cửa vượt lên trên dải trên Bollinger Bands, thị trường có thể đang bứt phá theo chiều tăng. Khi giá đóng cửa xuyên xuống dưới dải dưới Bollinger Bands, áp lực bán có thể đang chiếm ưu thế.
RSI(14) được dùng để xác nhận động lượng của tín hiệu breakout. Khi RSI nằm trên 50, động lượng tăng có thể đang chiếm ưu thế. Khi RSI nằm dưới 50, động lượng giảm có thể đang chiếm ưu thế.
Khi bật bộ lọc xu hướng SMA(200), script chỉ cho phép lệnh Mua khi SMA(200) dốc lên và chỉ cho phép lệnh Bán khi SMA(200) dốc xuống. Khi tắt bộ lọc SMA, chiến lược có thể giao dịch cả hai chiều chỉ dựa trên tín hiệu Bollinger Bands kết hợp RSI.
Thiết kế này có chủ đích. Bollinger Bands xác nhận giá đã thoát khỏi vùng biến động thông thường. RSI xác nhận động lượng cùng chiều. SMA(200) giúp lọc xu hướng lớn để hạn chế các tín hiệu ngược chiều.
Người dùng có thể thêm chỉ báo Bollinger Bands với Length 20, Multiplier 2.0 và RSI chu kỳ 14 trên TradingView để quan sát tín hiệu trực quan.
Điều kiện vào và thoát lệnh:
Vào lệnh Mua:
Giá đóng cửa > dải trên Bollinger Bands
VÀ RSI(14) > 50
VÀ SMA(200) dốc lên, nếu bật bộ lọc SMA
VÀ tín hiệu xuất hiện trong khung giờ giao dịch
VÀ chiều giao dịch cho phép lệnh Mua
Thoát lệnh Mua:
Cắt lỗ: 10 điểm từ giá vào lệnh
Chốt lời: 20 điểm từ giá vào lệnh, nếu bật
Có tín hiệu breakout ngược chiều kết hợp RSI đảo chiều
Đảo chiều khi xuất hiện tín hiệu Bán hợp lệ
Tự động đóng lệnh khi hết khung giờ giao dịch
Vào lệnh Bán:
Giá đóng cửa < dải dưới Bollinger Bands
VÀ RSI(14) < 50
VÀ SMA(200) dốc xuống, nếu bật bộ lọc SMA
VÀ tín hiệu xuất hiện trong khung giờ giao dịch
VÀ chiều giao dịch cho phép lệnh Bán
Thoát lệnh Bán:
Cắt lỗ: 10 điểm từ giá vào lệnh
Chốt lời: 20 điểm từ giá vào lệnh, nếu bật
Có tín hiệu breakout ngược chiều kết hợp RSI đảo chiều
Đảo chiều khi xuất hiện tín hiệu Mua hợp lệ
Tự động đóng lệnh khi hết khung giờ giao dịch
Tuyên bố rủi ro:
Giao dịch hợp đồng tương lai có mức độ rủi ro cao và giá có thể biến động mạnh. Script này chỉ phục vụ mục đích tham khảo, nghiên cứu và kiểm thử. Người dùng cần hiểu rõ giao dịch phái sinh, khẩu vị rủi ro cá nhân và logic của chiến lược trước khi áp dụng vào giao dịch thực tế.
Mọi quyết định đầu tư thuộc trách nhiệm của người dùng. phaisinh.online không chịu trách nhiệm cho bất kỳ khoản lỗ nào phát sinh từ việc sử dụng chiến lược này trong giao dịch thực tế. Hiệu quả trong quá khứ không đảm bảo kết quả trong tương lai.
Script de código aberto
Em verdadeiro espírito do TradingView, o criador deste script o tornou de código aberto, para que os traders possam revisar e verificar sua funcionalidade. Parabéns ao autor! Embora você possa usá-lo gratuitamente, lembre-se de que a republicação do código está sujeita às nossas Regras da Casa.

Mr. Khôi Nguyên; phụ trách sản phẩm tích hợp TradingView
E: nguyen.hoang@dnse.com.vn
Linkedin: linkedin.com/in/khoi-nguyen-hoang-672301139/
E: nguyen.hoang@dnse.com.vn
Linkedin: linkedin.com/in/khoi-nguyen-hoang-672301139/
Aviso legal
As informações e publicações não se destinam a ser, e não constituem, conselhos ou recomendações financeiras, de investimento, comerciais ou de outro tipo fornecidos ou endossados pela TradingView. Leia mais nos Termos de Uso.
Script de código aberto
Em verdadeiro espírito do TradingView, o criador deste script o tornou de código aberto, para que os traders possam revisar e verificar sua funcionalidade. Parabéns ao autor! Embora você possa usá-lo gratuitamente, lembre-se de que a republicação do código está sujeita às nossas Regras da Casa.
Mr. Khôi Nguyên; phụ trách sản phẩm tích hợp TradingView
E: nguyen.hoang@dnse.com.vn
Linkedin: linkedin.com/in/khoi-nguyen-hoang-672301139/
E: nguyen.hoang@dnse.com.vn
Linkedin: linkedin.com/in/khoi-nguyen-hoang-672301139/
Aviso legal
As informações e publicações não se destinam a ser, e não constituem, conselhos ou recomendações financeiras, de investimento, comerciais ou de outro tipo fornecidos ou endossados pela TradingView. Leia mais nos Termos de Uso.