OPEN-SOURCE SCRIPT
Atualizado Overnight vs Intra-day Performance
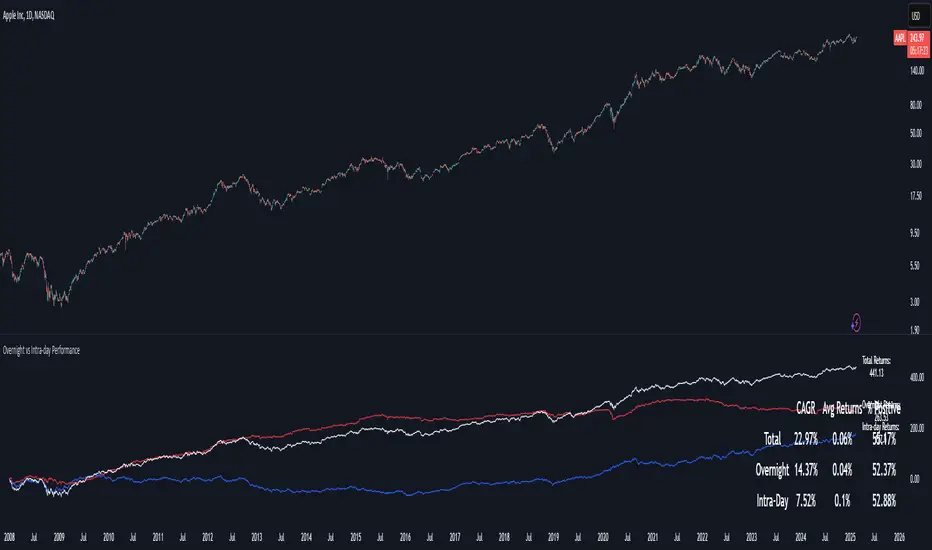
█ STRATEGY OVERVIEW
The "Overnight vs Intra-day Performance" indicator quantifies price behaviour differences between trading hours and overnight periods. It calculates cumulative returns, compound growth rates, and visualizes performance components across user-defined time windows. Designed for analytical use, it helps identify whether returns are primarily generated during market hours or overnight sessions.
█ USAGE
Use this indicator on Stocks and ETFs to visualise and compare intra-day vs overnight performance
█ KEY FEATURES
█ VISUALIZATION SYSTEM
1. Time-Series
2. Summary Table
3. Price Chart Labels
█ PURPOSE
█ IDEAL USERS
1. Portfolio Managers
2. Quantitative Researchers
3. Market Microstructure Analysts
4. Day Traders
The "Overnight vs Intra-day Performance" indicator quantifies price behaviour differences between trading hours and overnight periods. It calculates cumulative returns, compound growth rates, and visualizes performance components across user-defined time windows. Designed for analytical use, it helps identify whether returns are primarily generated during market hours or overnight sessions.
█ USAGE
Use this indicator on Stocks and ETFs to visualise and compare intra-day vs overnight performance
█ KEY FEATURES
- Return Segmentation: Separates total returns into overnight (close-to-open) and intraday (open-to-close) components
Growth Tracking: Shows simple cumulative returns and compound annual growth rates (CAGR)
█ VISUALIZATION SYSTEM
1. Time-Series
- Overnight Returns (Red)
- Intraday Returns (Blue)
- Total Returns (White)
2. Summary Table
- Displays CAGR
3. Price Chart Labels
- Floating annotations showing absolute returns and CAGR
- Color-coded to match plot series
█ PURPOSE
- Quantify market behaviour disparities between active trading sessions and overnight positioning
- Provide institutional-grade attribution analysis for returns generation
- Enable tactical adjustment of trading schedules based on historical performance patterns
- Serve as foundational research for session-specific trading strategies
█ IDEAL USERS
1. Portfolio Managers
- Analyse overnight risk exposure across holdings
- Optimize execution timing based on return distributions
2. Quantitative Researchers
- Study market microstructure through time-segmented returns
- Develop alpha models leveraging session-specific anomalies
3. Market Microstructure Analysts
- Identify liquidity patterns in overnight vs daytime sessions
- Research ETF premium/discount mechanics
4. Day Traders
- Align trading hours with highest probability return windows
- Avoid overnight gaps through informed position sizing
Notas de Lançamento
Added average returns and percent positiveScript de código aberto
Em verdadeiro espírito do TradingView, o criador deste script o tornou de código aberto, para que os traders possam revisar e verificar sua funcionalidade. Parabéns ao autor! Embora você possa usá-lo gratuitamente, lembre-se de que a republicação do código está sujeita às nossas Regras da Casa.

Aviso legal
As informações e publicações não se destinam a ser, e não constituem, conselhos ou recomendações financeiras, de investimento, comerciais ou de outro tipo fornecidos ou endossados pela TradingView. Leia mais nos Termos de Uso.
Script de código aberto
Em verdadeiro espírito do TradingView, o criador deste script o tornou de código aberto, para que os traders possam revisar e verificar sua funcionalidade. Parabéns ao autor! Embora você possa usá-lo gratuitamente, lembre-se de que a republicação do código está sujeita às nossas Regras da Casa.
Aviso legal
As informações e publicações não se destinam a ser, e não constituem, conselhos ou recomendações financeiras, de investimento, comerciais ou de outro tipo fornecidos ou endossados pela TradingView. Leia mais nos Termos de Uso.