STOC - EMA + RSI Pullback Trader
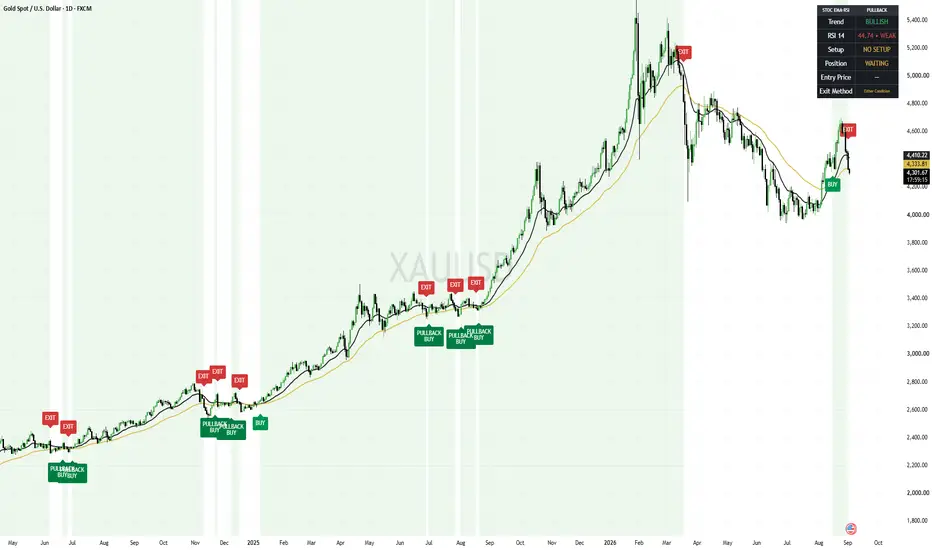
The STOC – EMA RSI Pullback Trader is a long-only trend-following indicator designed to identify potential entries during bullish trends and controlled pullbacks.
Instead of chasing price after a large upward move, the indicator looks for opportunities when price returns toward the faster trend average while the broader trend remains positive.
How it works
The indicator combines:
* 20 EMA for identifying short-term momentum and pullback areas.
* 50 EMA for determining the broader trend.
* RSI for confirming that momentum remains bullish.
An initial Buy signal can appear when the 20 EMA crosses above the 50 EMA and RSI confirms positive momentum.
After the bullish trend is established, a Pullback Buy signal can appear when price revisits the 20 EMA and subsequently confirms strength above it while RSI remains above the selected bullish threshold.
Exit methods
The indicator provides three selectable exit methods:
* 20 EMA crossing below the 50 EMA.
* Price closing below the 50 EMA.
* Either condition, whichever occurs first.
The “Either Condition” setting offers more defensive trade management, while the EMA crossover exit generally gives the trend more room to develop.
Key features
* Initial EMA crossover entries.
* Trend-continuation pullback entries.
* RSI momentum confirmation.
* Adjustable EMA and RSI settings.
* Optional requirement for rising RSI.
* Multiple pullback-confirmation methods.
* Selectable exit logic.
* Buy, Pullback Buy and Exit labels.
* Active-trade background highlighting.
* Trend and trade-status dashboard.
* TradingView alert conditions.
* Dynamic JSON messages for webhook integration.
* Works across equities, indices, futures, forex and cryptocurrencies.
How to use
The indicator is best used on instruments displaying a clear directional trend.
A valid bullish environment generally exists when:
* The 20 EMA is above the 50 EMA.
* Price is trading above the 50 EMA.
* RSI is above 50.
The initial Buy signal identifies a possible new bullish trend. Pullback Buy signals identify potential re-entry opportunities after price returns toward the 20 EMA without invalidating the broader trend.
Avoid treating every signal as an automatic trade. Consider confirming the setup using:
* Higher-timeframe trend direction.
* Support and resistance.
* Breakout structure.
* Volume expansion.
* Relative strength.
* Overall market and sector conditions.
Suggested timeframes
* Daily and weekly charts: positional and swing trading.
* 1-hour and 4-hour charts: shorter-term swing trading.
* 5-minute and 15-minute charts: intraday trading with additional market and volume confirmation.
Alerts
Create a TradingView alert using “Any alert() function call” to receive the indicator’s dynamic Buy and Exit messages. Standard Buy and Exit alert conditions are also available.
Disclaimer
This indicator is provided solely for educational and informational purposes. It does not constitute investment advice, financial advice, trading advice or a recommendation to buy or sell any security or financial instrument.
Trading and investing involve substantial risk, including the possible loss of capital. Historical signals and past performance do not guarantee future results. Always perform your own analysis, apply appropriate position sizing and risk management, and consult a qualified financial professional when necessary.
Instead of chasing price after a large upward move, the indicator looks for opportunities when price returns toward the faster trend average while the broader trend remains positive.
How it works
The indicator combines:
* 20 EMA for identifying short-term momentum and pullback areas.
* 50 EMA for determining the broader trend.
* RSI for confirming that momentum remains bullish.
An initial Buy signal can appear when the 20 EMA crosses above the 50 EMA and RSI confirms positive momentum.
After the bullish trend is established, a Pullback Buy signal can appear when price revisits the 20 EMA and subsequently confirms strength above it while RSI remains above the selected bullish threshold.
Exit methods
The indicator provides three selectable exit methods:
* 20 EMA crossing below the 50 EMA.
* Price closing below the 50 EMA.
* Either condition, whichever occurs first.
The “Either Condition” setting offers more defensive trade management, while the EMA crossover exit generally gives the trend more room to develop.
Key features
* Initial EMA crossover entries.
* Trend-continuation pullback entries.
* RSI momentum confirmation.
* Adjustable EMA and RSI settings.
* Optional requirement for rising RSI.
* Multiple pullback-confirmation methods.
* Selectable exit logic.
* Buy, Pullback Buy and Exit labels.
* Active-trade background highlighting.
* Trend and trade-status dashboard.
* TradingView alert conditions.
* Dynamic JSON messages for webhook integration.
* Works across equities, indices, futures, forex and cryptocurrencies.
How to use
The indicator is best used on instruments displaying a clear directional trend.
A valid bullish environment generally exists when:
* The 20 EMA is above the 50 EMA.
* Price is trading above the 50 EMA.
* RSI is above 50.
The initial Buy signal identifies a possible new bullish trend. Pullback Buy signals identify potential re-entry opportunities after price returns toward the 20 EMA without invalidating the broader trend.
Avoid treating every signal as an automatic trade. Consider confirming the setup using:
* Higher-timeframe trend direction.
* Support and resistance.
* Breakout structure.
* Volume expansion.
* Relative strength.
* Overall market and sector conditions.
Suggested timeframes
* Daily and weekly charts: positional and swing trading.
* 1-hour and 4-hour charts: shorter-term swing trading.
* 5-minute and 15-minute charts: intraday trading with additional market and volume confirmation.
Alerts
Create a TradingView alert using “Any alert() function call” to receive the indicator’s dynamic Buy and Exit messages. Standard Buy and Exit alert conditions are also available.
Disclaimer
This indicator is provided solely for educational and informational purposes. It does not constitute investment advice, financial advice, trading advice or a recommendation to buy or sell any security or financial instrument.
Trading and investing involve substantial risk, including the possible loss of capital. Historical signals and past performance do not guarantee future results. Always perform your own analysis, apply appropriate position sizing and risk management, and consult a qualified financial professional when necessary.

Building STOC: Systematic and Rule Based Trading - Crypto, Commodities, India & Global Investments.
Aviso legal
As informações e publicações não se destinam a ser, e não constituem, conselhos ou recomendações financeiras, de investimento, comerciais ou de outro tipo fornecidos ou endossados pela TradingView. Leia mais nos Termos de Uso.
Building STOC: Systematic and Rule Based Trading - Crypto, Commodities, India & Global Investments.
Aviso legal
As informações e publicações não se destinam a ser, e não constituem, conselhos ou recomendações financeiras, de investimento, comerciais ou de outro tipo fornecidos ou endossados pela TradingView. Leia mais nos Termos de Uso.