OPEN-SOURCE SCRIPT
Atualizado Impulse-Aware Fibonacci
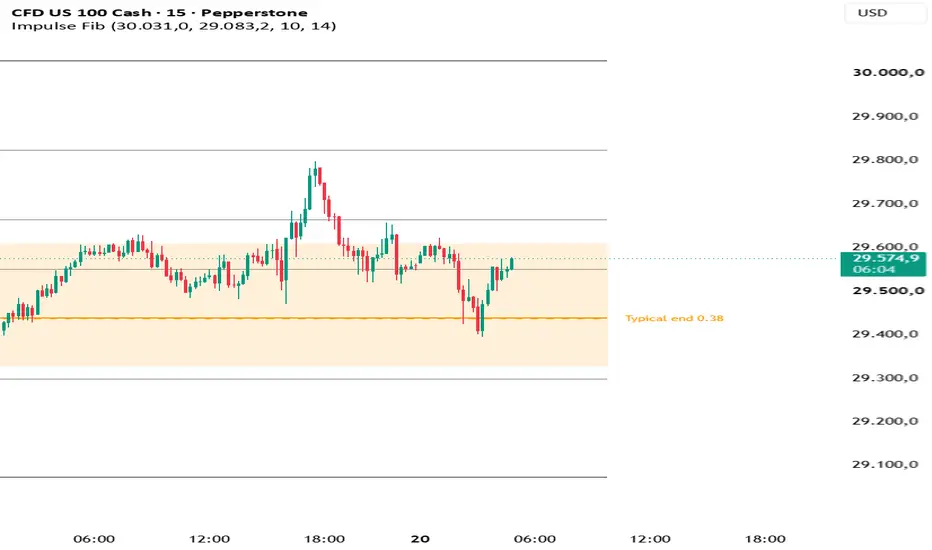
Impulse-Aware Fibonacci
A Fibonacci retracement tool that classifies the impulse you select and shows, on every level, how often price retraced that far after impulses of the same type.
Not every impulse retraces the same way. A long impulse built over many bars behaves very differently from a short, sharp spike. This tool measures the impulse you mark, places it in one of four types and draws the retracement levels together with real statistics for that type.
HOW TO USE IT
1. Add the indicator to the chart. TradingView asks you to click two points: the start and the end of the impulse.
2. The levels are drawn as in the standard Fibonacci retracement. You can drag either point later to adjust them.
3. Add the indicator once per impulse if you want to analyze several.
HOW THE IMPULSE IS CLASSIFIED
• Size: the distance of the impulse measured in ATR (14) at its start.
• Duration: the number of bars from start to end.
• Long impulse = 4.8 ATR or more. Fast impulse = 10 bars or fewer. (These are the median values in the statistics.)
This gives four types: Long and slow, Long and fast, Short and slow, Short and fast. The type, its size in ATR and its duration are shown at the end of the impulse.
WHAT IT DRAWS
• Standard levels: 0, 0.236, 0.382, 0.5, 0.618, 0.786 and 1.
• On each level: the percentage of retracements that reached it after impulses of the same type.
• Typical end zone: the shaded area where the middle 50 % of retracements of that type ended (25th to 75th percentile), with a dashed line at the median.
• ★ marks the standard level closest to that median.
STATISTICS USED
About 4,700 impulses (zigzag pivots of 5 bars on each side, impulses of at least 3 ATR) on 15-minute TradingView data of EURUSD, GBPUSD, AUDUSD, USDJPY, XAUUSD, XAGUSD and WTI, April to October 2026. A retracement is measured from the end of the impulse to the next swing in the opposite direction, including the cases where price went back beyond the start of the impulse.
Median retracement and share of impulses fully retraced (reached level 1):
• Long and slow: median 0.53 · fully retraced 17 %
• Long and fast: median 0.80 · fully retraced 33 %
• Short and slow: median 0.81 · fully retraced 40 %
• Short and fast: median 1.04 · fully retraced 53 %
EXAMPLE OF USE
After a change of character (CHoCH), traders who mark fair value gaps or order blocks inside the retracement can see how often price retraced to that depth after similar impulses.
SETTINGS
• Classification: the size threshold (ATR), the duration threshold (bars) and the ATR length.
• Display: typical end zone, percentages on each level and extending the lines to the right.
• Colors.
NOTES
• The statistics describe how deep retracements usually go. They come from 15-minute data on the symbols listed above; other timeframes and markets may show different values.
• If you change the classification thresholds, the percentages shown still correspond to the default thresholds.
Notas de Lançamento
Update: impulses are now classified by size in four groups (3–4.8, 4.8–8, 8–15 and 15+ ATR) combined with speed (fast = 10 bars or fewer).The statistics now come from about 33,500 impulses on 15-minute TradingView data (7 symbols) and on 1h, 4h and daily data of 21 symbols (index futures, metals, oil, FX, crypto and US megacaps). The main finding: bigger impulses retrace less, on every timeframe.
Median retracement (slow / fast):
• 3–4.8 ATR: 0.83 / 1.03
• 4.8–8 ATR: 0.61 / 0.79
• 8–15 ATR: 0.45 / 0.60
• 15+ ATR: 0.38 / 0.52
The percentages were also checked on 1-minute data that was not used to build them, and they matched what actually happened within 1–3 points.
Script de código aberto
Em verdadeiro espírito do TradingView, o criador deste script o tornou de código aberto, para que os traders possam revisar e verificar sua funcionalidade. Parabéns ao autor! Embora você possa usá-lo gratuitamente, lembre-se de que a republicação do código está sujeita às nossas Regras da Casa.

Aviso legal
As informações e publicações não se destinam a ser, e não constituem, conselhos ou recomendações financeiras, de investimento, comerciais ou de outro tipo fornecidos ou endossados pela TradingView. Leia mais nos Termos de Uso.
Script de código aberto
Em verdadeiro espírito do TradingView, o criador deste script o tornou de código aberto, para que os traders possam revisar e verificar sua funcionalidade. Parabéns ao autor! Embora você possa usá-lo gratuitamente, lembre-se de que a republicação do código está sujeita às nossas Regras da Casa.
Aviso legal
As informações e publicações não se destinam a ser, e não constituem, conselhos ou recomendações financeiras, de investimento, comerciais ou de outro tipo fornecidos ou endossados pela TradingView. Leia mais nos Termos de Uso.