OPEN-SOURCE SCRIPT
Previous Periods Highs and Lows + Labels
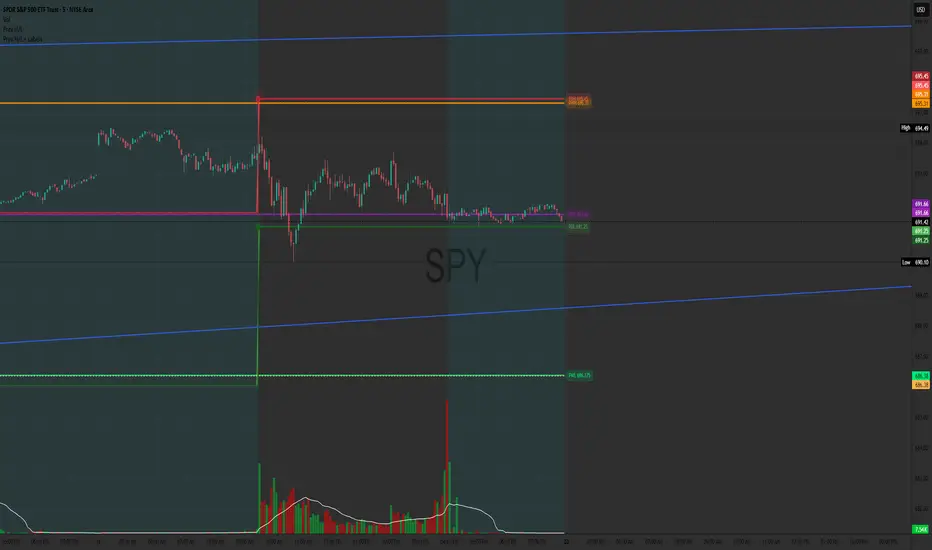
This indicator plots the high and low prices from the previous Day, Week, and Month as horizontal lines on any timeframe chart. It provides clear visual reference to key historical support and resistance levels commonly used by traders for: breakout and reversal identification
stop-loss placement
target setting
Features include distinct colors for each period and optional price labels displayed on the right side of the chart for quick reference.Simple, non-repainting, and optimized for both intraday and swing trading setups.
stop-loss placement
target setting
Features include distinct colors for each period and optional price labels displayed on the right side of the chart for quick reference.Simple, non-repainting, and optimized for both intraday and swing trading setups.
Script de código aberto
Em verdadeiro espírito do TradingView, o criador deste script o tornou de código aberto, para que os traders possam revisar e verificar sua funcionalidade. Parabéns ao autor! Embora você possa usá-lo gratuitamente, lembre-se de que a republicação do código está sujeita às nossas Regras da Casa.

Aviso legal
As informações e publicações não se destinam a ser, e não constituem, conselhos ou recomendações financeiras, de investimento, comerciais ou de outro tipo fornecidos ou endossados pela TradingView. Leia mais nos Termos de Uso.
Script de código aberto
Em verdadeiro espírito do TradingView, o criador deste script o tornou de código aberto, para que os traders possam revisar e verificar sua funcionalidade. Parabéns ao autor! Embora você possa usá-lo gratuitamente, lembre-se de que a republicação do código está sujeita às nossas Regras da Casa.
Aviso legal
As informações e publicações não se destinam a ser, e não constituem, conselhos ou recomendações financeiras, de investimento, comerciais ou de outro tipo fornecidos ou endossados pela TradingView. Leia mais nos Termos de Uso.