OPEN-SOURCE SCRIPT
Channel Breakout [EXCAVO]
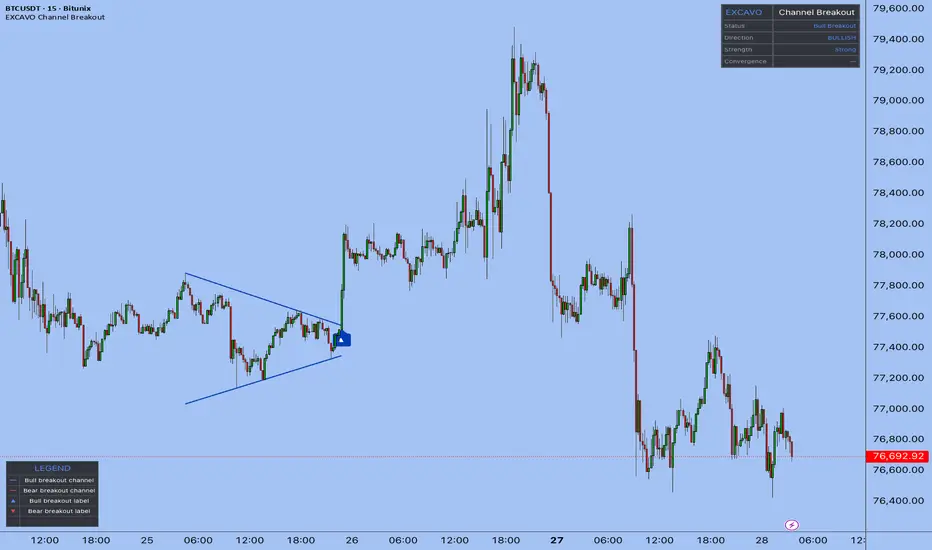
Automatic Convergent Channel Detection with Multi-Filter Breakout Confirmation
The Channel Breakout automatically detects convergent channel patterns — wedges, flags, and triangles — by fitting trendlines through confirmed swing pivots on both boundaries simultaneously. When price breaks out with volume and momentum confirmation, the indicator signals the direction with colored channel lines and an entry label on the breakout candle.
This is not a basic highest/lowest channel. The boundaries are built from verified pivot points, and a convergence filter ensures only genuinely contracting channels qualify — expanding ranges and sideways boxes are excluded.
━━━━━━━━━━━━━━━━━━━━━━━━━━━━━━━━━━━━━━━
▸ HOW TO USE
Step 1 → Add the indicator. It begins scanning for convergent channel
patterns using swing pivots on the current timeframe.
Step 2 → Wait for a channel to form. The indicator draws the upper and
lower boundary lines in blue while price remains inside.
Step 3 → Watch for the breakout signal. When price closes beyond either
boundary with confirmation, channel lines turn blue (bull) or
red (bear), and an arrow label appears on the breakout candle.
Step 4 → Check the dashboard. It shows the current pattern state,
breakout strength (Strong / Medium / Weak), and the directional
bias score that built up while price was inside the channel.
Step 5 → Read the strength rating. Strong breakouts combine high volume,
deep body penetration, and RSI alignment. Weak breakouts show
fewer confirming factors and may warrant additional analysis.
━━━━━━━━━━━━━━━━━━━━━━━━━━━━━━━━━━━━━━━
▸ HOW IT CALCULATES
◆ Pivot Detection
Swing highs and lows are identified with ta.pivothigh / ta.pivotlow using a
configurable lookback (Pivot Detection Length, default 5 bars each side). Only
confirmed, closed pivots are used — no repainting. All recent pivots within the
Max Channel Width lookback are stored and passed to the trendline fitting engine.
◆ Best-Fit Trendline Algorithm
For the upper boundary, the engine tests every pair of stored pivot highs (a, b).
For each candidate line through (a, b), it counts how many other pivot highs lie
within ATR × Touch Tolerance of the line while no pivot exceeds it by more than
ATR × Max Deviation. The line with the most qualifying touches becomes the upper
boundary. The same process runs independently for pivot lows to find the lower
boundary. Both boundaries must exist with at least Min Touches (default 2) to
form a valid channel.
◆ Convergence Filter
Once both boundaries are found, the engine measures channel width at the earliest
shared bar (widthStart) and at the current bar (widthNow):
convRate = 1 − (widthNow / widthStart)
A channel is only accepted when convRate >= Min Convergence Rate (default 0.02).
This rejects expanding wedges and flat ranges, keeping only contracting patterns.
◆ Breakout Detection and Strength Score
On each confirmed bar close, the engine projects both boundary lines to the current
bar. A bull breakout fires when close > upper boundary; a bear breakout when
close < lower boundary. The breakout strength score blends five components:
penetration depth relative to ATR (25%), candle body ratio (15%), body commitment
relative to the broken boundary (15%), volume vs SMA-20 spike (25%), and RSI
alignment above/below 50 (20%). Score >= 65 = Strong, >= 35 = Medium, < 35 = Weak.
◆ Confirmation Filters
Three optional filters gate the breakout signal. Volume Spike Multiplier requires
the breakout bar's volume to exceed 20-bar SMA by a configurable factor. Volume
Contraction Filter requires that average volume inside the channel was lower than
before the channel formed — confirming energy compression. Momentum Confirmation
requires RSI > 50 for bull breakouts and RSI < 50 for bear breakouts. Any filter
can be disabled for forex or low-volume instruments.
━━━━━━━━━━━━━━━━━━━━━━━━━━━━━━━━━━━━━━━
▸ WHAT MAKES IT DIFFERENT
◆ Pivot-Confirmed Boundaries
Most auto-channel scripts use ta.highest / ta.lowest, which anchors lines to the
highest wick in a window regardless of pattern shape. This indicator builds
boundaries only through confirmed swing pivot points, the same anchor logic a
trader would use when drawing manually.
◆ Convergence-Only Filter
The convRate filter rejects any channel that is not actively narrowing. Sideways
ranges, expanding wedges, and parallel channels are all excluded. Only patterns
where price is compressing toward a decision point qualify.
◆ Best-Fit Touch Counting
The engine evaluates every pair of pivots and selects the line with the highest
touch count, not just the first two pivots it finds. A channel supported by four
touches is stronger than one supported by two, and the algorithm reflects that
by preferring denser confirmation.
◆ Multi-Component Strength Score
The breakout strength is not a simple volume check. It combines five independent
signals — penetration depth, body ratio, body commitment relative to the broken
level, volume spike, and momentum direction — into a single 0-100 score that
classifies the breakout as Strong, Medium, or Weak.
◆ Directional Bias Score
While price is inside the channel, the dashboard tracks a real-time directional
bias built from channel slope (35%), RSI deviation from 50 (35%), and price
position within the channel range (30%). This gives a probabilistic lean on
which side of the channel is more likely to break before the signal fires.
━━━━━━━━━━━━━━━━━━━━━━━━━━━━━━━━━━━━━━━
▸ DASHBOARD
Real-time panel (top right) with key state metrics:
Legend table (bottom left) explains every visual element. Toggle in Dashboard settings.
━━━━━━━━━━━━━━━━━━━━━━━━━━━━━━━━━━━━━━━
▸ SETTINGS
Main Settings
Filters
Visual
Channel Lines
Risk Management
Dashboard
Advanced
Alerts
━━━━━━━━━━━━━━━━━━━━━━━━━━━━━━━━━━━━━━━
▸ ALERTS
━━━━━━━━━━━━━━━━━━━━━━━━━━━━━━━━━━━━━━━
Best regards,
EXCAVO
The Channel Breakout automatically detects convergent channel patterns — wedges, flags, and triangles — by fitting trendlines through confirmed swing pivots on both boundaries simultaneously. When price breaks out with volume and momentum confirmation, the indicator signals the direction with colored channel lines and an entry label on the breakout candle.
This is not a basic highest/lowest channel. The boundaries are built from verified pivot points, and a convergence filter ensures only genuinely contracting channels qualify — expanding ranges and sideways boxes are excluded.
━━━━━━━━━━━━━━━━━━━━━━━━━━━━━━━━━━━━━━━
▸ HOW TO USE
Step 1 → Add the indicator. It begins scanning for convergent channel
patterns using swing pivots on the current timeframe.
Step 2 → Wait for a channel to form. The indicator draws the upper and
lower boundary lines in blue while price remains inside.
Step 3 → Watch for the breakout signal. When price closes beyond either
boundary with confirmation, channel lines turn blue (bull) or
red (bear), and an arrow label appears on the breakout candle.
Step 4 → Check the dashboard. It shows the current pattern state,
breakout strength (Strong / Medium / Weak), and the directional
bias score that built up while price was inside the channel.
Step 5 → Read the strength rating. Strong breakouts combine high volume,
deep body penetration, and RSI alignment. Weak breakouts show
fewer confirming factors and may warrant additional analysis.
━━━━━━━━━━━━━━━━━━━━━━━━━━━━━━━━━━━━━━━
▸ HOW IT CALCULATES
◆ Pivot Detection
Swing highs and lows are identified with ta.pivothigh / ta.pivotlow using a
configurable lookback (Pivot Detection Length, default 5 bars each side). Only
confirmed, closed pivots are used — no repainting. All recent pivots within the
Max Channel Width lookback are stored and passed to the trendline fitting engine.
◆ Best-Fit Trendline Algorithm
For the upper boundary, the engine tests every pair of stored pivot highs (a, b).
For each candidate line through (a, b), it counts how many other pivot highs lie
within ATR × Touch Tolerance of the line while no pivot exceeds it by more than
ATR × Max Deviation. The line with the most qualifying touches becomes the upper
boundary. The same process runs independently for pivot lows to find the lower
boundary. Both boundaries must exist with at least Min Touches (default 2) to
form a valid channel.
◆ Convergence Filter
Once both boundaries are found, the engine measures channel width at the earliest
shared bar (widthStart) and at the current bar (widthNow):
convRate = 1 − (widthNow / widthStart)
A channel is only accepted when convRate >= Min Convergence Rate (default 0.02).
This rejects expanding wedges and flat ranges, keeping only contracting patterns.
◆ Breakout Detection and Strength Score
On each confirmed bar close, the engine projects both boundary lines to the current
bar. A bull breakout fires when close > upper boundary; a bear breakout when
close < lower boundary. The breakout strength score blends five components:
penetration depth relative to ATR (25%), candle body ratio (15%), body commitment
relative to the broken boundary (15%), volume vs SMA-20 spike (25%), and RSI
alignment above/below 50 (20%). Score >= 65 = Strong, >= 35 = Medium, < 35 = Weak.
◆ Confirmation Filters
Three optional filters gate the breakout signal. Volume Spike Multiplier requires
the breakout bar's volume to exceed 20-bar SMA by a configurable factor. Volume
Contraction Filter requires that average volume inside the channel was lower than
before the channel formed — confirming energy compression. Momentum Confirmation
requires RSI > 50 for bull breakouts and RSI < 50 for bear breakouts. Any filter
can be disabled for forex or low-volume instruments.
━━━━━━━━━━━━━━━━━━━━━━━━━━━━━━━━━━━━━━━
▸ WHAT MAKES IT DIFFERENT
◆ Pivot-Confirmed Boundaries
Most auto-channel scripts use ta.highest / ta.lowest, which anchors lines to the
highest wick in a window regardless of pattern shape. This indicator builds
boundaries only through confirmed swing pivot points, the same anchor logic a
trader would use when drawing manually.
◆ Convergence-Only Filter
The convRate filter rejects any channel that is not actively narrowing. Sideways
ranges, expanding wedges, and parallel channels are all excluded. Only patterns
where price is compressing toward a decision point qualify.
◆ Best-Fit Touch Counting
The engine evaluates every pair of pivots and selects the line with the highest
touch count, not just the first two pivots it finds. A channel supported by four
touches is stronger than one supported by two, and the algorithm reflects that
by preferring denser confirmation.
◆ Multi-Component Strength Score
The breakout strength is not a simple volume check. It combines five independent
signals — penetration depth, body ratio, body commitment relative to the broken
level, volume spike, and momentum direction — into a single 0-100 score that
classifies the breakout as Strong, Medium, or Weak.
◆ Directional Bias Score
While price is inside the channel, the dashboard tracks a real-time directional
bias built from channel slope (35%), RSI deviation from 50 (35%), and price
position within the channel range (30%). This gives a probabilistic lean on
which side of the channel is more likely to break before the signal fires.
━━━━━━━━━━━━━━━━━━━━━━━━━━━━━━━━━━━━━━━
▸ DASHBOARD
Real-time panel (top right) with key state metrics:
- Status - Active (channel forming) / Bull Breakout / Bear Breakout / Scanning
- Direction - directional bias with arrow and % while channel is active (e.g. ▲ 64%); BULLISH or BEARISH after breakout
- Strength - Strong / Medium / Weak (breakout strength score); — while channel is forming
- Convergence - narrowing rate of the active channel in %; — when no channel
Legend table (bottom left) explains every visual element. Toggle in Dashboard settings.
━━━━━━━━━━━━━━━━━━━━━━━━━━━━━━━━━━━━━━━
▸ SETTINGS
Main Settings
- Pivot Detection Length - 5 (bars left/right for swing pivot confirmation; lower = more sensitive)
- Min Touches per Boundary - 2 (minimum pivot touches required per trendline)
- Max Channel Width (bars) - 120 (maximum lookback for channel search)
- Min Convergence Rate - 0.02 (minimum narrowing ratio; higher = stricter contraction)
Filters
- Volume Spike Mult - 1.2 (breakout bar volume vs SMA-20; set 0.5 to disable on forex)
- Volume Contraction Filter - ON (require declining volume inside the channel)
- Momentum Confirmation - ON (RSI > 50 for bull, < 50 for bear)
Visual
- Show Channel Patterns - ON (draw boundary lines)
- Show Pattern Background - OFF (subtle bgcolor while inside active channel)
Channel Lines
- Line Width - 2 (boundary line thickness; 1-4)
Risk Management
- Show Entry Labels - ON (arrow label on the breakout candle)
Dashboard
- Show Dashboard - ON
- Position - Top Right (Top Left / Top Right / Bottom Left / Bottom Right)
- Font Size - Small (Small / Normal)
Advanced
- Touch Tolerance (ATR) - 0.15 (pivot distance to count as a touch; 0.10-0.25)
- Max Deviation (ATR) - 0.30 (maximum pivot overshoot from the line)
- Min Channel Width (ATR) - 0.5 (minimum channel width filter)
Alerts
- JSON Alerts - OFF (structured JSON payload for 3Commas, Wunderbit, and similar bots)
━━━━━━━━━━━━━━━━━━━━━━━━━━━━━━━━━━━━━━━
▸ ALERTS
- Bull Breakout - price closes above the upper channel boundary with confirmation
- Bear Breakout - price closes below the lower channel boundary with confirmation
- Any Breakout - either direction; use for a single alert covering both signals
- New Pattern - a new convergent channel has been detected and is now active
━━━━━━━━━━━━━━━━━━━━━━━━━━━━━━━━━━━━━━━
Best regards,
EXCAVO
Disclaimer
Trading involves significant risk. This indicator is a technical analysis tool
and does not constitute financial advice, investment recommendations, or a
guarantee of future results. Past indicator behavior does not guarantee future
performance. Always use proper risk management and your own judgment.
Script de código aberto
Em verdadeiro espírito do TradingView, o criador deste script o tornou de código aberto, para que os traders possam revisar e verificar sua funcionalidade. Parabéns ao autor! Embora você possa usá-lo gratuitamente, lembre-se de que a republicação do código está sujeita às nossas Regras da Casa.

bitunix.com/register?vipCode=Ri1J7239
trading-tournaments.com/tournaments
Free analysis→ t.me/+Qm96gDz3qdyNOs8t
Indicators → excavo.com/
Strategies t.me/ExcavoPulseBot
🎓 → t.me/EXCAVOREFF_bot
trading-tournaments.com/tournaments
Free analysis→ t.me/+Qm96gDz3qdyNOs8t
Indicators → excavo.com/
Strategies t.me/ExcavoPulseBot
🎓 → t.me/EXCAVOREFF_bot
Aviso legal
As informações e publicações não se destinam a ser, e não constituem, conselhos ou recomendações financeiras, de investimento, comerciais ou de outro tipo fornecidos ou endossados pela TradingView. Leia mais nos Termos de Uso.
Script de código aberto
Em verdadeiro espírito do TradingView, o criador deste script o tornou de código aberto, para que os traders possam revisar e verificar sua funcionalidade. Parabéns ao autor! Embora você possa usá-lo gratuitamente, lembre-se de que a republicação do código está sujeita às nossas Regras da Casa.
bitunix.com/register?vipCode=Ri1J7239
trading-tournaments.com/tournaments
Free analysis→ t.me/+Qm96gDz3qdyNOs8t
Indicators → excavo.com/
Strategies t.me/ExcavoPulseBot
🎓 → t.me/EXCAVOREFF_bot
trading-tournaments.com/tournaments
Free analysis→ t.me/+Qm96gDz3qdyNOs8t
Indicators → excavo.com/
Strategies t.me/ExcavoPulseBot
🎓 → t.me/EXCAVOREFF_bot
Aviso legal
As informações e publicações não se destinam a ser, e não constituem, conselhos ou recomendações financeiras, de investimento, comerciais ou de outro tipo fornecidos ou endossados pela TradingView. Leia mais nos Termos de Uso.