TPC Market + Sector Alignment
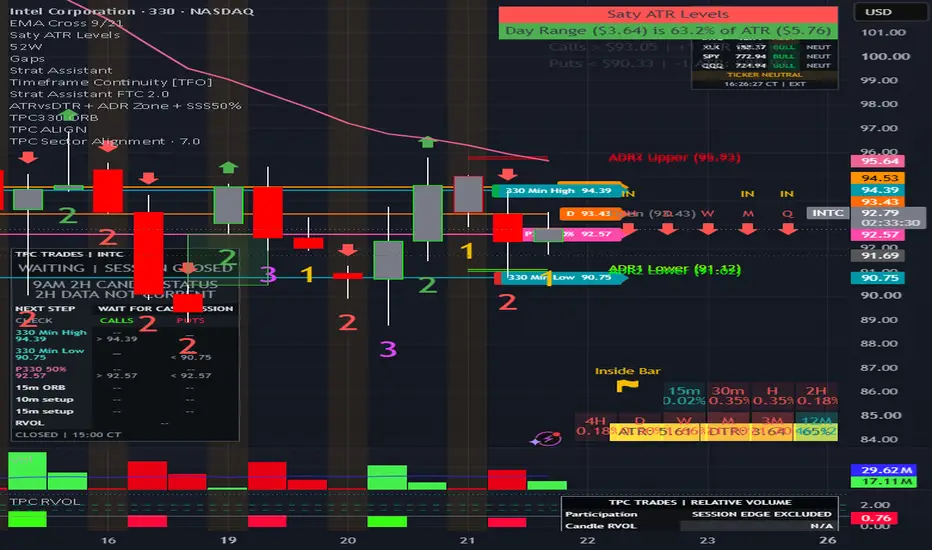
**TPC Market + Sector Alignment**
See whether your stock’s direction is supported by its sector and applicable market indexes—all in one compact dashboard.
The indicator automatically matches supported stocks to their sector ETF and displays each symbol’s price, bullish/bearish/neutral bias, and alignment with the chart ticker. SPY and QQQ appear only for stocks included in the indicator’s saved membership lists.
**Reading the dashboard**
* **YES:** The peer supports your stock’s direction.
* **NO:** The peer opposes your stock’s direction.
* **NEUT:** The stock or peer is neutral.
* **WAIT:** Required data is unavailable or unsynchronized.
* **BULL / BEAR ALIGNMENT:** Your stock and every displayed peer agree.
* **PARTIAL ALIGNMENT:** Some peers support the stock while others remain neutral.
* **CONFLICT:** At least one displayed peer opposes the stock.
By default, shorter intraday comparisons use price relative to the session open and VWAP. Comparisons of 390 minutes or longer use the 9/21 EMA trend. Direction rules, timeframe, session, and sector ETF can be customized.
The dashboard follows your chart timeframe by default and updates as TradingView receives price data. Compact and full layouts are available, along with alerts for bullish alignment, bearish alignment, conflict, and lost alignment.
Use alignment alongside your ORB, key levels, volume, and risk plan. Alignment provides context; it does not replace an entry trigger.
Live readings can change before candle close, and feed delays apply. Sector classifications and index membership lists are dated and do not automatically refresh. Unmatched stocks require manual ETF selection.
**Plan your trade. Trade your plan.**
See whether your stock’s direction is supported by its sector and applicable market indexes—all in one compact dashboard.
The indicator automatically matches supported stocks to their sector ETF and displays each symbol’s price, bullish/bearish/neutral bias, and alignment with the chart ticker. SPY and QQQ appear only for stocks included in the indicator’s saved membership lists.
**Reading the dashboard**
* **YES:** The peer supports your stock’s direction.
* **NO:** The peer opposes your stock’s direction.
* **NEUT:** The stock or peer is neutral.
* **WAIT:** Required data is unavailable or unsynchronized.
* **BULL / BEAR ALIGNMENT:** Your stock and every displayed peer agree.
* **PARTIAL ALIGNMENT:** Some peers support the stock while others remain neutral.
* **CONFLICT:** At least one displayed peer opposes the stock.
By default, shorter intraday comparisons use price relative to the session open and VWAP. Comparisons of 390 minutes or longer use the 9/21 EMA trend. Direction rules, timeframe, session, and sector ETF can be customized.
The dashboard follows your chart timeframe by default and updates as TradingView receives price data. Compact and full layouts are available, along with alerts for bullish alignment, bearish alignment, conflict, and lost alignment.
Use alignment alongside your ORB, key levels, volume, and risk plan. Alignment provides context; it does not replace an entry trigger.
Live readings can change before candle close, and feed delays apply. Sector classifications and index membership lists are dated and do not automatically refresh. Unmatched stocks require manual ETF selection.
**Plan your trade. Trade your plan.**

Aviso legal
As informações e publicações não se destinam a ser, e não constituem, conselhos ou recomendações financeiras, de investimento, comerciais ou de outro tipo fornecidos ou endossados pela TradingView. Leia mais nos Termos de Uso.
Aviso legal
As informações e publicações não se destinam a ser, e não constituem, conselhos ou recomendações financeiras, de investimento, comerciais ou de outro tipo fornecidos ou endossados pela TradingView. Leia mais nos Termos de Uso.