OPEN-SOURCE SCRIPT
Atualizado FLOOP Pro
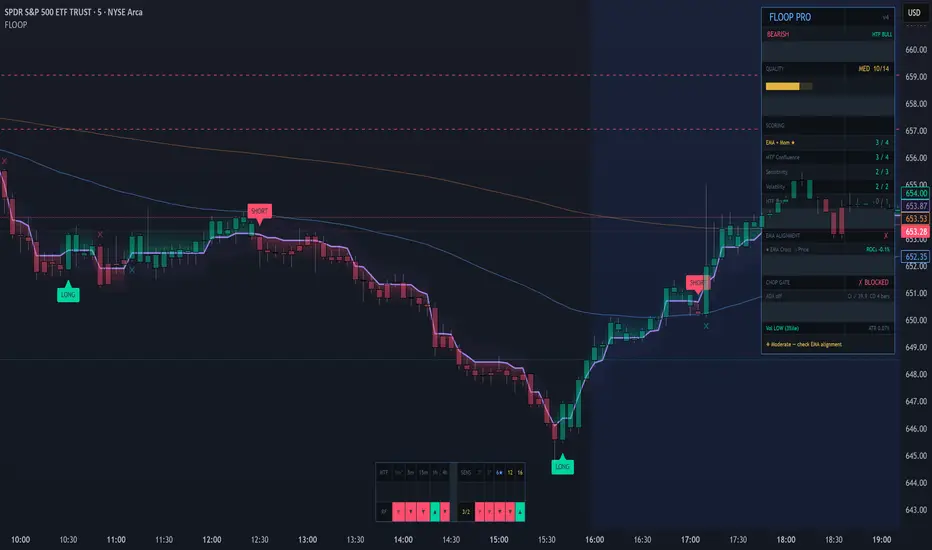
FLOOP Pro — Finally Long Or Obviously Panicking
ML-Optimized Range Filter Indicator for NQ Futures (works on all markets)
━━━━━━━━━━━━━━━━━━━━━━━━━━━━━━━━━━━━━━━━━━━━━━━━━━━━
WHAT IS FLOOP?
FLOOP is an ATR-adaptive range filter indicator built from the ground up and
optimized using a machine learning ensemble of Random Forest, XGBoost, and
LightGBM models trained across 8,000 bars and 3 distinct market regimes
(trending, choppy, and volatile). Every scoring weight, confluence factor, and
signal filter in this indicator was derived from ML feature importance analysis
— not guesswork.
━━━━━━━━━━━━━━━━━━━━━━━━━━━━━━━━━━━━━━━━━━━━━━━━━━━━
FORWARD TEST RESULTS (NQ Futures, historical data)
5-Minute Chart (Sensitivity 5 | TP 3.0× | SL 2.2×)
✦ Win Rate: 83.7%
✦ Profit Factor: 5.66
✦ Expectancy: +43.51 pts/trade
✦ Max Loss Streak: 3 in a row
✦ Max Drawdown: -241 pts
15-Minute Chart (Sensitivity 2 | TP 1.5× | SL 2.2×)
✦ Win Rate: 88.2%
✦ Profit Factor: 4.11
✦ Expectancy: +33.09 pts/trade
✦ Max Loss Streak: 4 in a row
✦ Max Drawdown: -504 pts
Results generated using the built-in forward test engine. Past performance
does not guarantee future results. Always paper trade before going live.
━━━━━━━━━━━━━━━━━━━━━━━━━━━━━━━━━━━━━━━━━━━━━━━━━━━━
HOW THE ML OPTIMIZATION WORKS
The original Bloop-style range filter scores signals on a simple 10-point
system. FLOOP replaces that with an ML-derived 14-point scoring system based
on the following discoveries:
#1 — EMA Alignment (36% importance) was completely MISSING from the original
scoring. ML found it lifts win rate by +27 percentage points when aligned
vs not aligned (61.5% vs 34.2%). It now contributes 4 pts to the score.
#2 — Momentum / ROC (38% importance) was the single strongest predictor of
trade success. Rate of change across 5, 10, and 20 bars is now scored.
#3 — ATR Normalized (volatility as % of price) was top-3 predictor.
Volatility bucket weight doubled from 1pt to 2pts.
#4 — HTF Range Filter alone was only 3.8% importance. Weight reduced from
2pts to 1pt. EMA cross is a far stronger trend filter.
#5 — 1-minute MTF = 0% importance. Removed from scoring entirely.
#6 — Sensitivity S:3 and S:5 = 0% importance. Removed.
S:12 gets 2pts, S:16 gets 1pt based on ML weighting.
SCORING BREAKDOWN (out of 14):
HTF Agreement: 1 pt
MTF Confluence: 4 pts (5m / 15m / 1h / 4h)
Sensitivity Check: 3 pts (S:12 = 2pt, S:16 = 1pt)
EMA + Momentum: 4 pts ← NEW, biggest predictor
Volatility: 2 pts ← doubled from original
━━━━━━━━━━━━━━━━━━━━━━━━━━━━━━━━━━━━━━━━━━━━━━━━━━━━
FEATURES
✦ ML-Optimized Signal Strength Score (0–14)
✦ Visual strength bar with HIGH / MEDIUM / LOW / VERY LOW grade
✦ Auto TP1, TP2, and Stop Loss lines drawn on chart (ATR-scaled)
✦ Live R:R ratio and P&L displayed on dashboard
✦ ATR Percentile — know if volatility is unusually high or low
✦ EMA Alignment filter — optionally suppress low-quality signals
✦ MTF Bias table (1m / 5m / 15m / 1h / 4h) with score
✦ Sensitivity cross-check table (S:3 / 5 / current / 12 / 16)
✦ Momentum ROC display (5-bar and 20-bar)
✦ Built-in Forward Test Engine with 22 tracked metrics including:
Win rate, Profit Factor, Expectancy, Realized R:R,
Max Drawdown, Win/Loss Streaks, Best/Worst trade, Grade A-D
✦ 3 exit modes: TP1/SL, TP1/SL or Flip, Flip Only
✦ 6 alert types including EMA-confirmed and high-quality only
✦ Full color customization
✦ Filtered signal markers (shows suppressed signals as ✕)
━━━━━━━━━━━━━━━━━━━━━━━━━━━━━━━━━━━━━━━━━━━━━━━━━━━━
RECOMMENDED SETTINGS
5-Minute NQ:
Sensitivity 5 | ATR Mult 1.6 | TP 3.0× | SL 2.2×
EMA 25/75 | HTF 15m | EMA Filter ON
15-Minute NQ:
Sensitivity 2 | ATR Mult 1.6 | TP 1.5× | SL 2.2×
EMA 25/75 | HTF 1h | EMA Filter ON
Signal Quality Guide:
11–14 / 14 → High conviction. Take it.
8–10 / 14 → Moderate. Wait for EMA alignment.
5–7 / 14 → Low. Consider skipping.
0–4 / 14 → Very low. Stay out.
━━━━━━━━━━━━━━━━━━━━━━━━━━━━━━━━━━━━━━━━━━━━━━━━━━━━
IMPORTANT DISCLAIMER
This indicator is for educational purposes only. Forward test results are
simulated using historical bar data and do not account for slippage,
commissions, spread, or execution latency. Past performance does not guarantee
future results. Trading futures involves substantial risk of loss. Never risk
more than you can afford to lose. Always paper trade before going live.
━━━━━━━━━━━━━━━━━━━━━━━━━━━━━━━━━━━━━━━━━━━━━━━━━━━━
ML-Optimized Range Filter Indicator for NQ Futures (works on all markets)
━━━━━━━━━━━━━━━━━━━━━━━━━━━━━━━━━━━━━━━━━━━━━━━━━━━━
WHAT IS FLOOP?
FLOOP is an ATR-adaptive range filter indicator built from the ground up and
optimized using a machine learning ensemble of Random Forest, XGBoost, and
LightGBM models trained across 8,000 bars and 3 distinct market regimes
(trending, choppy, and volatile). Every scoring weight, confluence factor, and
signal filter in this indicator was derived from ML feature importance analysis
— not guesswork.
━━━━━━━━━━━━━━━━━━━━━━━━━━━━━━━━━━━━━━━━━━━━━━━━━━━━
FORWARD TEST RESULTS (NQ Futures, historical data)
5-Minute Chart (Sensitivity 5 | TP 3.0× | SL 2.2×)
✦ Win Rate: 83.7%
✦ Profit Factor: 5.66
✦ Expectancy: +43.51 pts/trade
✦ Max Loss Streak: 3 in a row
✦ Max Drawdown: -241 pts
15-Minute Chart (Sensitivity 2 | TP 1.5× | SL 2.2×)
✦ Win Rate: 88.2%
✦ Profit Factor: 4.11
✦ Expectancy: +33.09 pts/trade
✦ Max Loss Streak: 4 in a row
✦ Max Drawdown: -504 pts
Results generated using the built-in forward test engine. Past performance
does not guarantee future results. Always paper trade before going live.
━━━━━━━━━━━━━━━━━━━━━━━━━━━━━━━━━━━━━━━━━━━━━━━━━━━━
HOW THE ML OPTIMIZATION WORKS
The original Bloop-style range filter scores signals on a simple 10-point
system. FLOOP replaces that with an ML-derived 14-point scoring system based
on the following discoveries:
#1 — EMA Alignment (36% importance) was completely MISSING from the original
scoring. ML found it lifts win rate by +27 percentage points when aligned
vs not aligned (61.5% vs 34.2%). It now contributes 4 pts to the score.
#2 — Momentum / ROC (38% importance) was the single strongest predictor of
trade success. Rate of change across 5, 10, and 20 bars is now scored.
#3 — ATR Normalized (volatility as % of price) was top-3 predictor.
Volatility bucket weight doubled from 1pt to 2pts.
#4 — HTF Range Filter alone was only 3.8% importance. Weight reduced from
2pts to 1pt. EMA cross is a far stronger trend filter.
#5 — 1-minute MTF = 0% importance. Removed from scoring entirely.
#6 — Sensitivity S:3 and S:5 = 0% importance. Removed.
S:12 gets 2pts, S:16 gets 1pt based on ML weighting.
SCORING BREAKDOWN (out of 14):
HTF Agreement: 1 pt
MTF Confluence: 4 pts (5m / 15m / 1h / 4h)
Sensitivity Check: 3 pts (S:12 = 2pt, S:16 = 1pt)
EMA + Momentum: 4 pts ← NEW, biggest predictor
Volatility: 2 pts ← doubled from original
━━━━━━━━━━━━━━━━━━━━━━━━━━━━━━━━━━━━━━━━━━━━━━━━━━━━
FEATURES
✦ ML-Optimized Signal Strength Score (0–14)
✦ Visual strength bar with HIGH / MEDIUM / LOW / VERY LOW grade
✦ Auto TP1, TP2, and Stop Loss lines drawn on chart (ATR-scaled)
✦ Live R:R ratio and P&L displayed on dashboard
✦ ATR Percentile — know if volatility is unusually high or low
✦ EMA Alignment filter — optionally suppress low-quality signals
✦ MTF Bias table (1m / 5m / 15m / 1h / 4h) with score
✦ Sensitivity cross-check table (S:3 / 5 / current / 12 / 16)
✦ Momentum ROC display (5-bar and 20-bar)
✦ Built-in Forward Test Engine with 22 tracked metrics including:
Win rate, Profit Factor, Expectancy, Realized R:R,
Max Drawdown, Win/Loss Streaks, Best/Worst trade, Grade A-D
✦ 3 exit modes: TP1/SL, TP1/SL or Flip, Flip Only
✦ 6 alert types including EMA-confirmed and high-quality only
✦ Full color customization
✦ Filtered signal markers (shows suppressed signals as ✕)
━━━━━━━━━━━━━━━━━━━━━━━━━━━━━━━━━━━━━━━━━━━━━━━━━━━━
RECOMMENDED SETTINGS
5-Minute NQ:
Sensitivity 5 | ATR Mult 1.6 | TP 3.0× | SL 2.2×
EMA 25/75 | HTF 15m | EMA Filter ON
15-Minute NQ:
Sensitivity 2 | ATR Mult 1.6 | TP 1.5× | SL 2.2×
EMA 25/75 | HTF 1h | EMA Filter ON
Signal Quality Guide:
11–14 / 14 → High conviction. Take it.
8–10 / 14 → Moderate. Wait for EMA alignment.
5–7 / 14 → Low. Consider skipping.
0–4 / 14 → Very low. Stay out.
━━━━━━━━━━━━━━━━━━━━━━━━━━━━━━━━━━━━━━━━━━━━━━━━━━━━
IMPORTANT DISCLAIMER
This indicator is for educational purposes only. Forward test results are
simulated using historical bar data and do not account for slippage,
commissions, spread, or execution latency. Past performance does not guarantee
future results. Trading futures involves substantial risk of loss. Never risk
more than you can afford to lose. Always paper trade before going live.
━━━━━━━━━━━━━━━━━━━━━━━━━━━━━━━━━━━━━━━━━━━━━━━━━━━━
Notas de Lançamento
A note on bloatEvery line of Pine Script costs compute time. Indicators that pile on decorative tables, in-chart forward test engines, redundant TP/SL drawing systems, and dozens of unused variables aren't just messy — they're measurably slower. TradingView has hard limits on execution time, and the more unnecessary work your script does per bar, the fewer bars it can load and the longer it takes to render. If your chart hangs or you get timeout warnings, bloat is usually why.
On the topic of built-in forward test stats: they don't work the way people think. Pine Script indicators don't have access to a proper strategy engine. Any forward test tracker built inside an indicator is running on the same data it was designed on — there's no out-of-sample separation, no accounting for slippage, no realistic fill modeling, and the results shift every time the chart reloads or the timeframe changes. The numbers look precise but they aren't reliable. If you want to forward test, do it live with a paper account or use TradingView's actual strategy tester with realistic commission and slippage settings. A fake P&L table on your chart is just confirmation bias with a nice font.
This version strips all of that out. The script is leaner, loads faster, and every remaining component earns its place.
What FLOOP does
FLOOP is a range filter + multi-timeframe confluence indicator with signal quality scoring derived from machine learning analysis. It fires long/short signals when price breaks out of a volatility-adjusted range, then scores each signal from 0–14 based on how many confirming factors align.
The ML optimization (XGBoost + Random Forest + LightGBM ensemble across 8000 bars) identified which factors actually predict winning trades and which are noise. The scoring weights reflect that analysis directly.
What's new in v4.2
Anti-Chop Filter System
The biggest problem with range filter signals is whipsaw during sideways markets. Three new filters address this, all independently toggled:
· ADX Filter (on by default, threshold 20) — Measures trend strength. When ADX is below the threshold, there's no directional move worth trading and signals are suppressed. This is the most effective single chop filter.
· Choppiness Index Filter (off by default, threshold 61.8) — Detects consolidation from a different angle than ADX. High values mean price is folding back on itself. Enable alongside ADX for maximum chop rejection.
· Signal Cooldown (on by default, 5 bars) — Enforces a minimum gap between signals. Prevents the rapid-fire long→short→long flip pattern that eats accounts in ranging markets.
These are gate conditions only. They don't modify the core range filter, so when a real breakout happens (ADX surges, Choppiness drops), signals fire cleanly. The filters only bite during the low-conviction sideways periods.
Dual Color Theme
A single dropdown switches between Dark and Light palettes. Every color in the script — chart elements, EMAs, signals, bar coloring, band fills, dashboard backgrounds, text, and borders — adapts to your chart background. No more manually adjusting 10 color inputs when you switch themes.
· Dark: The familiar neon-on-black palette (teal green, coral red, soft purple filter line)
· Light: Deeper, more saturated tones (forest green, Google red, dark purple) designed to pop against white without looking washed out
Gradient Band Shading
The trailing band around the range filter line is now rendered as 4 layered fills per side instead of a single flat fill. Each layer covers 25% of the band width with decreasing opacity, creating a smooth feathered glow that radiates outward from the filter line. The active trend direction glows (green above for bull, red below for bear) while the inactive side stays nearly transparent. It reads as a breathing aura rather than a hard-edged box.
Unified Bottom Strip
The old MTF and Sensitivity tables were two separate tables that overlapped depending on chart size. They're now merged into a single compact strip at bottom-center with a divider column between sections. Uses ▲/▼ arrows instead of text for density.
Removed: Forward Test Engine
All forward test variables, simulation logic, and the results table are gone. See the note above on why.
Removed: TP/SL System
Entry price, take profit lines, stop loss lines, P&L tracking, and R:R calculation are removed. These belong in a strategy script or your broker's interface, not an overlay indicator.
Background Tint Toggle
The trend-colored background tint is now off by default with its own toggle. Less visual noise for traders who prefer a clean chart.
Signal Quality Scoring (0–14)
ComponentMax PtsML ImportanceEMA + Momentum4~52% (EMA alignment + ROC)MTF Confluence4~10%Sensitivity Cross-Check3~9% (S:12 and S:16 only)Volatility2~23%HTF Bias1~4%Chop Penalty-2(deducted when ADX/CI signal ranging)
· 11+ → HIGH — ML-confirmed edge
· 8–10 → MED — Check EMA alignment before entry
· 6–7 → LOW — Reduced confluence, higher risk
· <6 → WEAK — Sit on your hands
Key ML finding: EMA alignment alone lifts historical win rate from 34% to 62%. It's the single biggest edge in the system.
Inputs at a glance
· Core: Sensitivity, ATR length, ATR multiplier
· EMA Overlay: Fast/Slow EMA lengths, show/hide
· Anti-Chop: ADX toggle/threshold, Choppiness toggle/threshold, Cooldown toggle/bars
· Display: Arrows, labels, filter line, band, background tint, EMA-only filter
· Dashboard: Main panel on/off + position, bottom strip on/off
· Theme: Dark / Light
Alerts
Six alert conditions are available: Long, Short, High Quality Long (11+), High Quality Short (11+), EMA-Confirmed Long, and EMA-Confirmed Short.
This script does not provide financial advice. Use it as one input in your own decision-making process. Past performance of any scoring system does not guarantee future results.
Notas de Lançamento
Added Support & Resistance lines.Notas de Lançamento
What changed:Added r1_col through s4_col
Added label.set_color() for each pivot label
Kept everything else untouched
That will make:
R labels turn green when price breaks above resistance
S labels turn red when price breaks below support
Default colors stay the same when unbroken
Script de código aberto
Em verdadeiro espírito do TradingView, o criador deste script o tornou de código aberto, para que os traders possam revisar e verificar sua funcionalidade. Parabéns ao autor! Embora você possa usá-lo gratuitamente, lembre-se de que a republicação do código está sujeita às nossas Regras da Casa.

Aviso legal
As informações e publicações não se destinam a ser, e não constituem, conselhos ou recomendações financeiras, de investimento, comerciais ou de outro tipo fornecidos ou endossados pela TradingView. Leia mais nos Termos de Uso.
Script de código aberto
Em verdadeiro espírito do TradingView, o criador deste script o tornou de código aberto, para que os traders possam revisar e verificar sua funcionalidade. Parabéns ao autor! Embora você possa usá-lo gratuitamente, lembre-se de que a republicação do código está sujeita às nossas Regras da Casa.
Aviso legal
As informações e publicações não se destinam a ser, e não constituem, conselhos ou recomendações financeiras, de investimento, comerciais ou de outro tipo fornecidos ou endossados pela TradingView. Leia mais nos Termos de Uso.